Is Bitcoin Ready to Rally Again or is Another Drop to $60K Coming? (BTC Price Analysis)
Bitcoin’s price has been consolidating over the last few weeks after a failure to break above the $75K mark. Yet, things might be about to change.
Bitcoin Price Analysis: Technicals
By TradingRage
The Daily Chart
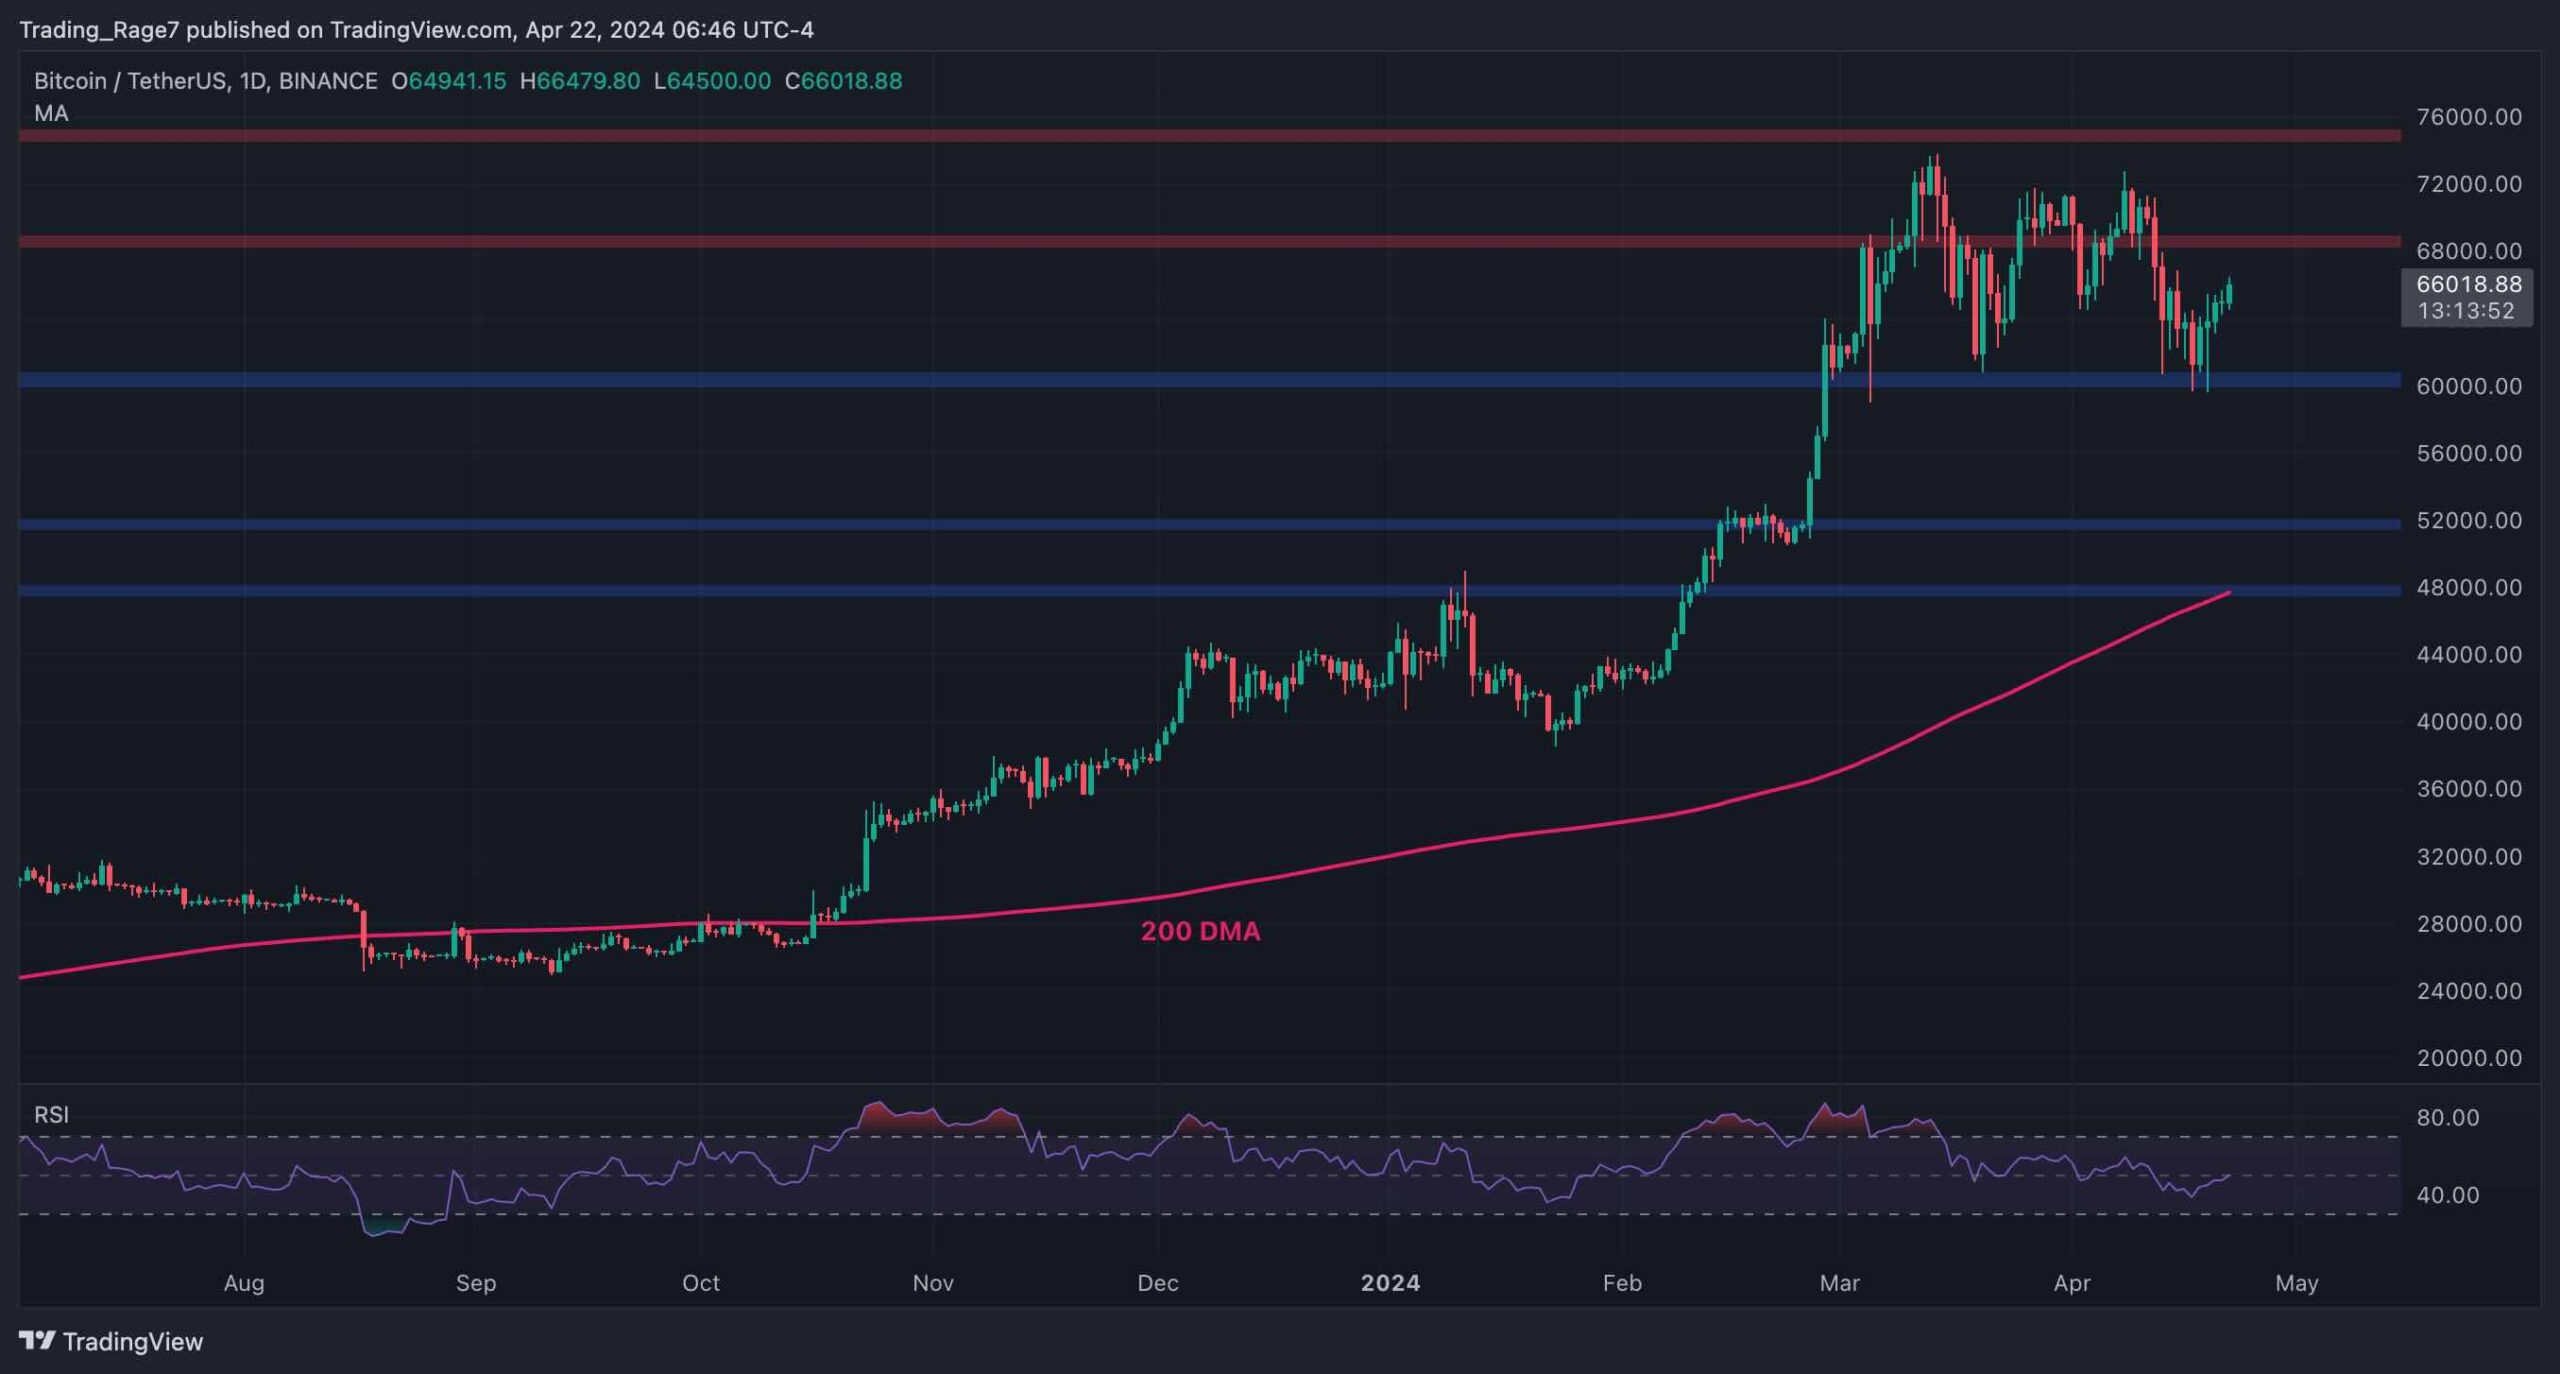
On the daily chart, the price is still trapped between the $60K and $68K levels, failing to break out to either side. That said, during the past few days, the bulls have made considerable progress and have been able to push the BTC price closer to $68K.
A breakout above the $68K level might likely induce a continuation. On the other hand, a breakdown of the $60K level can be catastrophic, as the price can drop as low as $52K in a short period.
The 4-Hour Chart
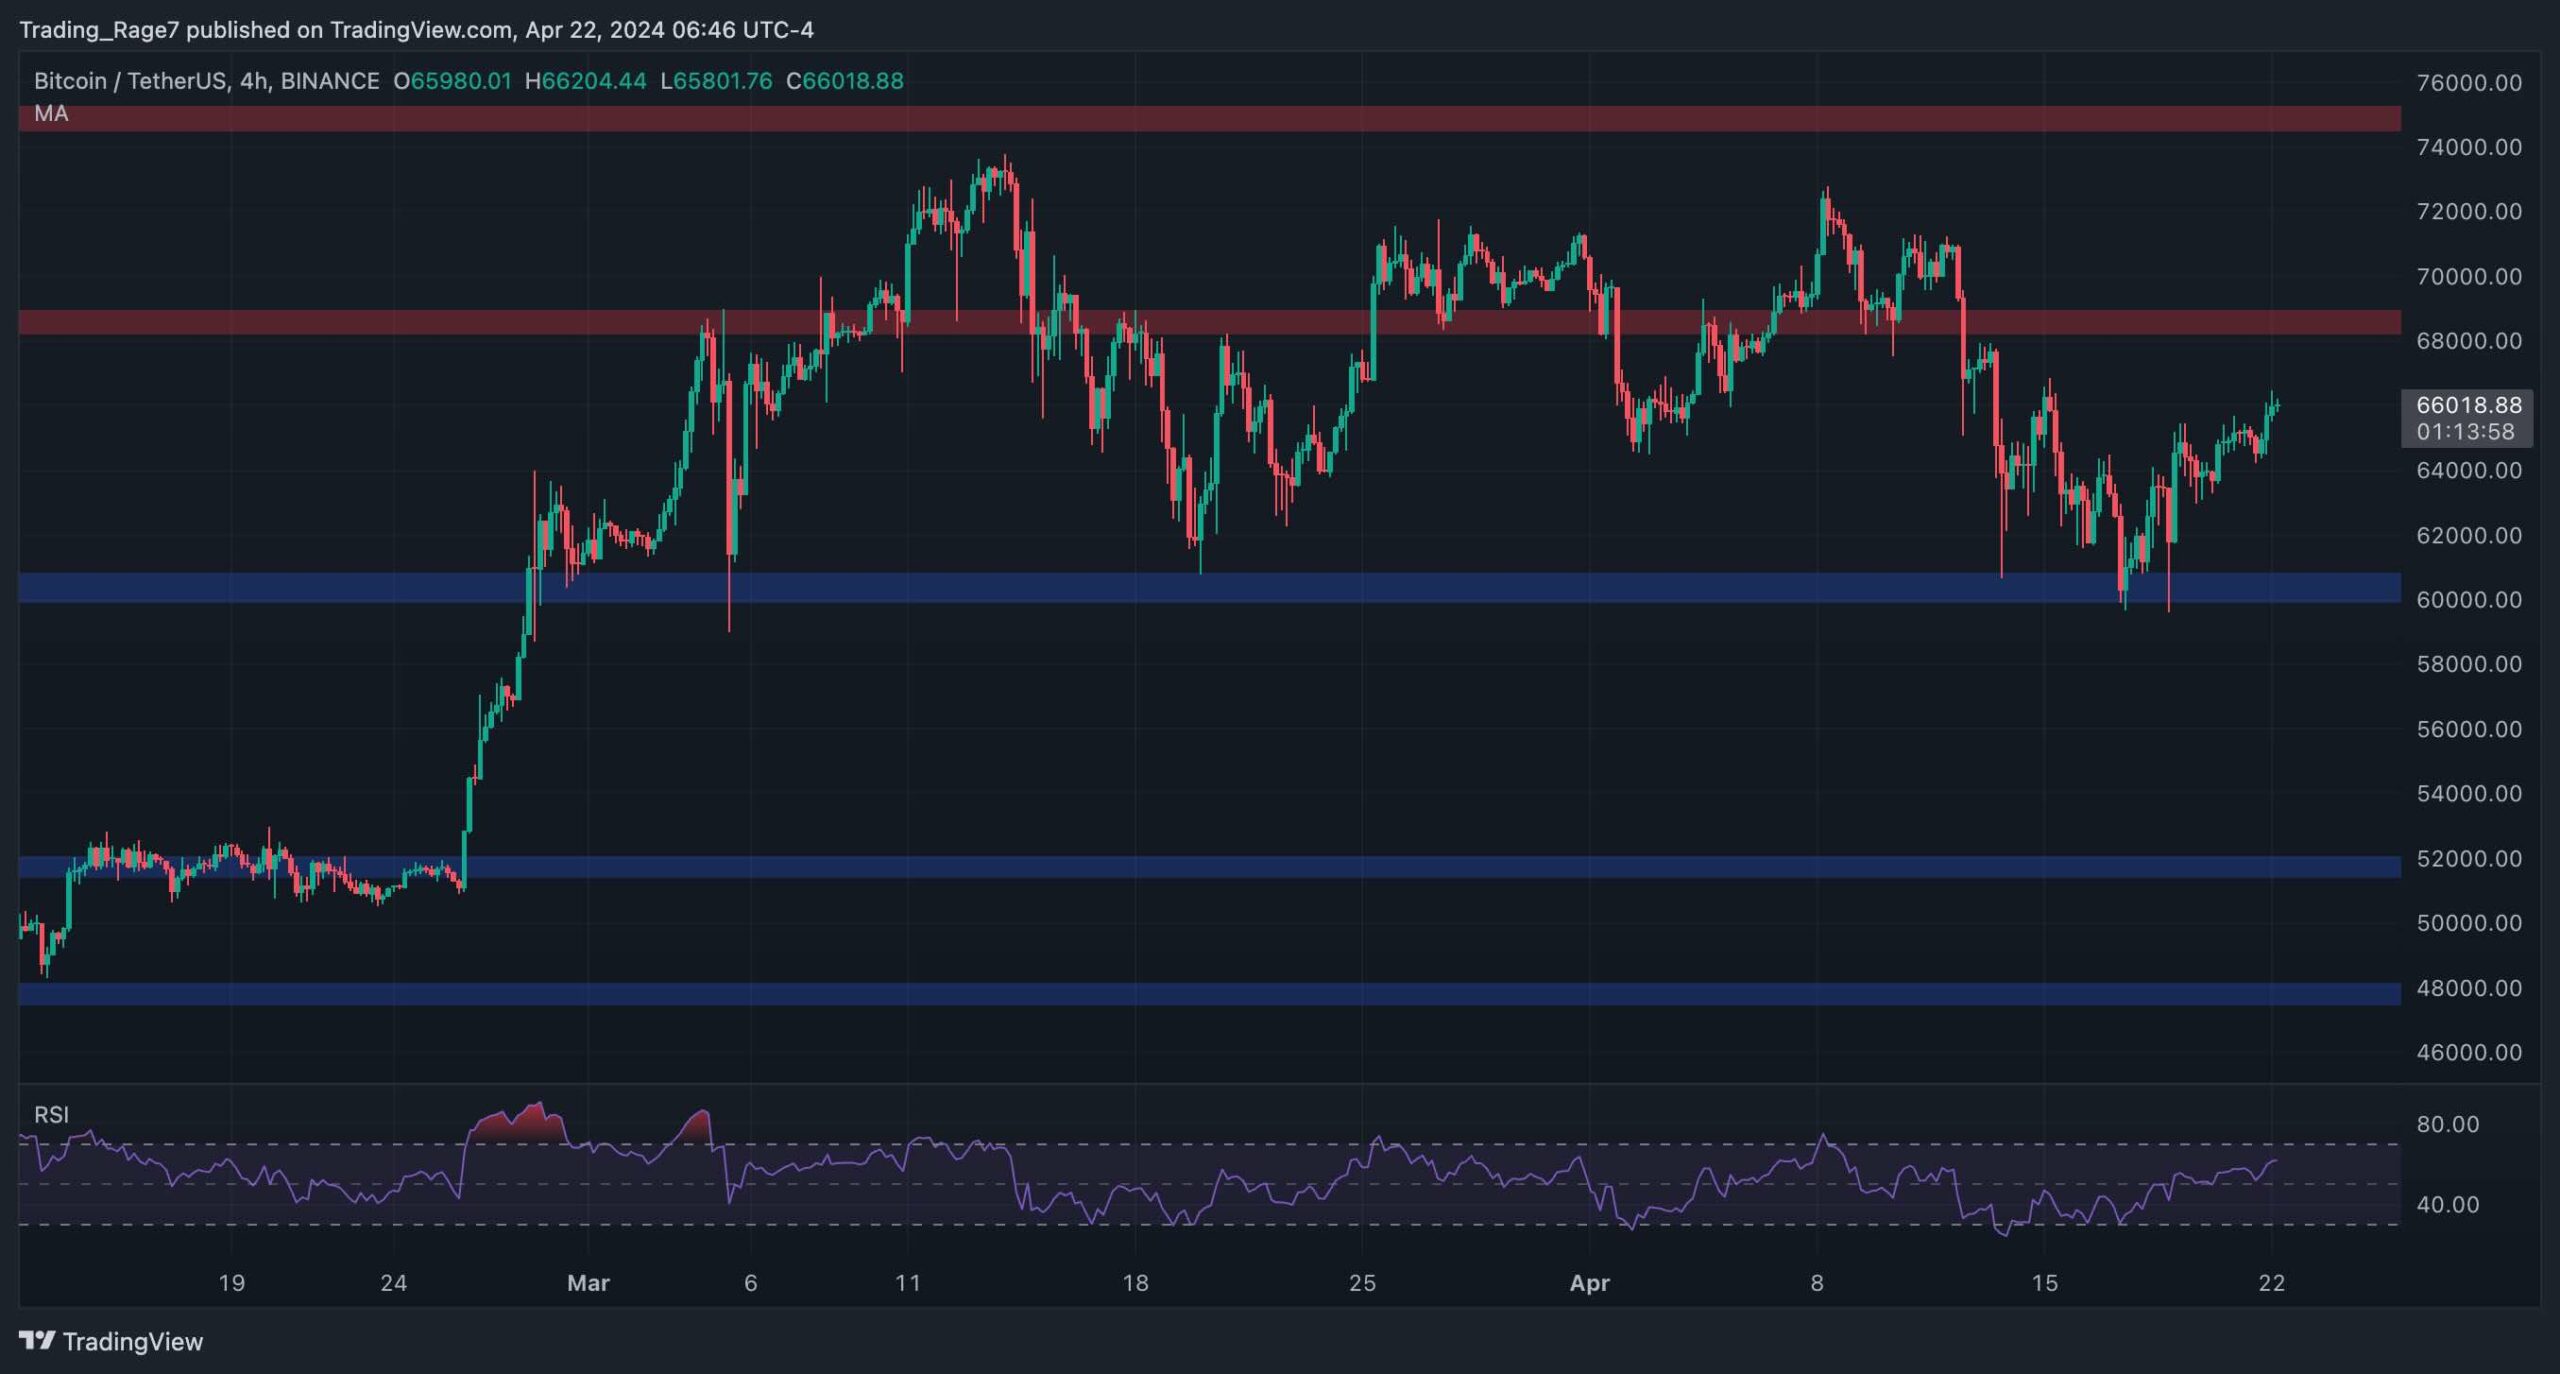
Looking at the 4-hour chart, the price structure shifted after retesting the $60K support zone. The market is making higher highs and lows, pushing toward the $68K resistance level.
The Relative Strength Index has also risen above the 50% threshold, indicating that the momentum is also in favor of a rally toward $68K in the short term.
On-Chain Analysis
By TradingRage
Bitcoin Miner Outflow
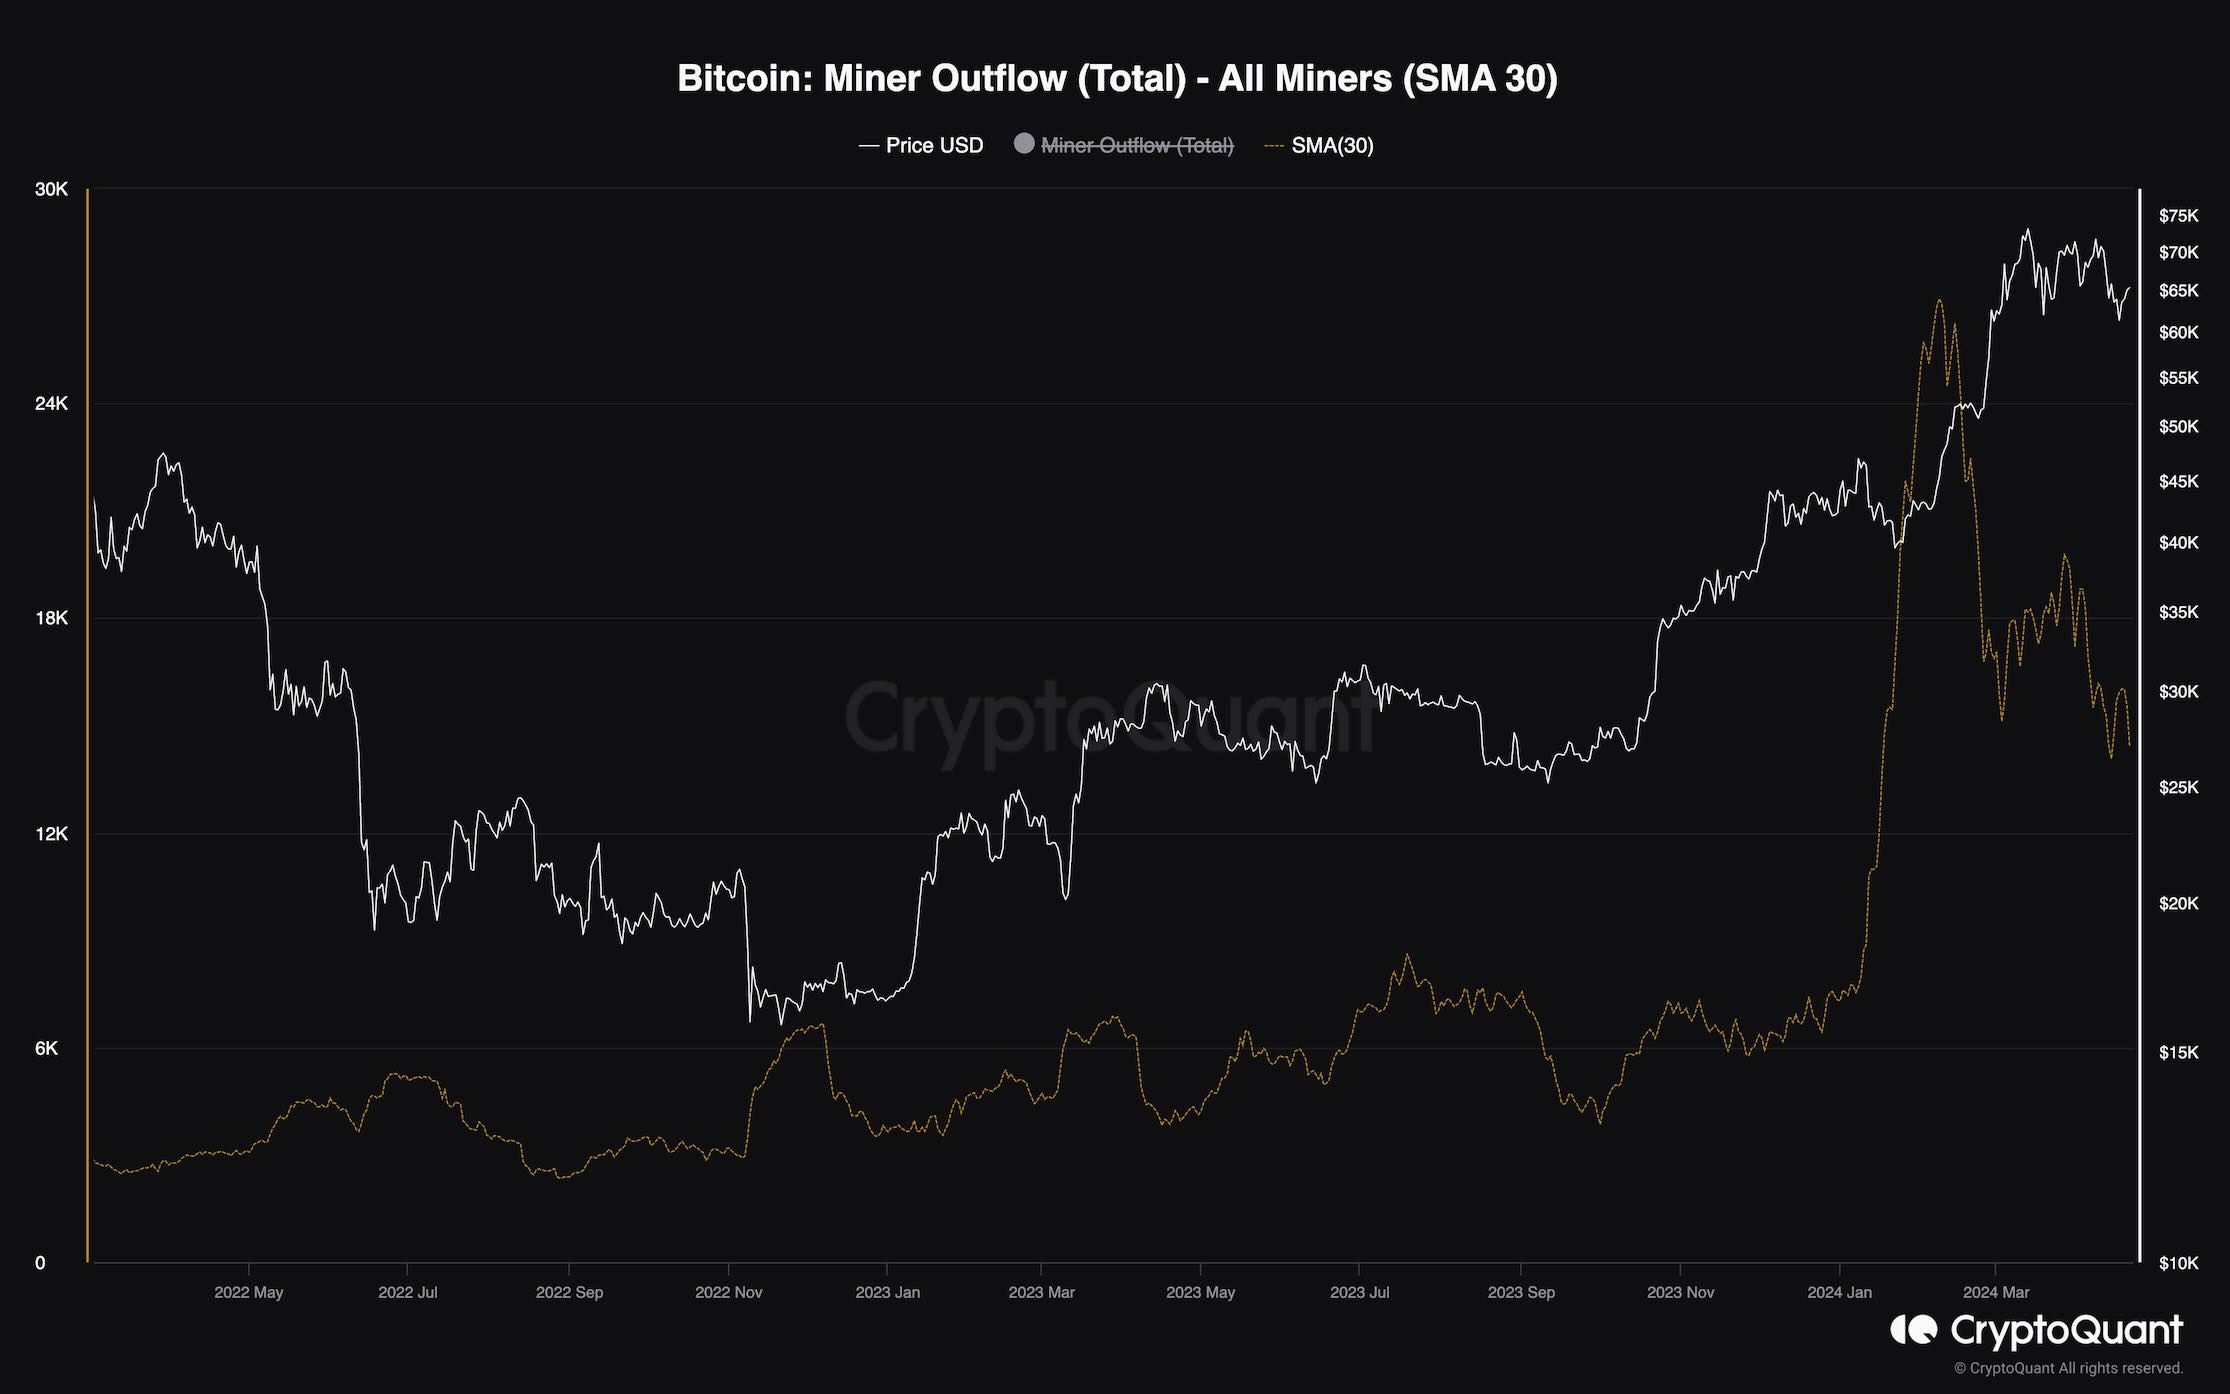
While Bitcoin’s price is showing some signs of recovery, market participants are wondering whether the bull market will continue. Some might even be searching for the reason why the price rally stopped at $75K. This chart can give some answers.
It shows the 30-day moving average of the Bitcoin miner outflow metric, which measures the number of transactions sent from Bitcoin miners’ wallets. Increases are typically associated with high selling pressure.
It is evident that the miner outflows rapidly surged in January and February. This selling pressure is definitely a contributing factor to the price’s correction. Yet, the metric is now dropping as the outflows from miner wallets are decreasing. If this trend continues, the market is likely to climb toward higher prices soon.
The post Is Bitcoin Ready to Rally Again or is Another Drop to $60K Coming? (BTC Price Analysis) appeared first on CryptoPotato.


