Is Bitcoin About to Plummet Below $37K? (BTC Price Analysis)
Technical Analysis
By Shayan
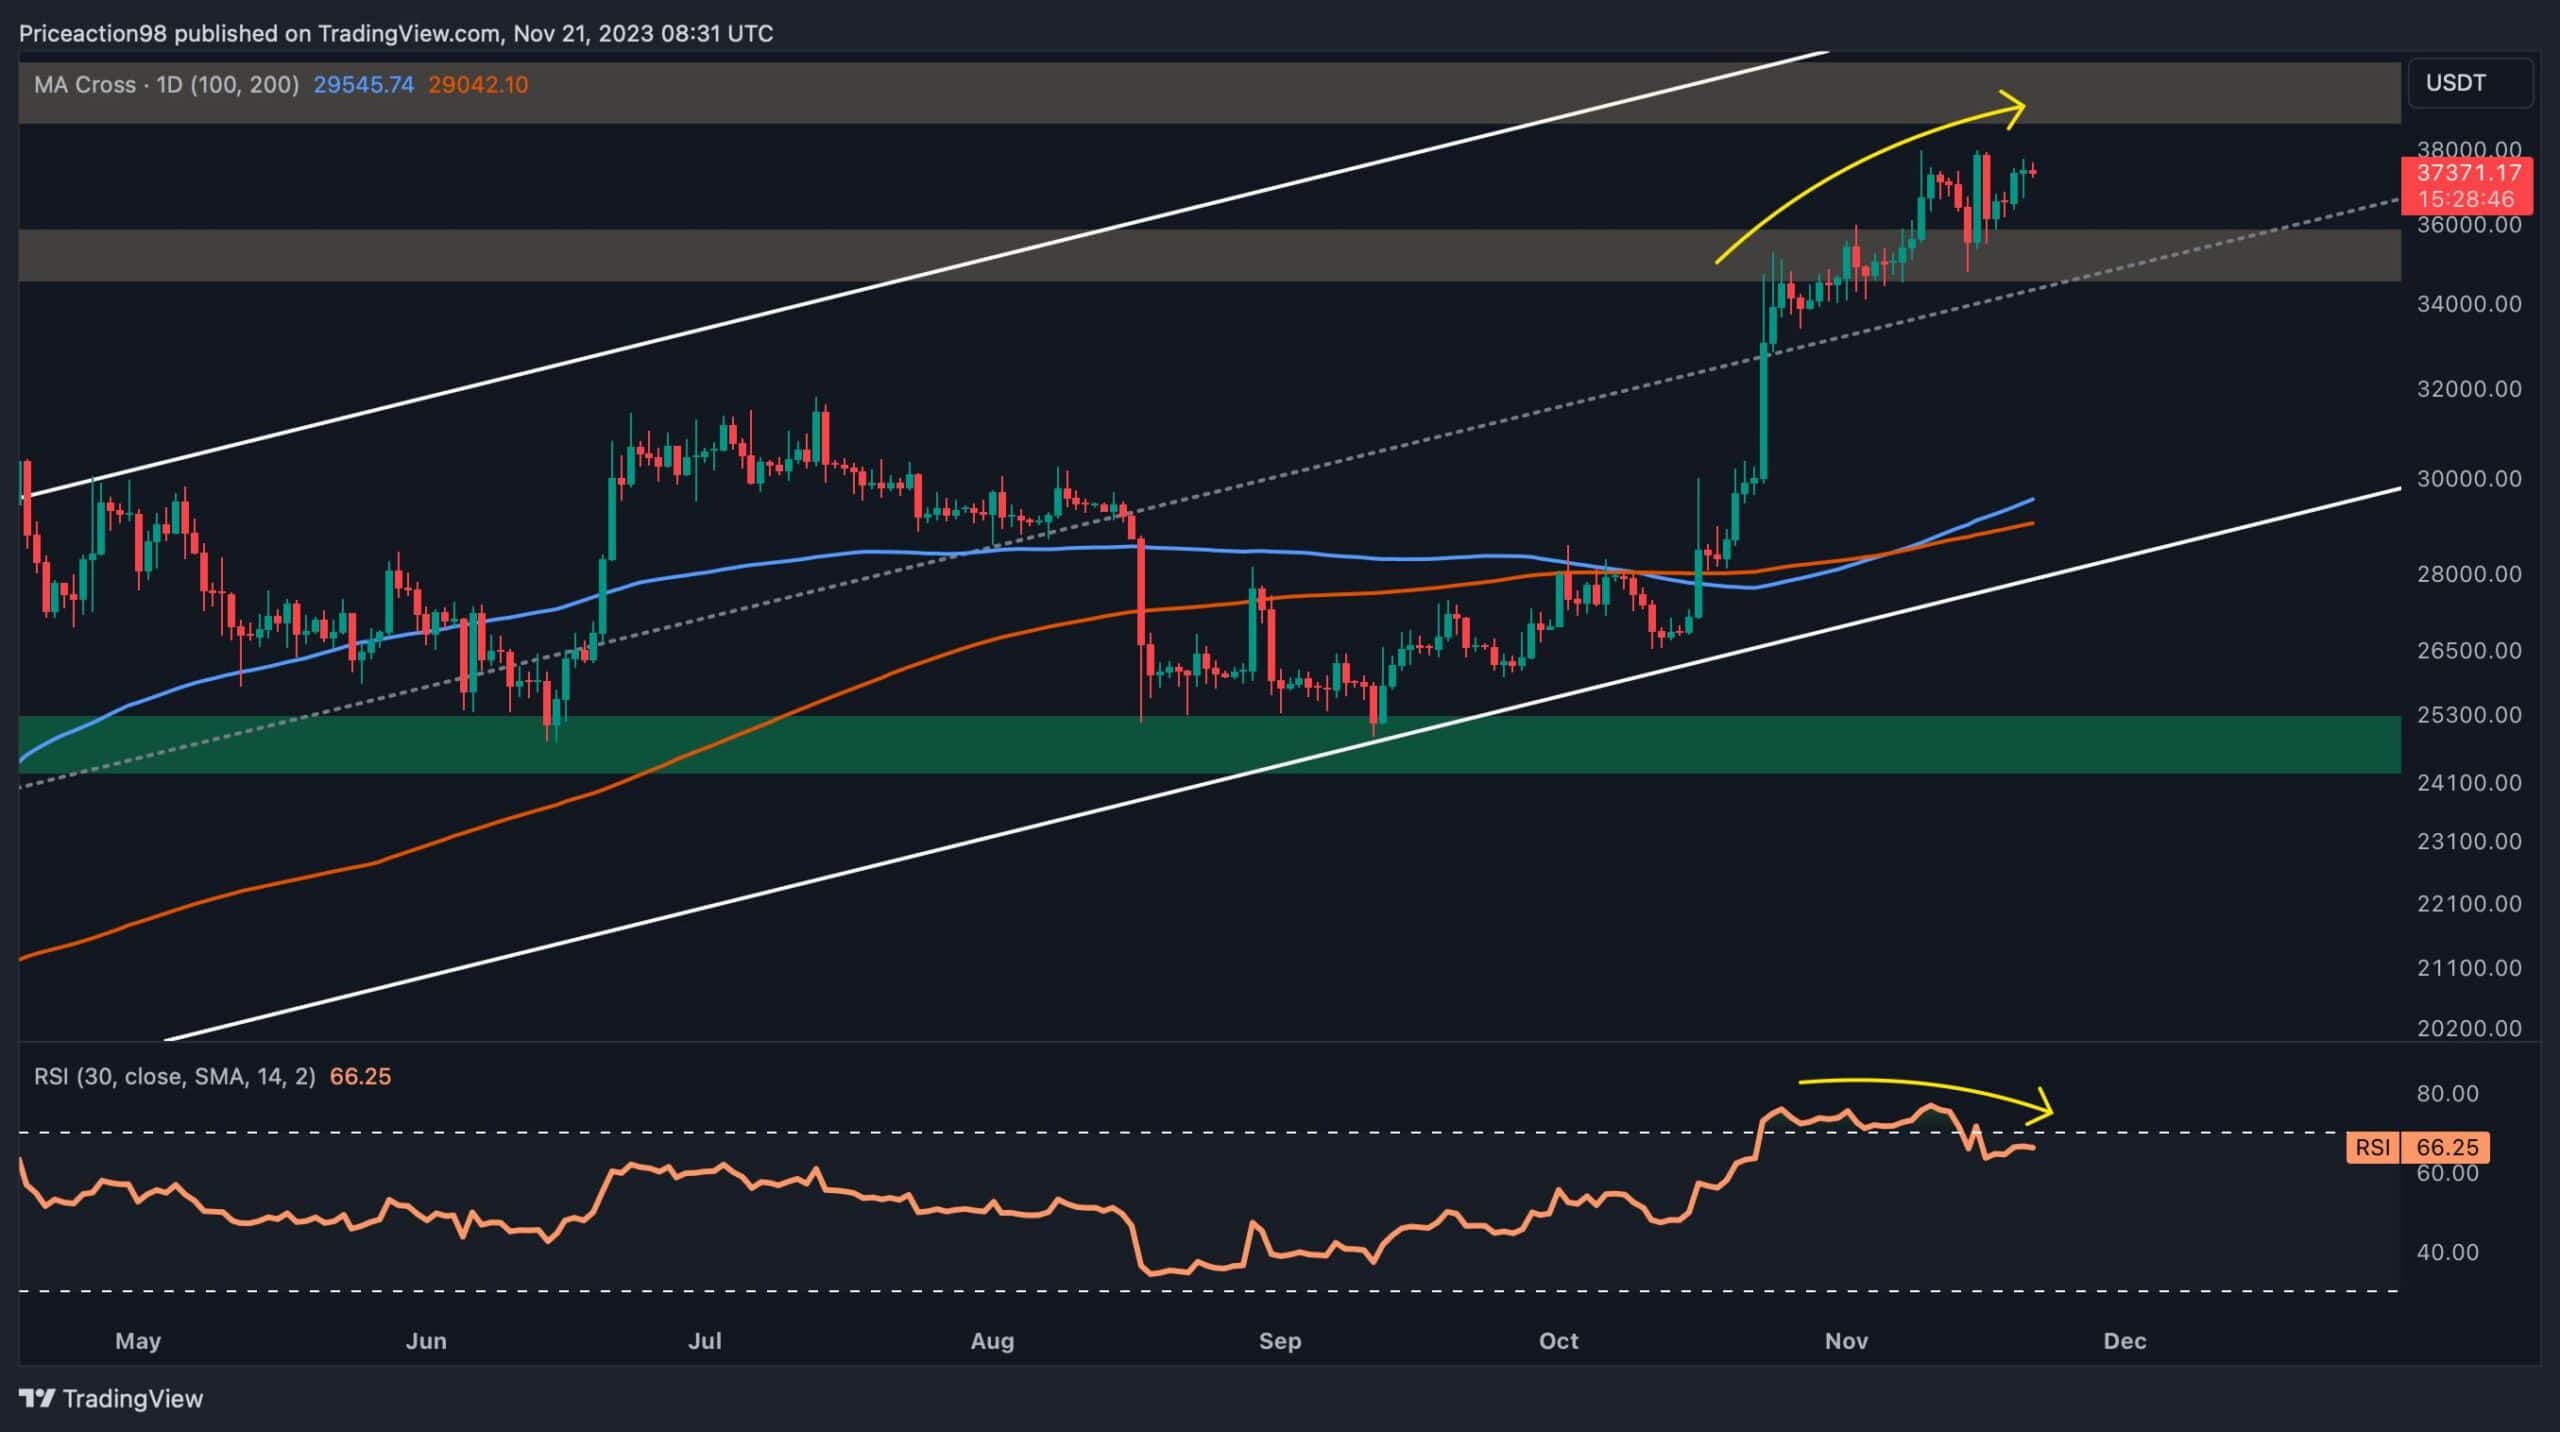
Bitcoin’s recent upward momentum has encountered resistance around the $38K mark, primarily due to prevailing selling pressure within this critical price range.
Despite this setback, there are indications in the price action that suggest a potential short-term reversal, with ongoing retracements pointing towards the $35K threshold.
The Daily Chart
A closer look at the daily chart reveals that after an attempt by buyers to reclaim the pivotal resistance zone of $38K, the price faced rejection. This led to a consolidation phase within this crucial range, accompanied by mild volatility and subdued price movements. The presence of sellers in this range has impeded further upward movements, creating a significant range bounded by the $35K support and the $38K resistance.
On the other hand, an extended bearish divergence between the price and the RSI indicator signals the possibility of a short-term decline, indicating weakened bullish momentum in the market.
Despite this, given the current market conditions, a more likely scenario is a short-term consolidation correction with minor retracements. Initial support for buyers is expected at the mid-boundary of the ascending channel and the $35K support zone.

The 4-Hour Chart
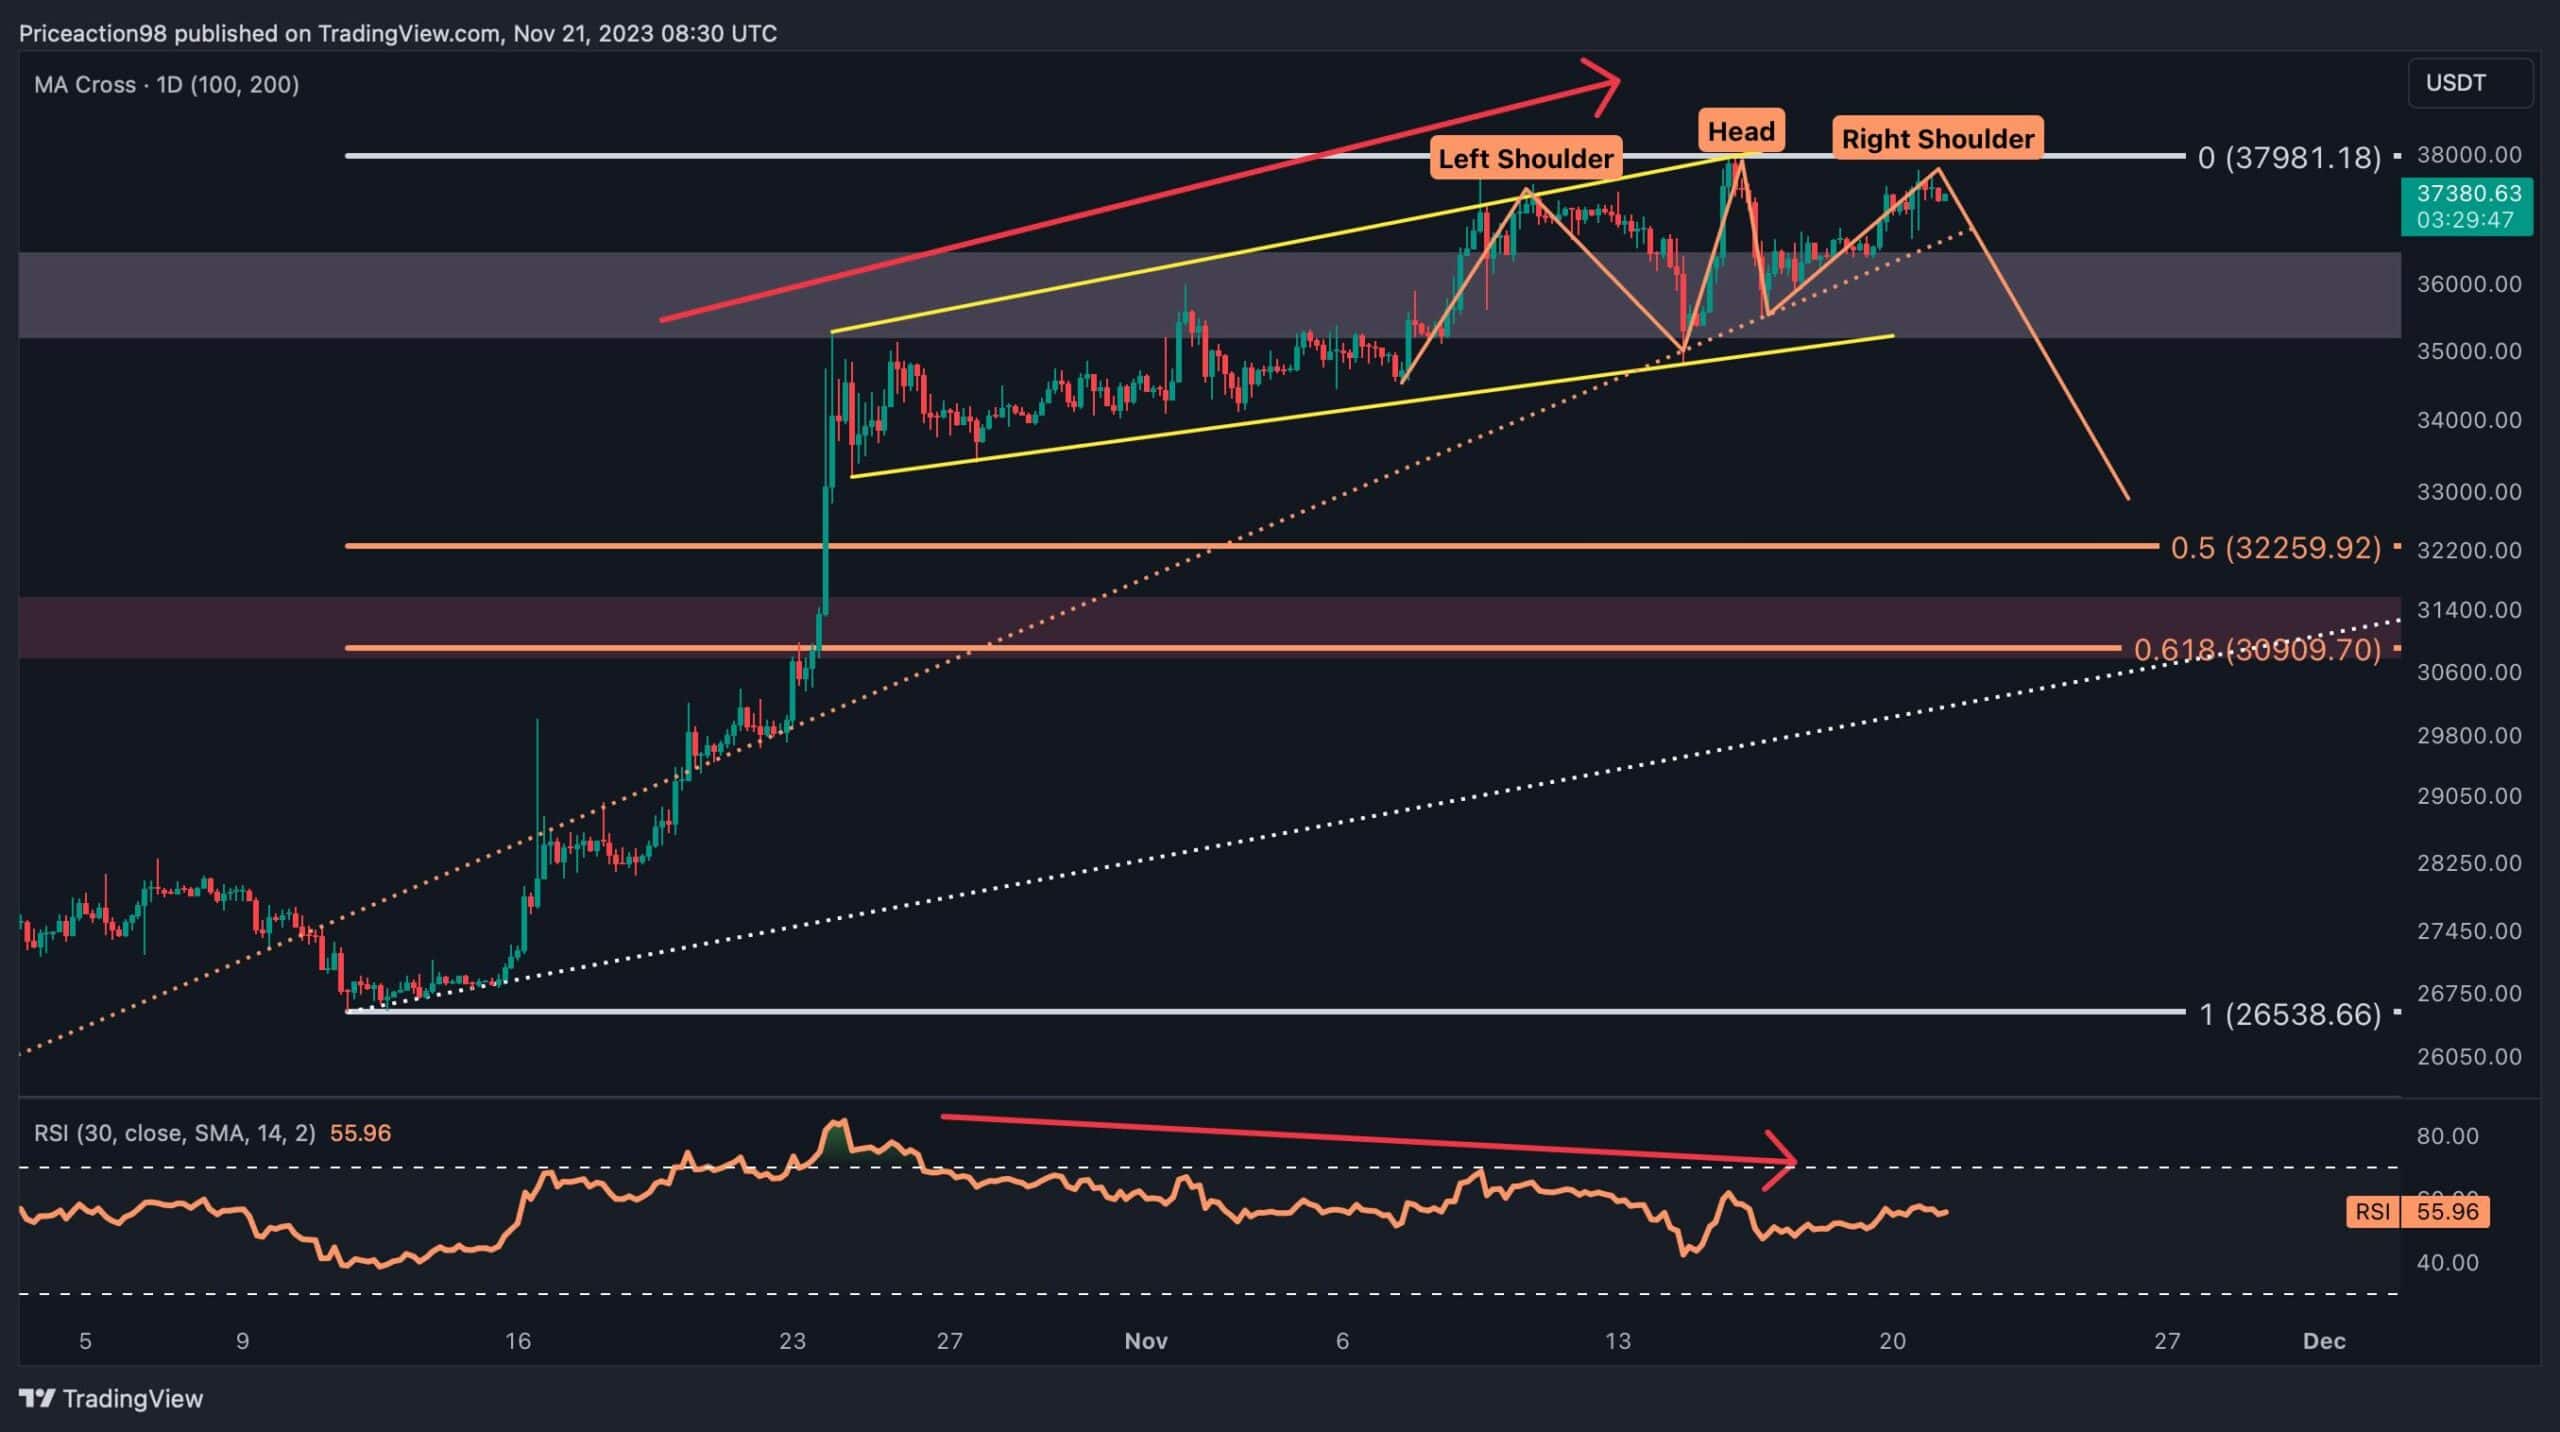
Turning to the 4-hour chart, it becomes evident that the price entered a consolidation phase upon reaching the critical resistance level of $38K, where supply appears to surpass existing demand. Within this consolidation, Bitcoin formed an ascending wedge pattern, a widely recognized bearish reversal pattern suggesting a potential downturn in the market.
Simultaneously, a head and shoulders pattern has recently materialized, clearly visible on the chart, and is on the brink of completing the right shoulder. This pattern acts as a crucial signal, indicating a potential bearish reversal only if the price breaches the pattern’s neckline.
The presence of the head and shoulders pattern, coupled with an expanded bearish divergence between the price and the RSI indicator, implies a need for a short-term retracement. Should sellers take control, there is a possibility of a long squeeze event, pushing the price below the established ascending wedge pattern. Key support levels in such a scenario include the 0.5 Fibonacci retracement level at $32,300.

On-chain Analysis
By Shayan
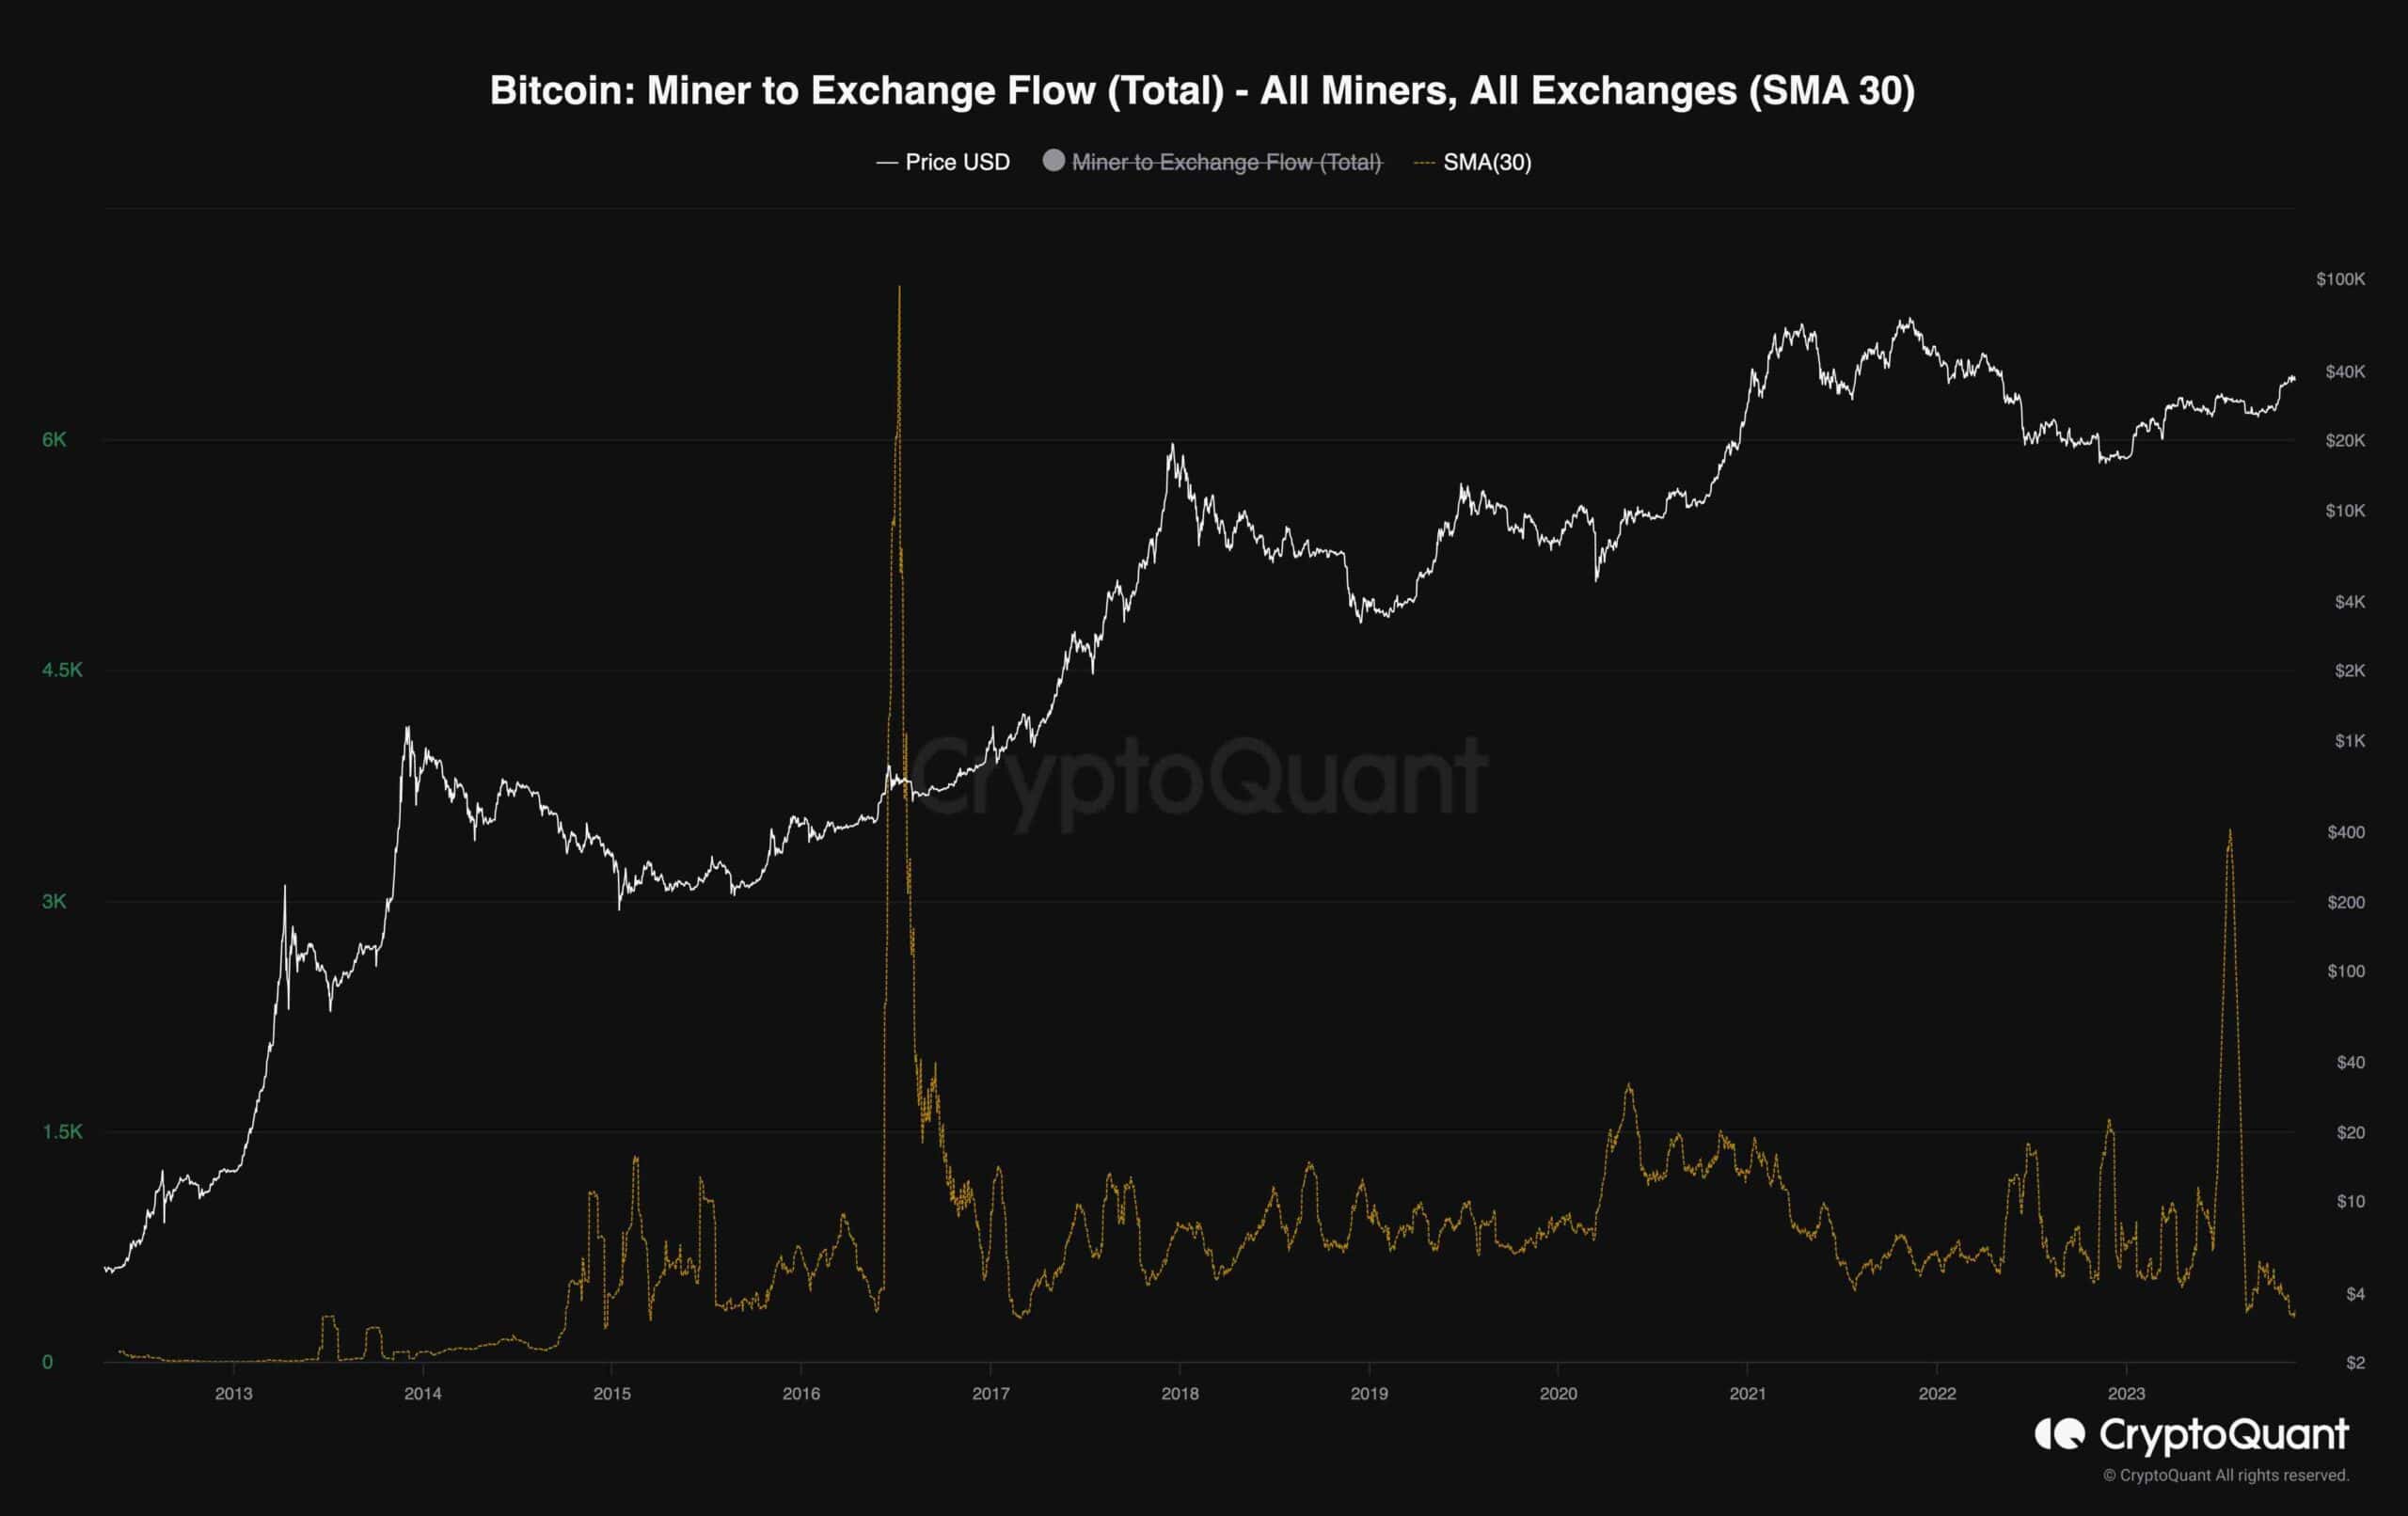
The movement of Bitcoin from miner wallets to exchange wallets provides insights into the activities of these entities in the open market. The transfer of coins to exchanges enhances the liquidity of BTC on these platforms, introducing additional selling pressure. It’s crucial to note that miners are consistently involved in selling, as this is how newly mined BTCs enter the market.
The chart illustrates the 14-day moving average applied to the Miner to Exchange Flow metric, offering a gauge for the volume of coins moving from miners to exchanges. This metric serves as an indicator of potential selling pressures originating from miners and is correlated with fluctuations in Bitcoin’s market price.
Presently, the flow of BTC from miners to exchanges has reached its lowest level since 2017, with a monthly average of 90 BTC sent. Interestingly, this decline in miner activity has coincided with a substantial price surge, pushing Bitcoin’s valuation above the $38K mark. This trend suggests that miners may be accumulating Bitcoin, providing a potential signal for bullish market sentiment.

The post Is Bitcoin About to Plummet Below $37K? (BTC Price Analysis) appeared first on CryptoPotato.


