Is Bitcoin About to Correct or is $75K Imminent? (BTC Price Analysis)
Bitcoin’s price has been climbing steadily since breaking its previous record. This has made market participants wonder how much further Bitcoin is likely to rally before experiencing a correction.
Technical Analysis
By TradingRage
The Daily Chart
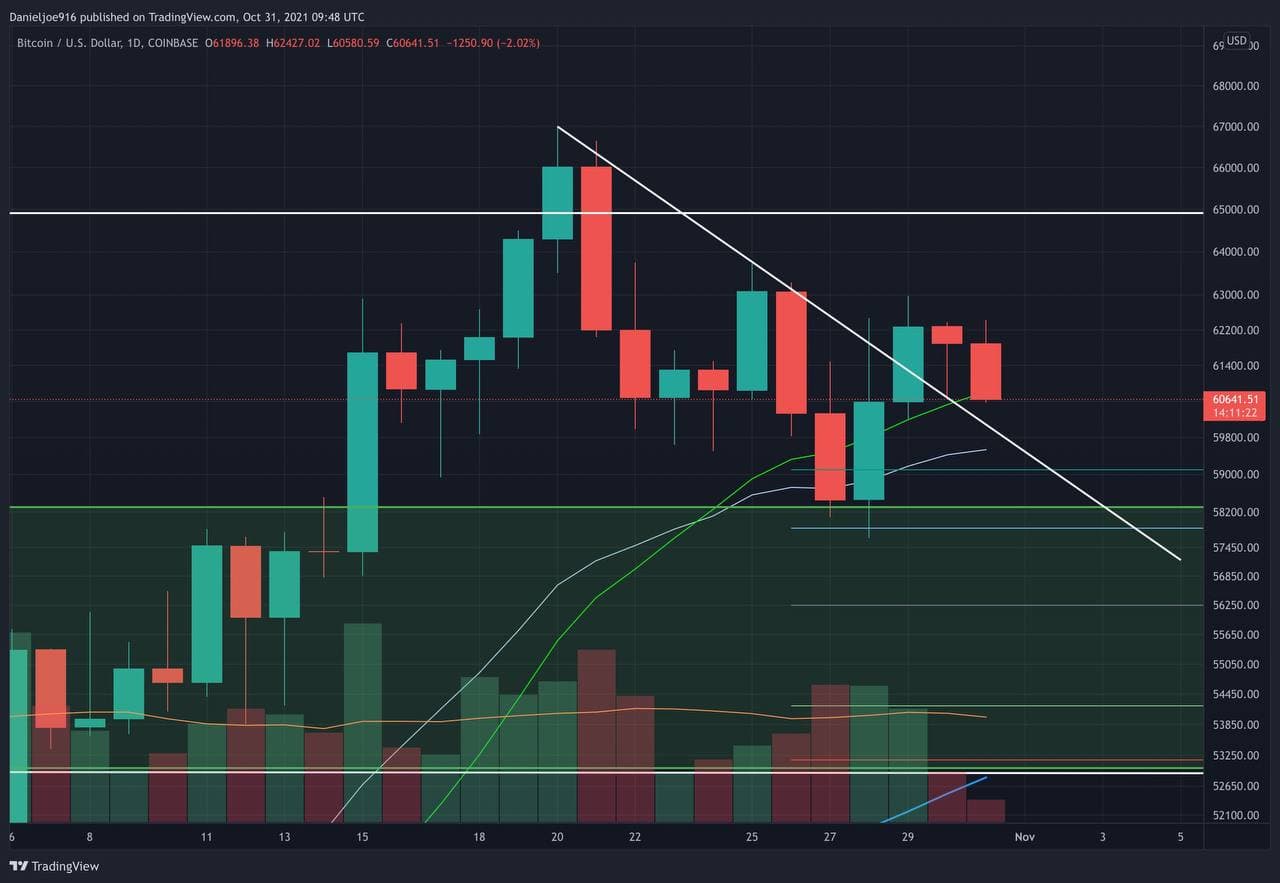
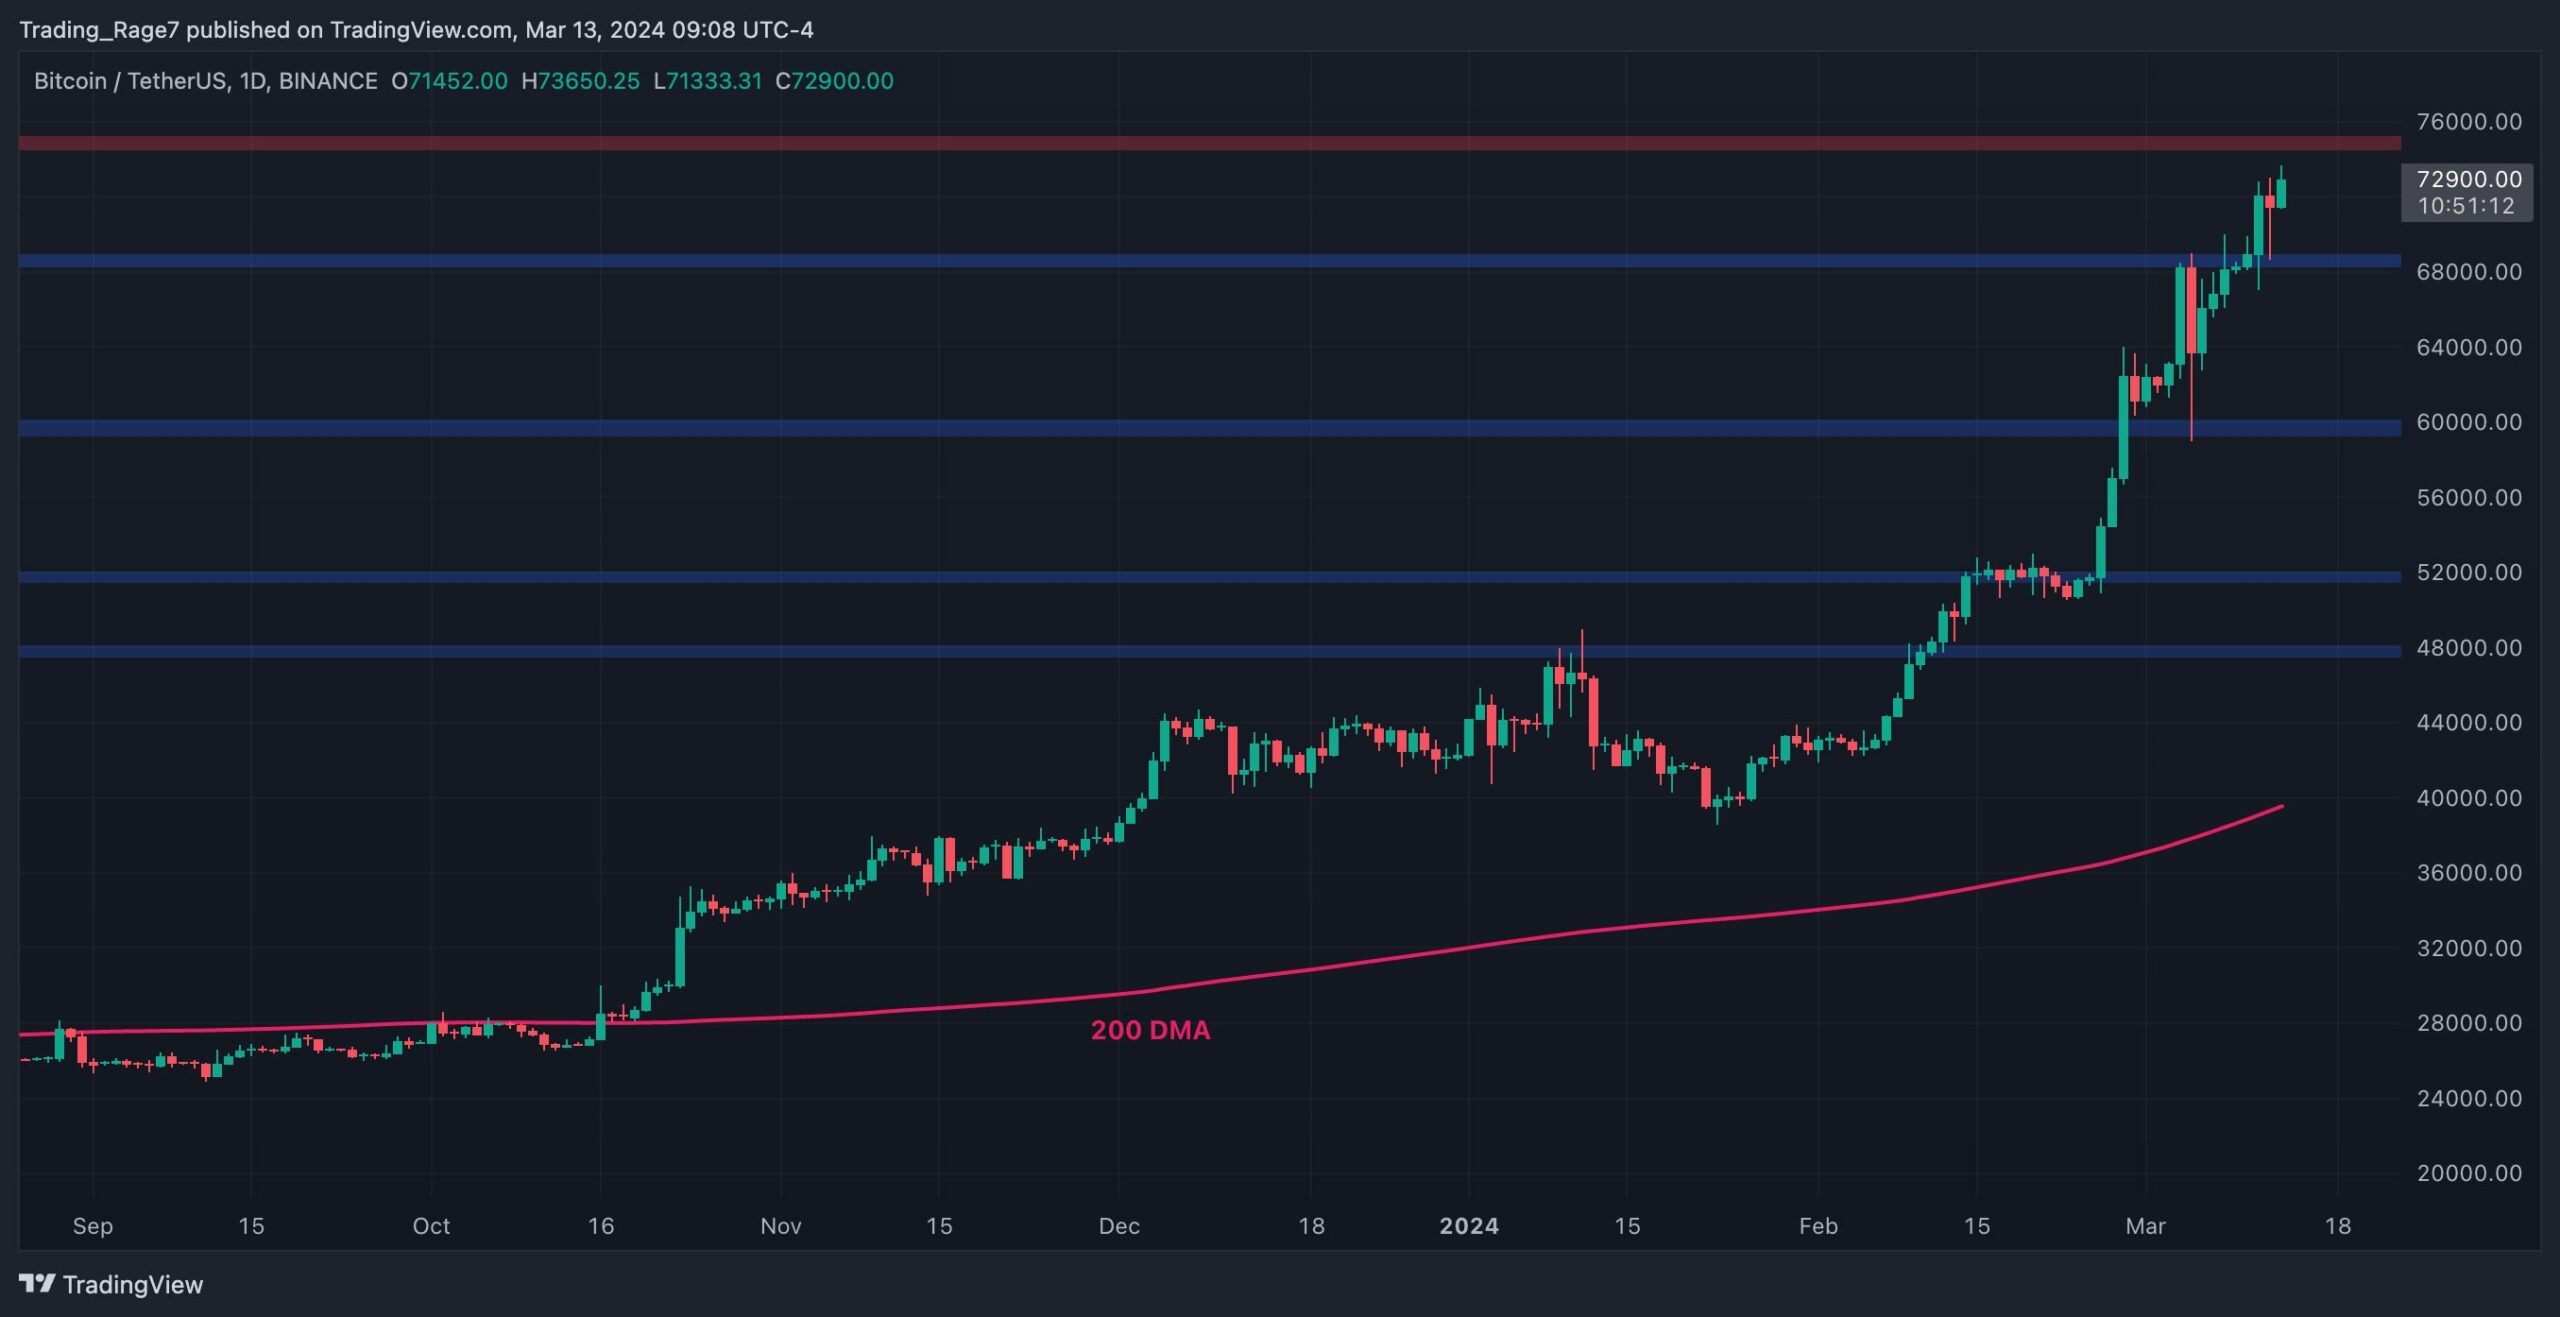
On the daily chart, the BTC price has recently broken past the previous all-time high of $69K. Bitcoin is currently being traded above $70K for the first time since its creation.
A likely short-term target for the crypto market leader is the psychological resistance level of $75K.
Reaching this zone will probably result in a short-term pullback that could lead to a retest of the $69K zone. With the price trading far from the 200-day moving average, located around the $40K level, it could be a matter of time before Bitcoin enters a correction or consolidation phase.
The 4-Hour Chart
The 4-hour timeframe shows that since the price has rebounded from the $60K support level, it has been consistently making higher highs and lows.
The market has already retested the $69K level once and bounced back up quickly.
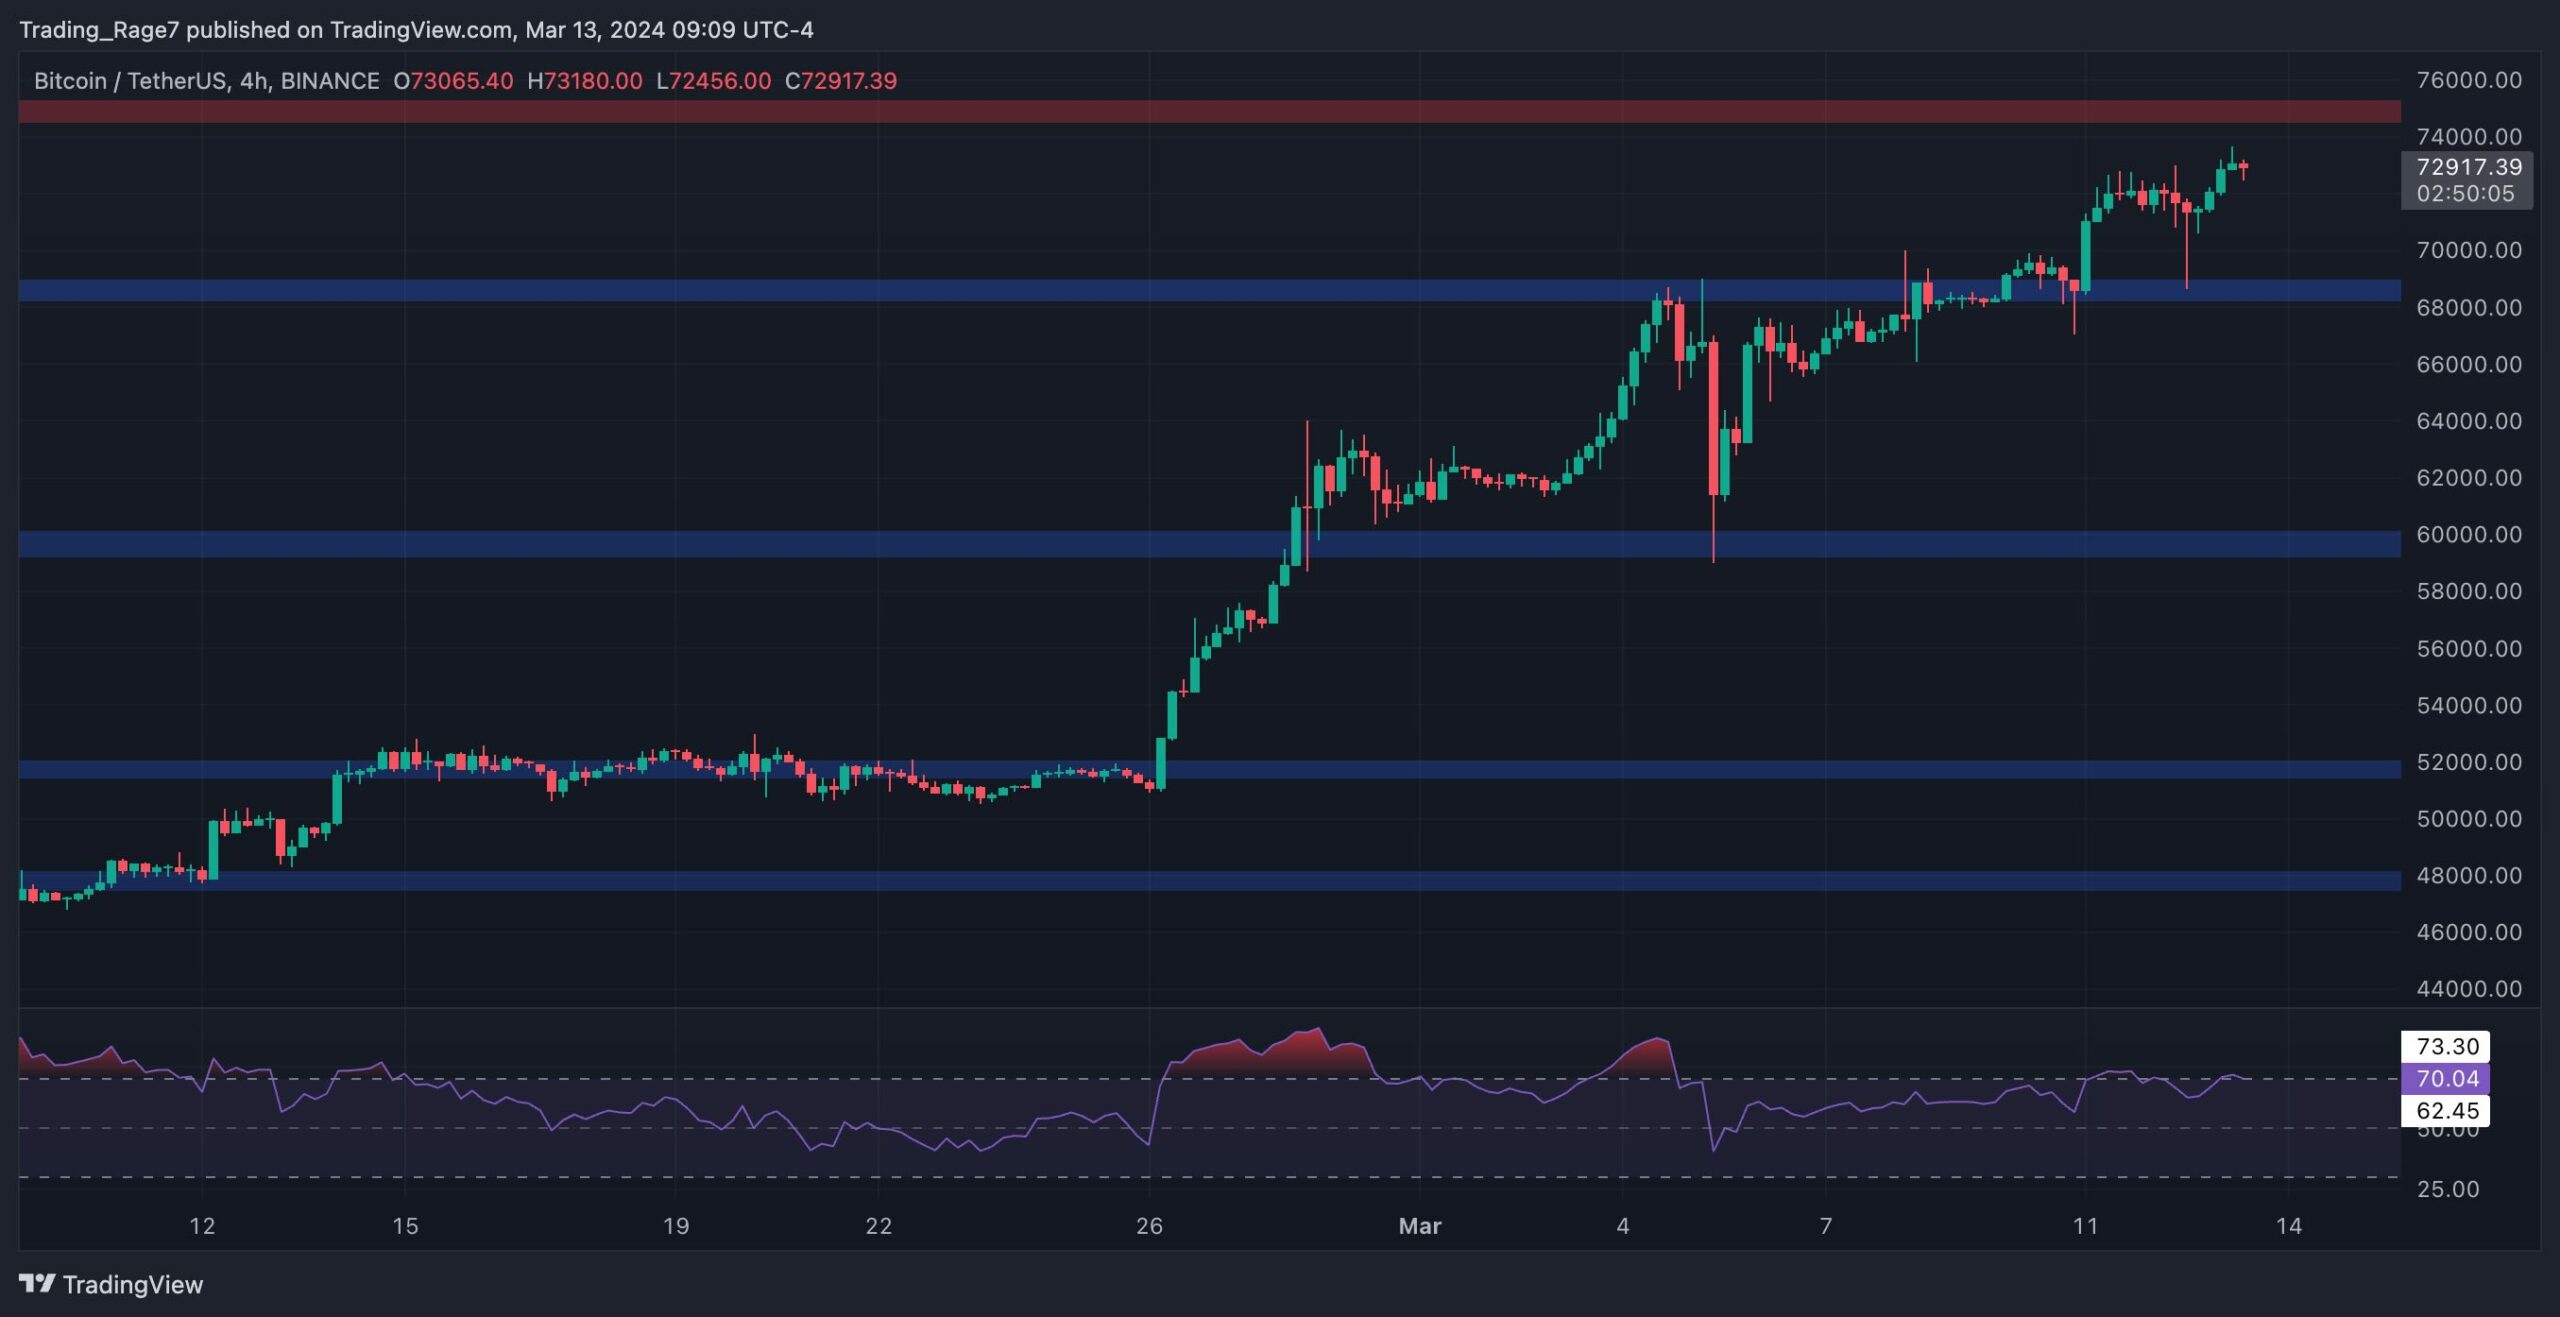
As the Relative Strength Index indicates, the momentum is still very bullish, and the market will likely reach the $75K level soon. Yet, if the oscillator shows an overbought signal or a bearish divergence, a short-term correction would be likely before a rally higher.
On-Chain Analysis
By TradingRage
Bitcoin Miners Position Index
With Bitcoin’s price trading at all-time highs and approaching the $75K level, many market participants might be tempted to realize some profits. Miners are the most vital cohort in the Bitcoin network, so analyzing whether they are offloading their coins at a significant rate can offer valuable clues.
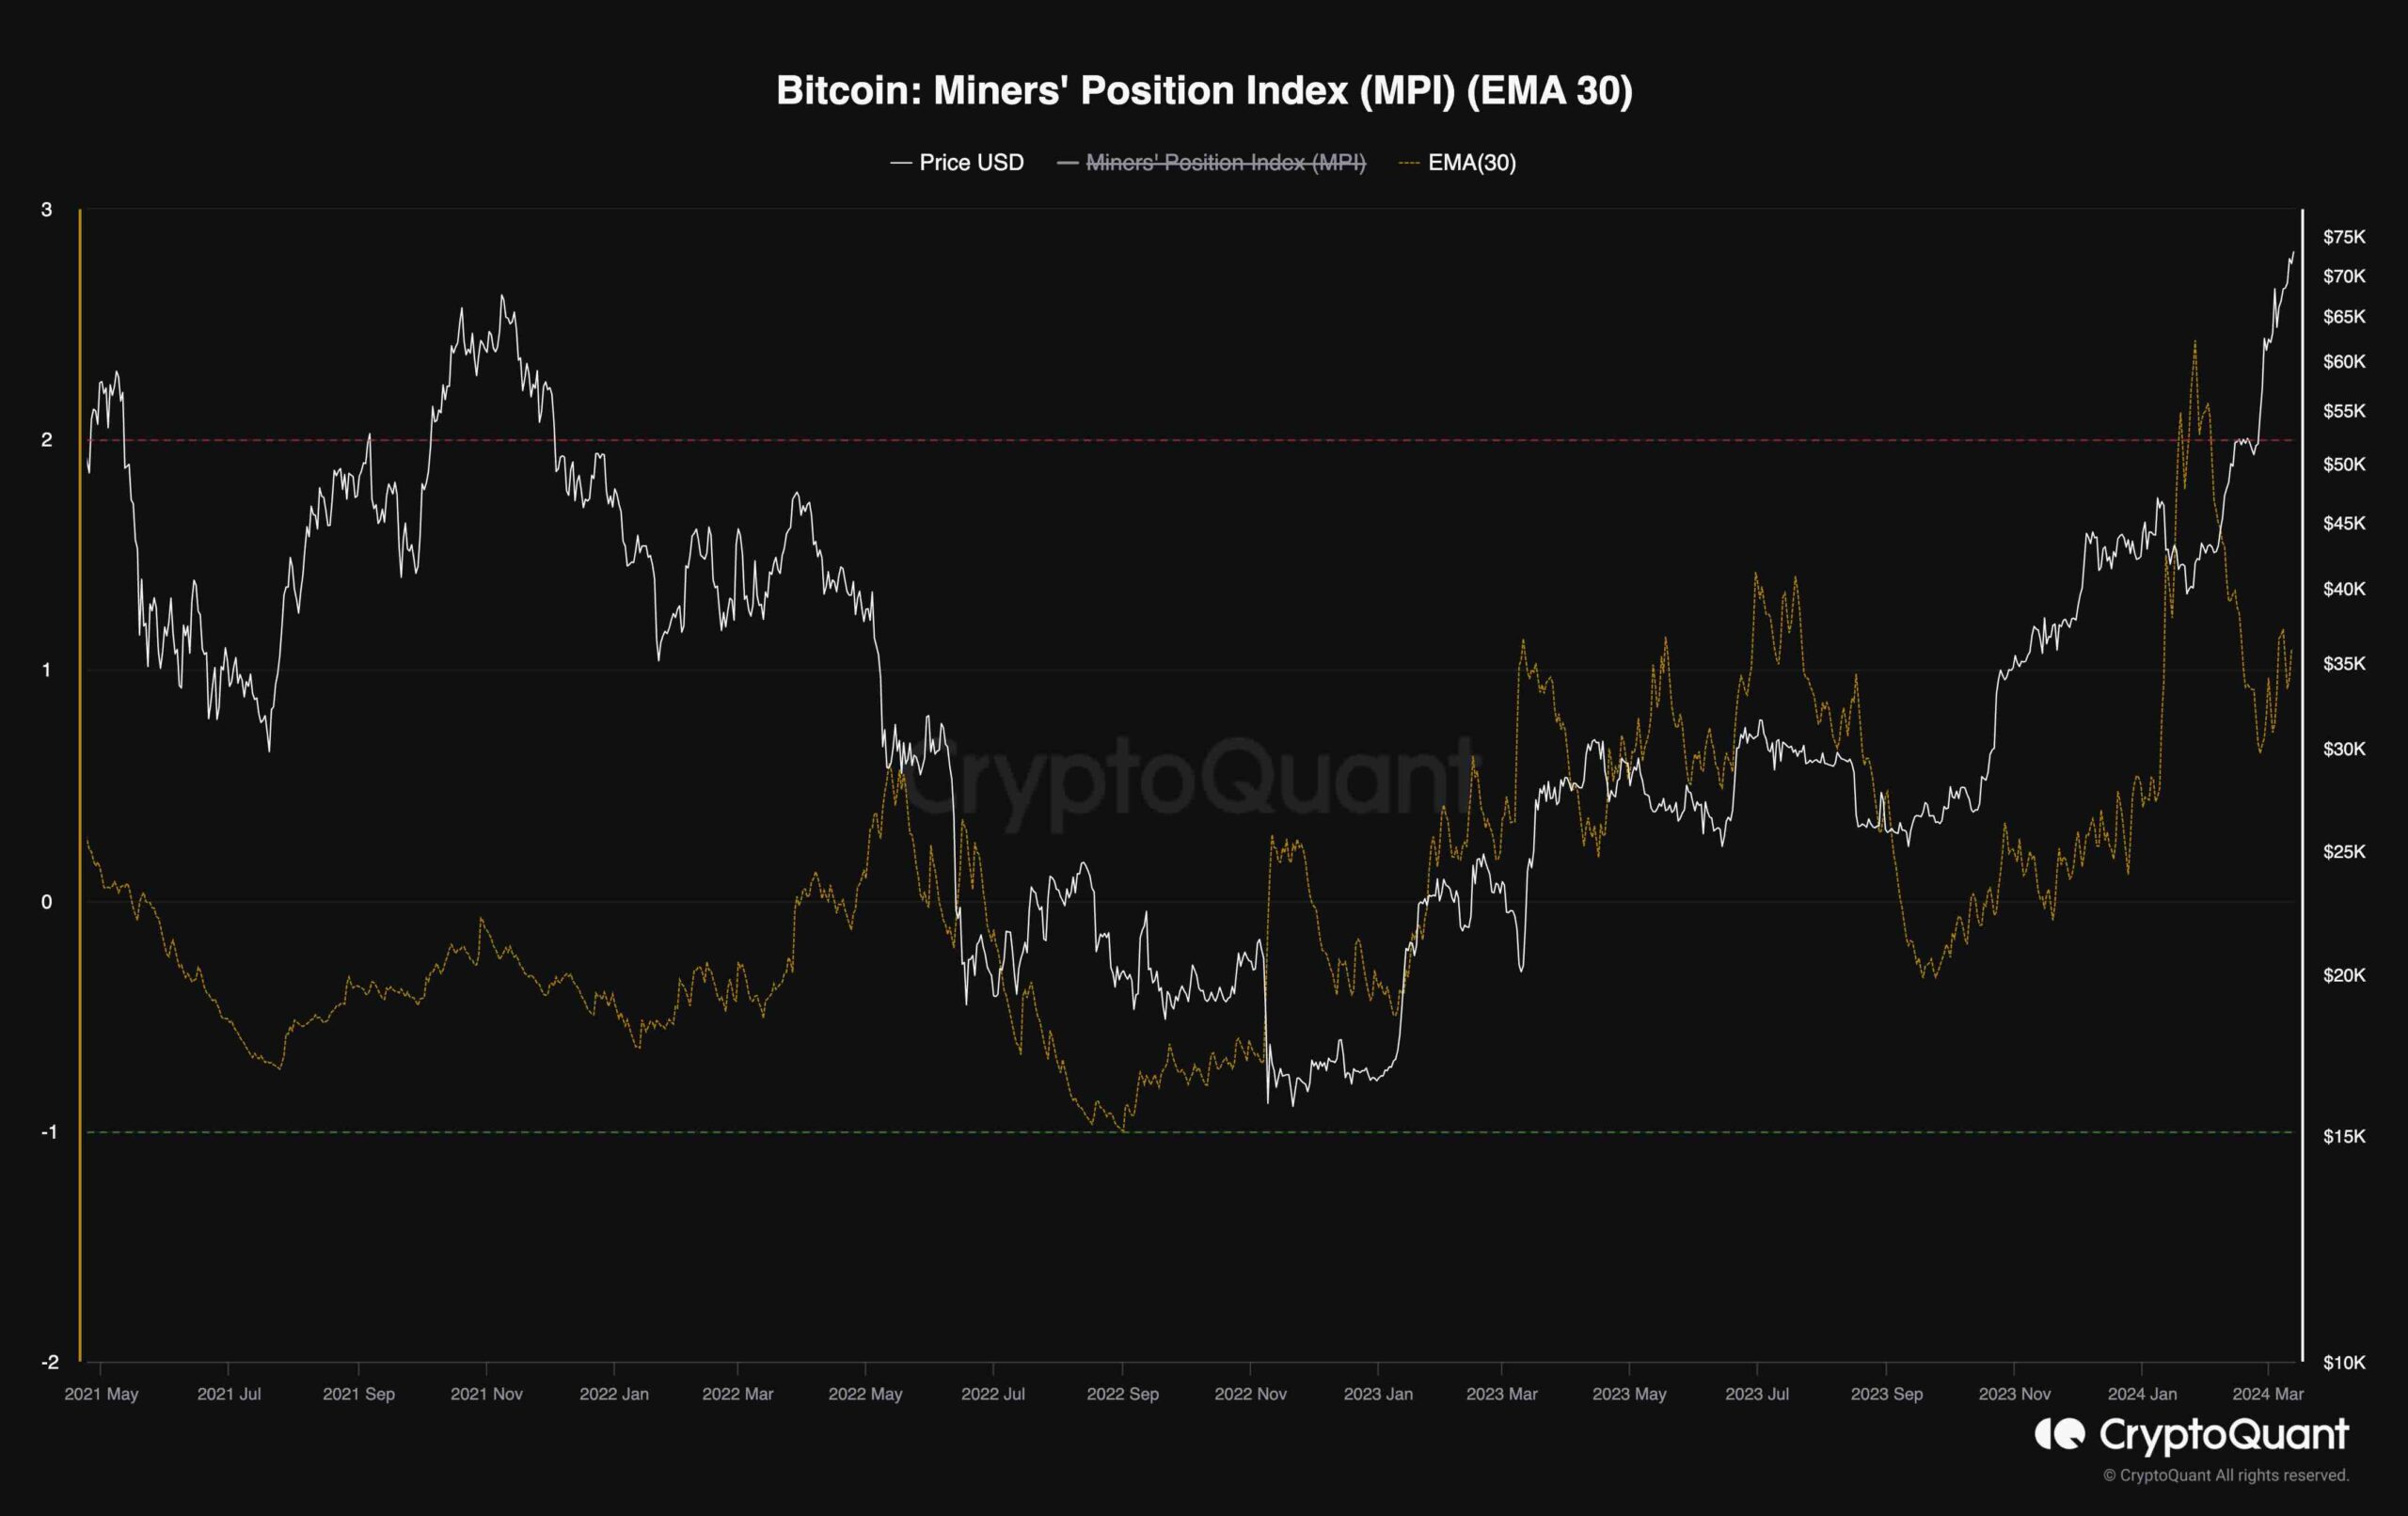
This chart demonstrated the Miners Position Index (MPI). This metric is designed to signal considerable selling behavior from the miners. Values above 2 typically indicate unusual selling pressure from the miners.
As the chart displays, the MPI recently showed values above 2 when BTC was trading around $40K. Yet, this is no longer the case, as the selling pressure has seemingly cooled down to usual levels.
This indicates that miners are no longer selling in huge chunks and only realizing profits to cover operational expenses. Therefore, their current behavior is not showing any worrying signs, and with their supply shrinking, Bitcoin can rise to higher prices in the coming months.
The post Is Bitcoin About to Correct or is $75K Imminent? (BTC Price Analysis) appeared first on CryptoPotato.