Is a New All-Time High on the Table if BTC Breaks Toward $70K? (Bitcoin Price Analysis)
Bitcoin’s price is showing signs of recovery following a couple of months of correction. The big question now is whether it’s time for a new all-time high or if that’s just a fake breakout.
Bitcoin Price Analysis: Technicals
By TradingRage
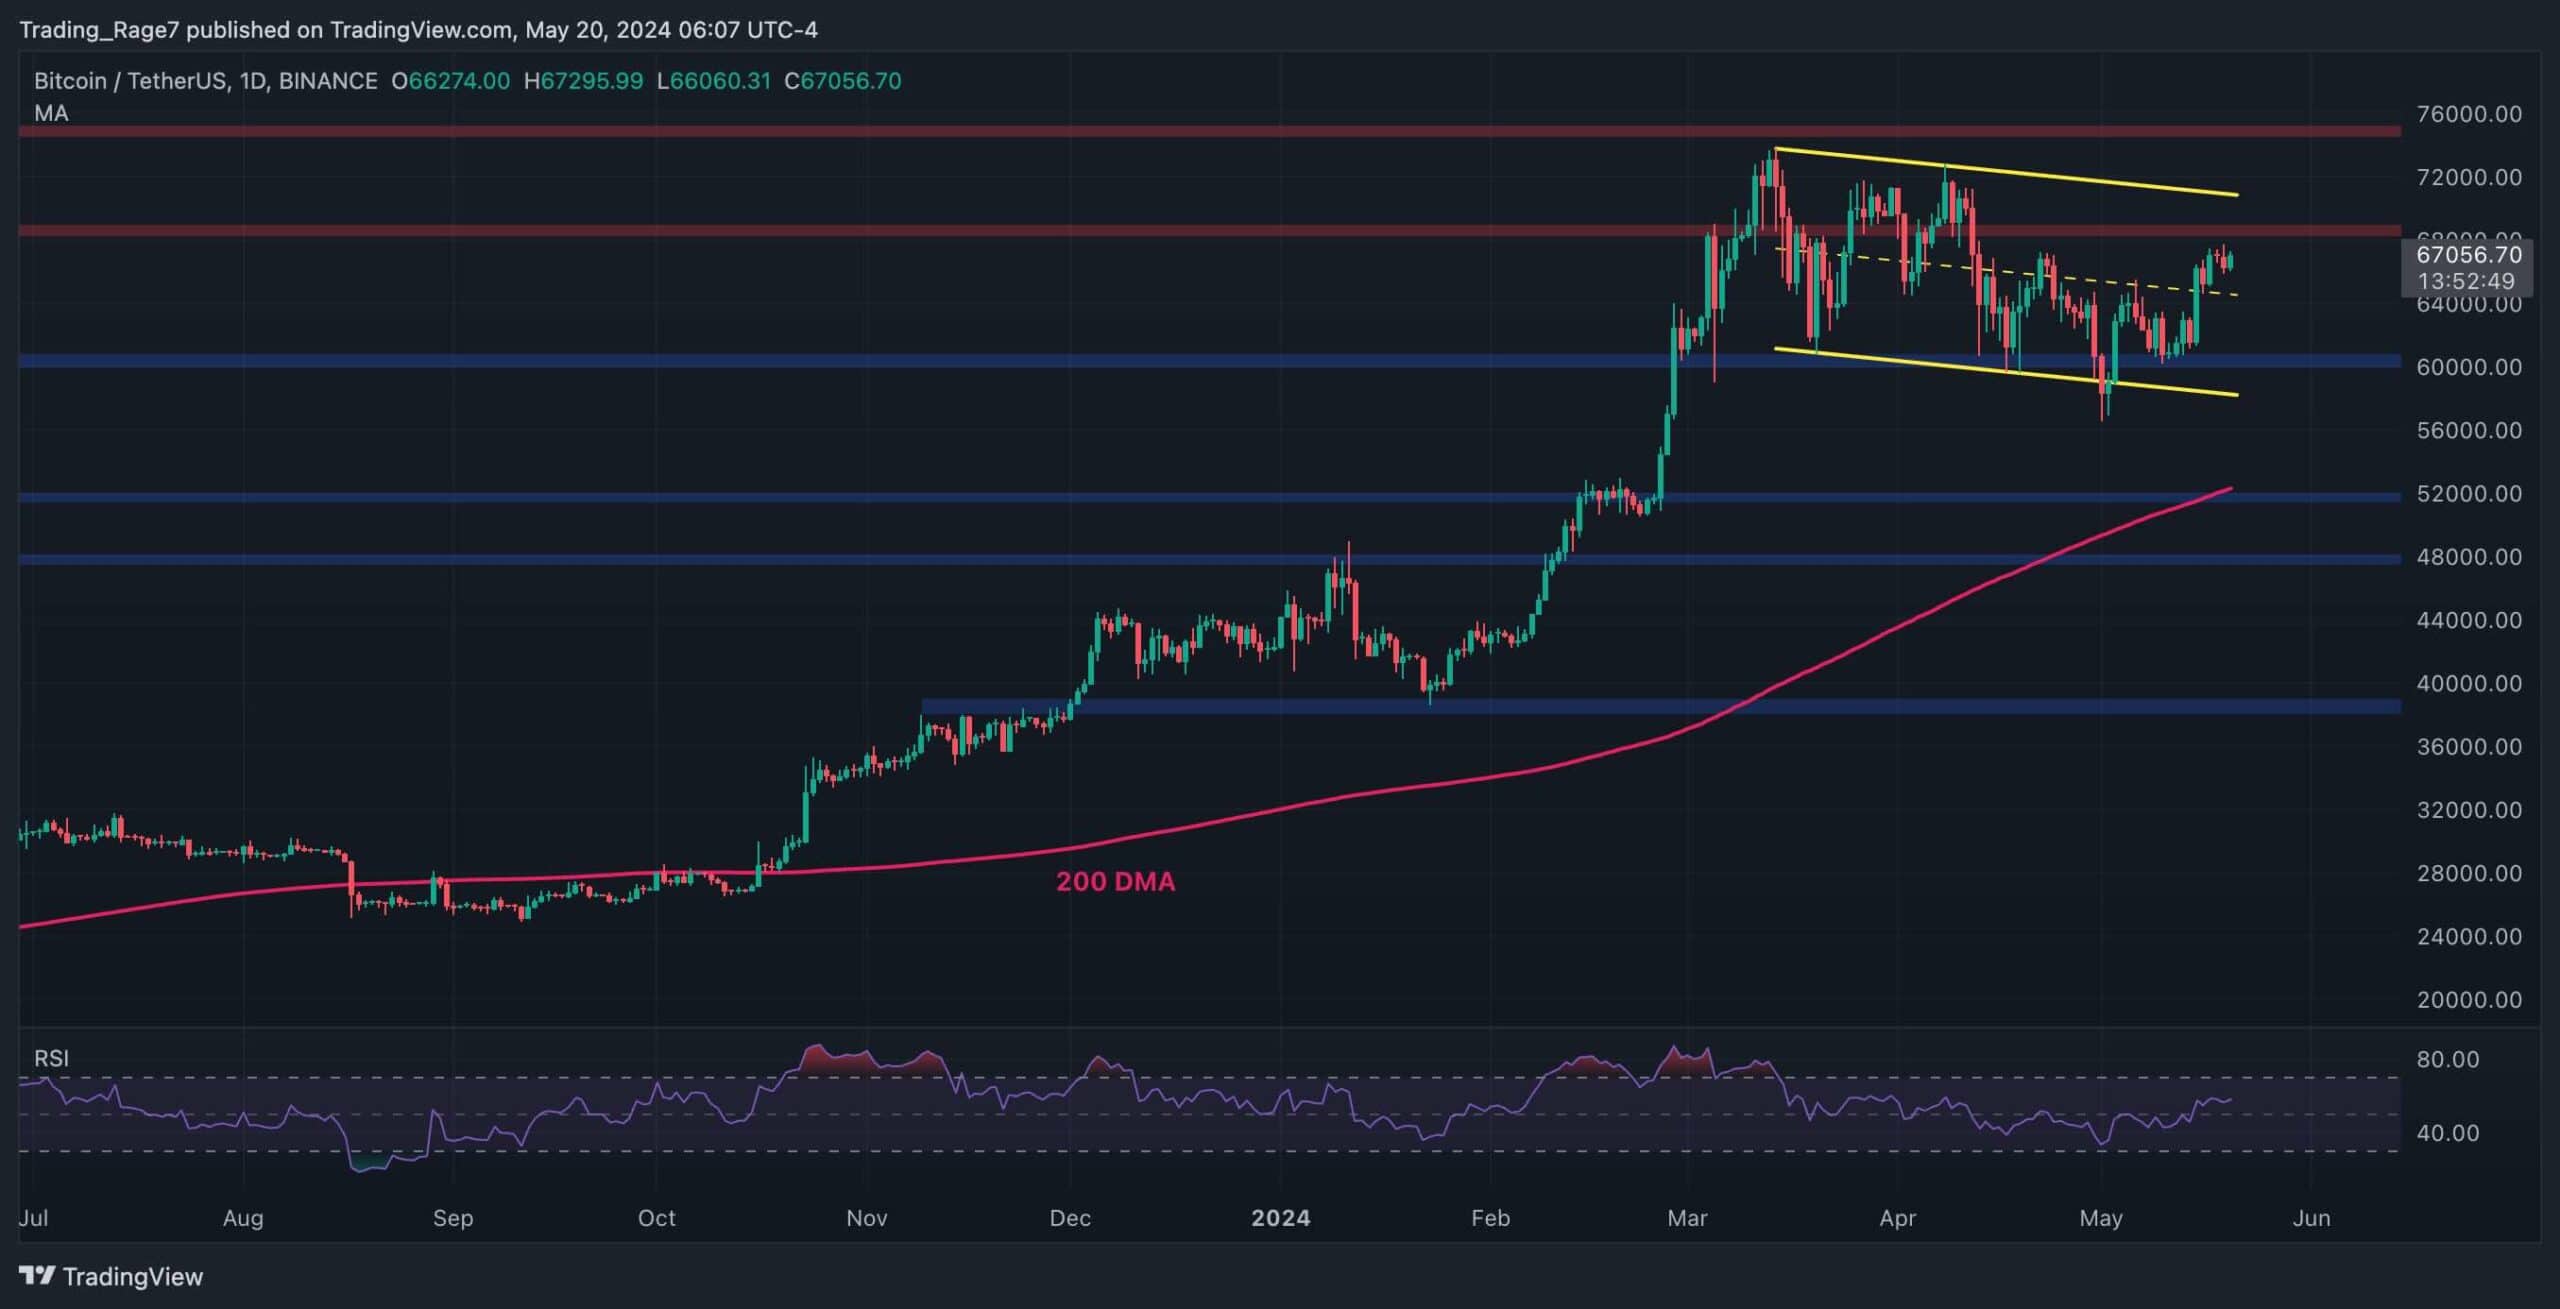
The Daily Chart
Against USDT, the Bitcoin price has been trapped inside a descending channel pattern. With the recent rebound from the $60K level and the lower boundary of the channel, the cryptocurrency has broken above the midline of the pattern.
The $68K resistance level is the next obstacle before the channel’s higher boundary. If the price breaks it to the upside, a new all-time high would be imminent, and a new Bitcoin rally would likely begin.
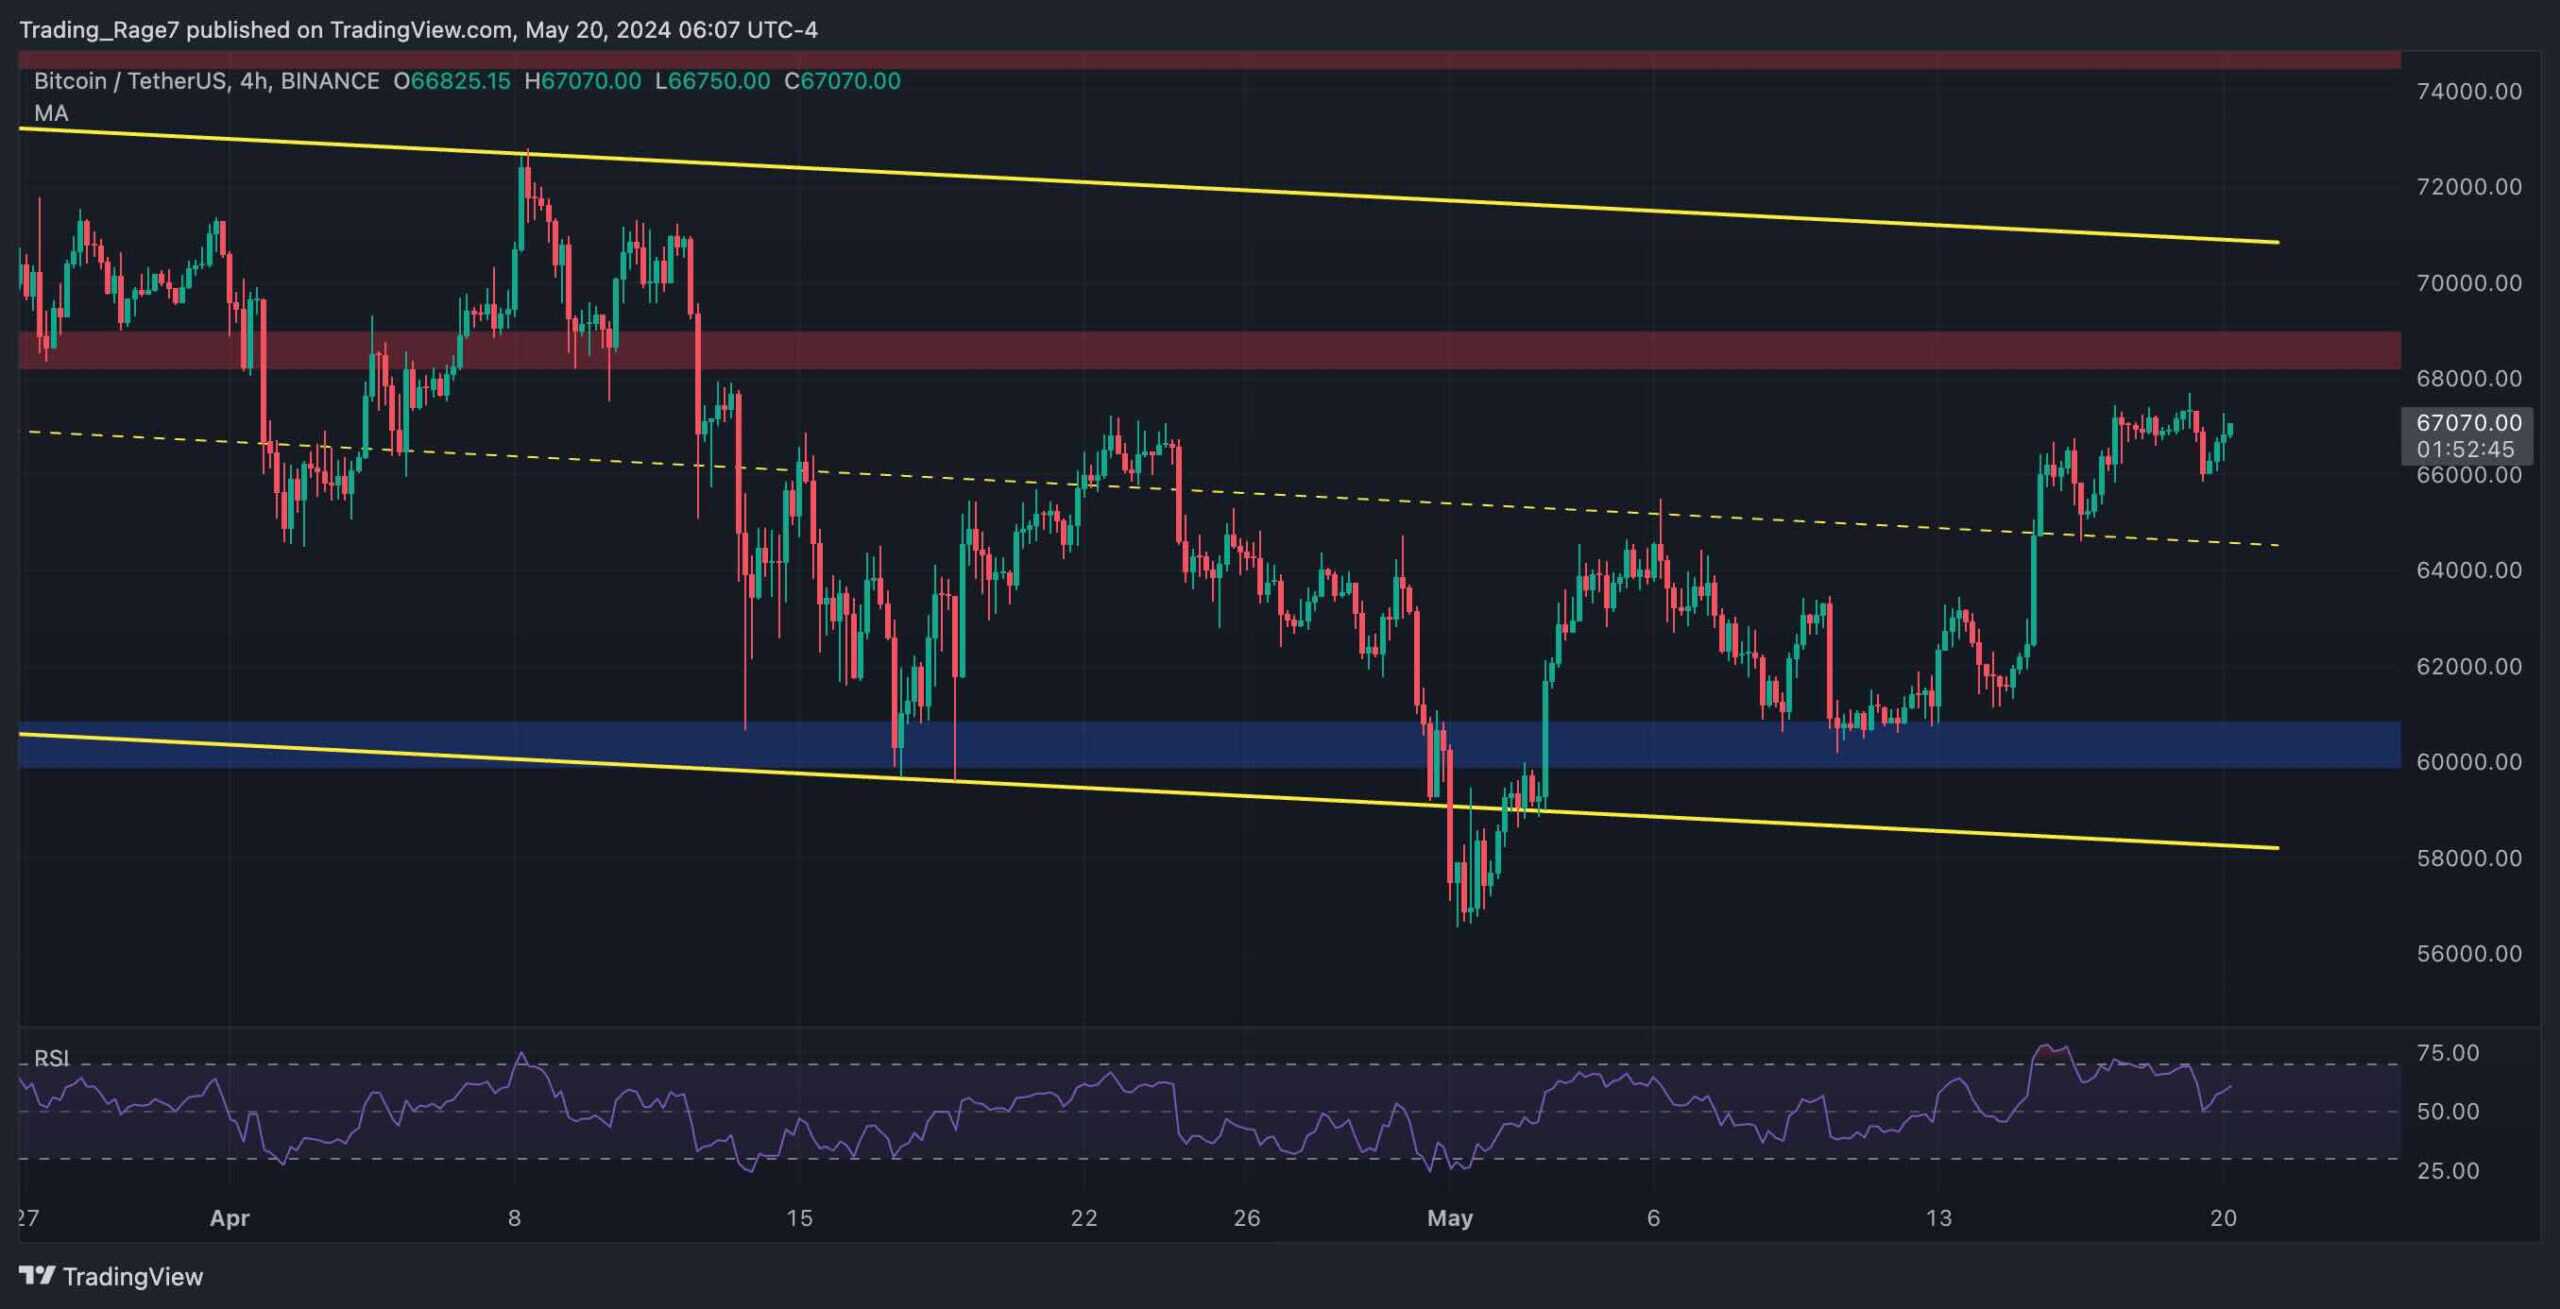
The 4-Hour Chart
Looking at the 4-hour chart, it is evident that the $60K support level has held the price several times, preventing a deeper correction. The cryptocurrency has been rallying since, breaking above the midline of the channel and completing a pullback.
The market is gradually approaching the $68K resistance level. With the Relative Strength Index showing values above 50%, a breakout above this level seems probable in the short term.
On-Chain Analysis
By TradingRage
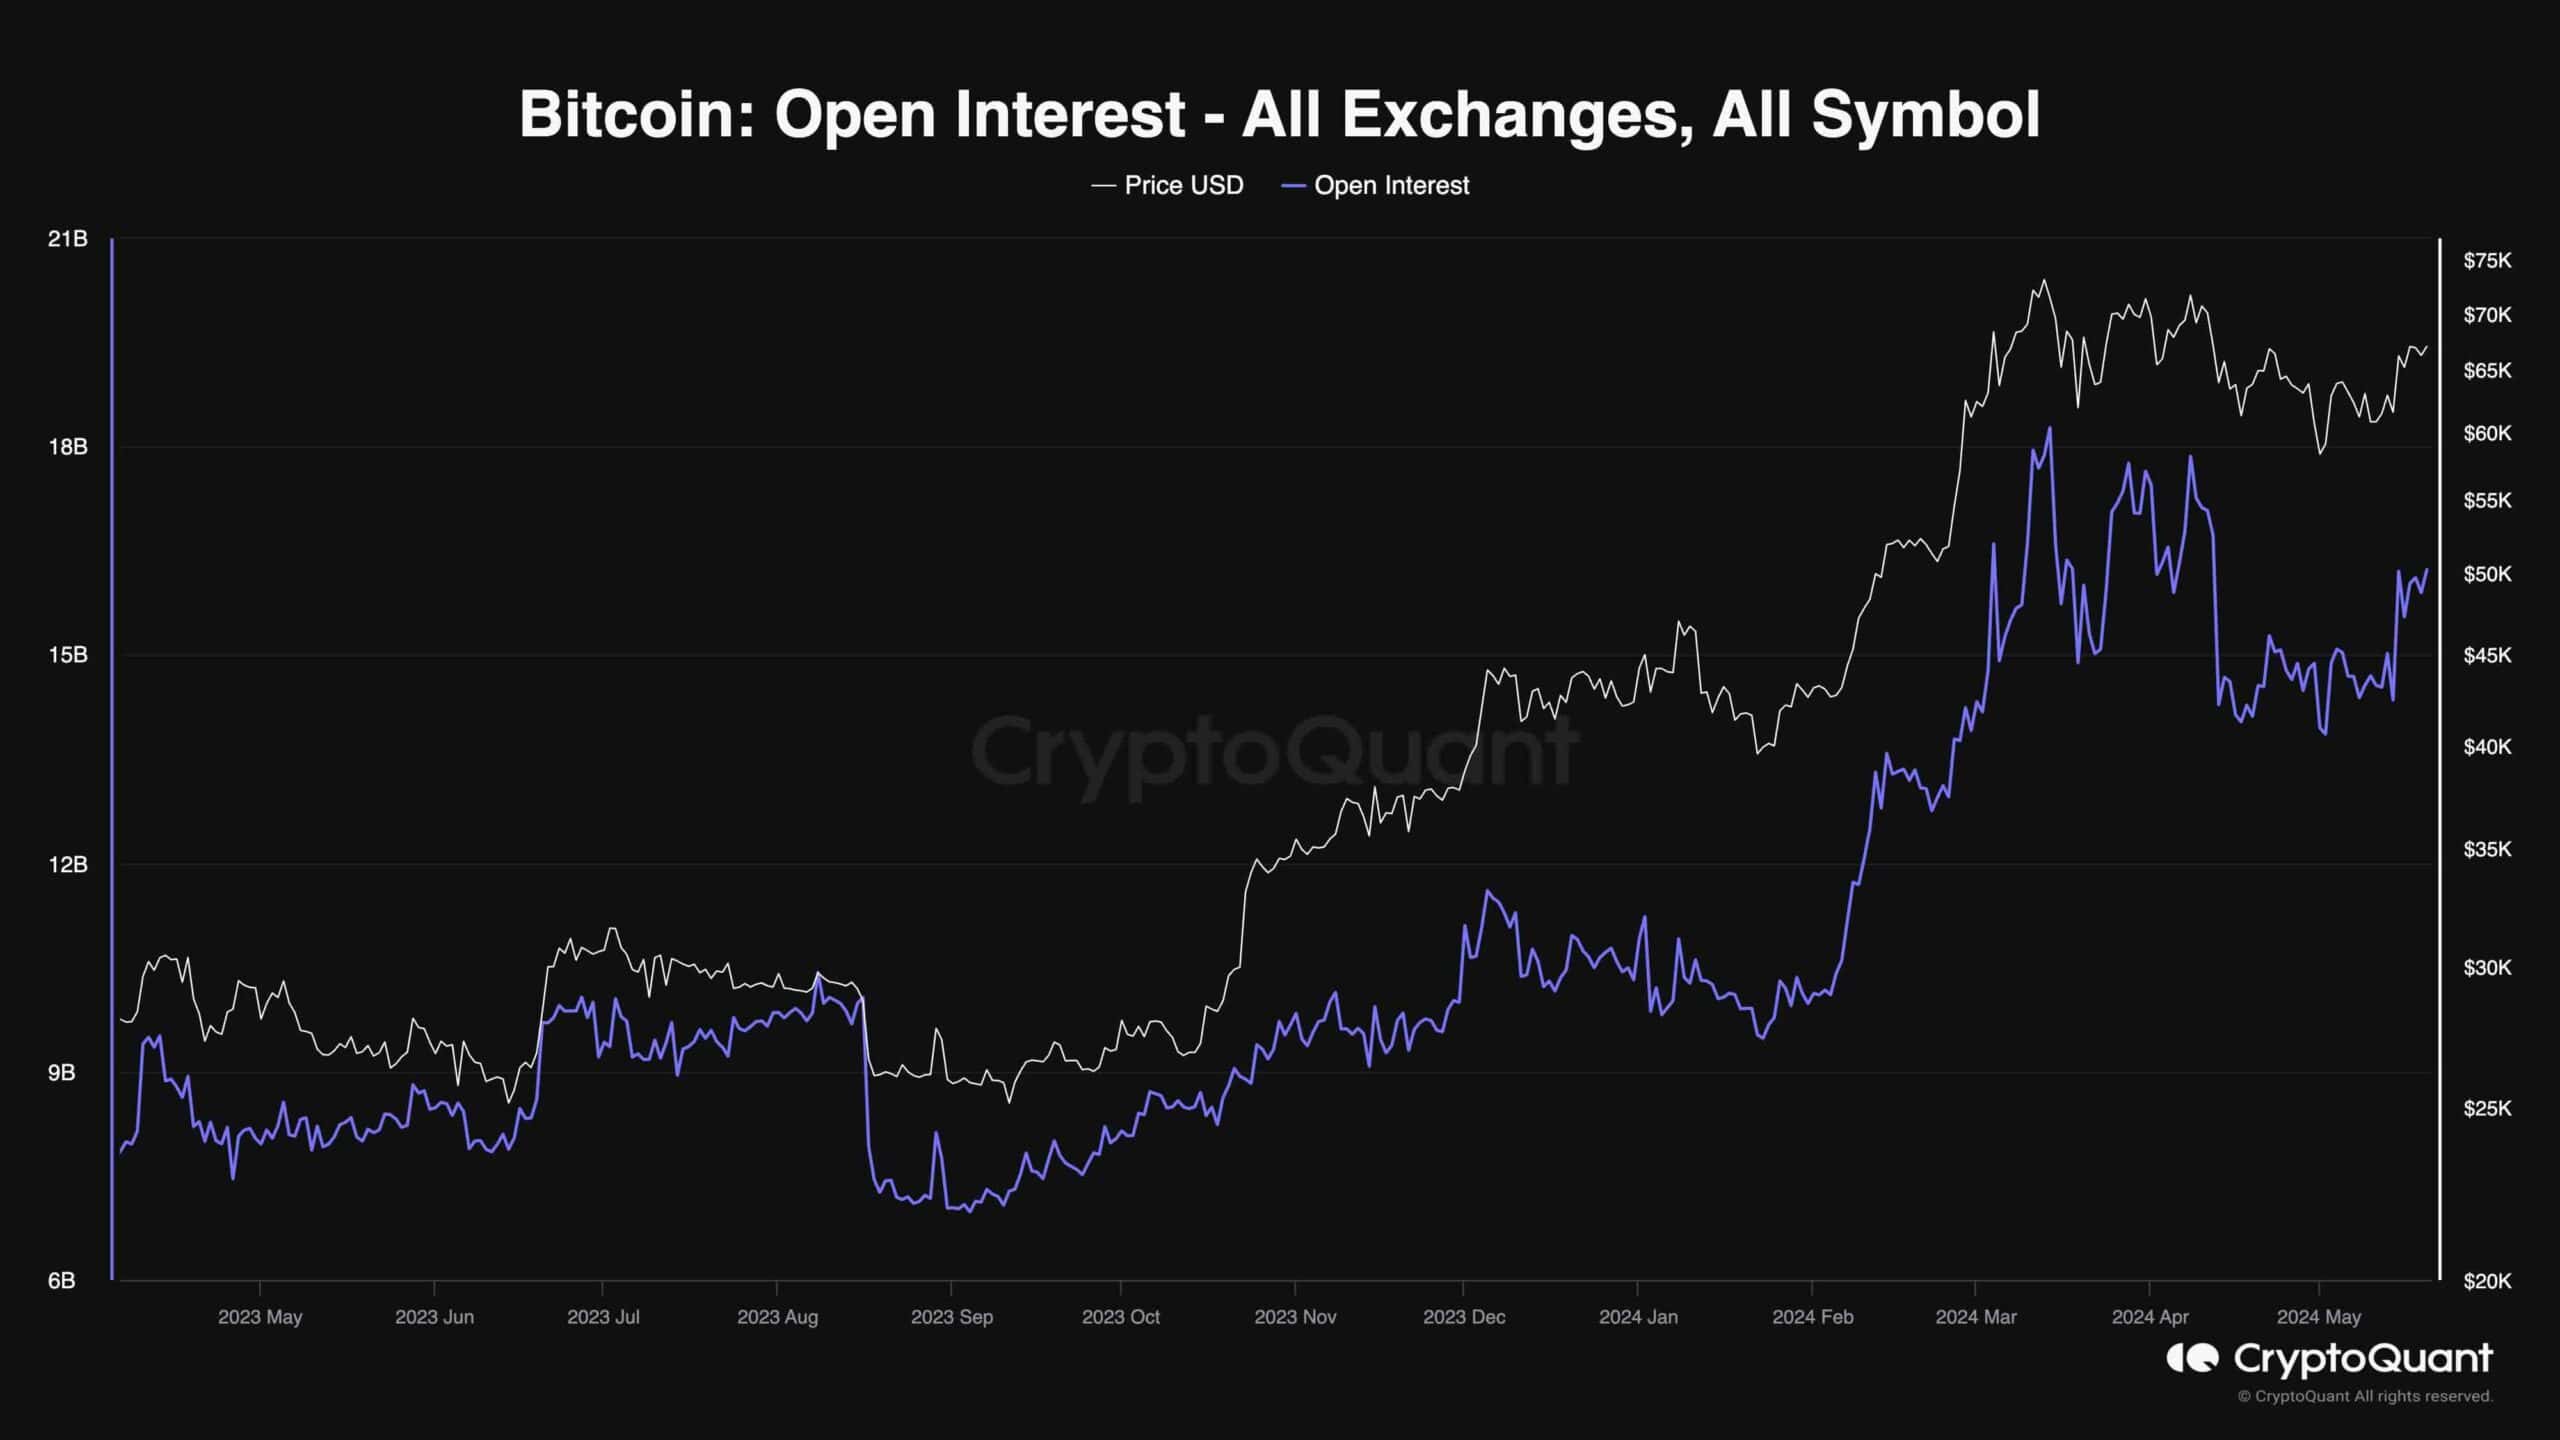
Bitcoin Open Interest
As Bitcoin has seemingly begun a new uptrend, investors might be wondering about the state of the futures market, considering its massive influence on the price.
This chart demonstrates Bitcoin’s open interest, one of the most important metrics for analyzing futures market sentiment. Higher values are typically associated with bullish sentiment and vice versa. Yet, extremely high Open Interest values can also lead to volatility and liquidation cascades.
As the chart shows, the Open Interest is currently recovering with the price, following a considerable dip during the correction. If the OI does not rise rapidly as the price increases, a sustainable rally could be expected, especially with enough demand from the spot market.
The post Is a New All-Time High on the Table if BTC Breaks Toward $70K? (Bitcoin Price Analysis) appeared first on CryptoPotato.