Is a Huge Crash to $0.43 Coming for Ripple? (XRP Price Analysis)
Ripple’s price has been trending down over the past few days. The market is targeting key support levels against both USDT and BTC.
Technical Analysis
By Edris
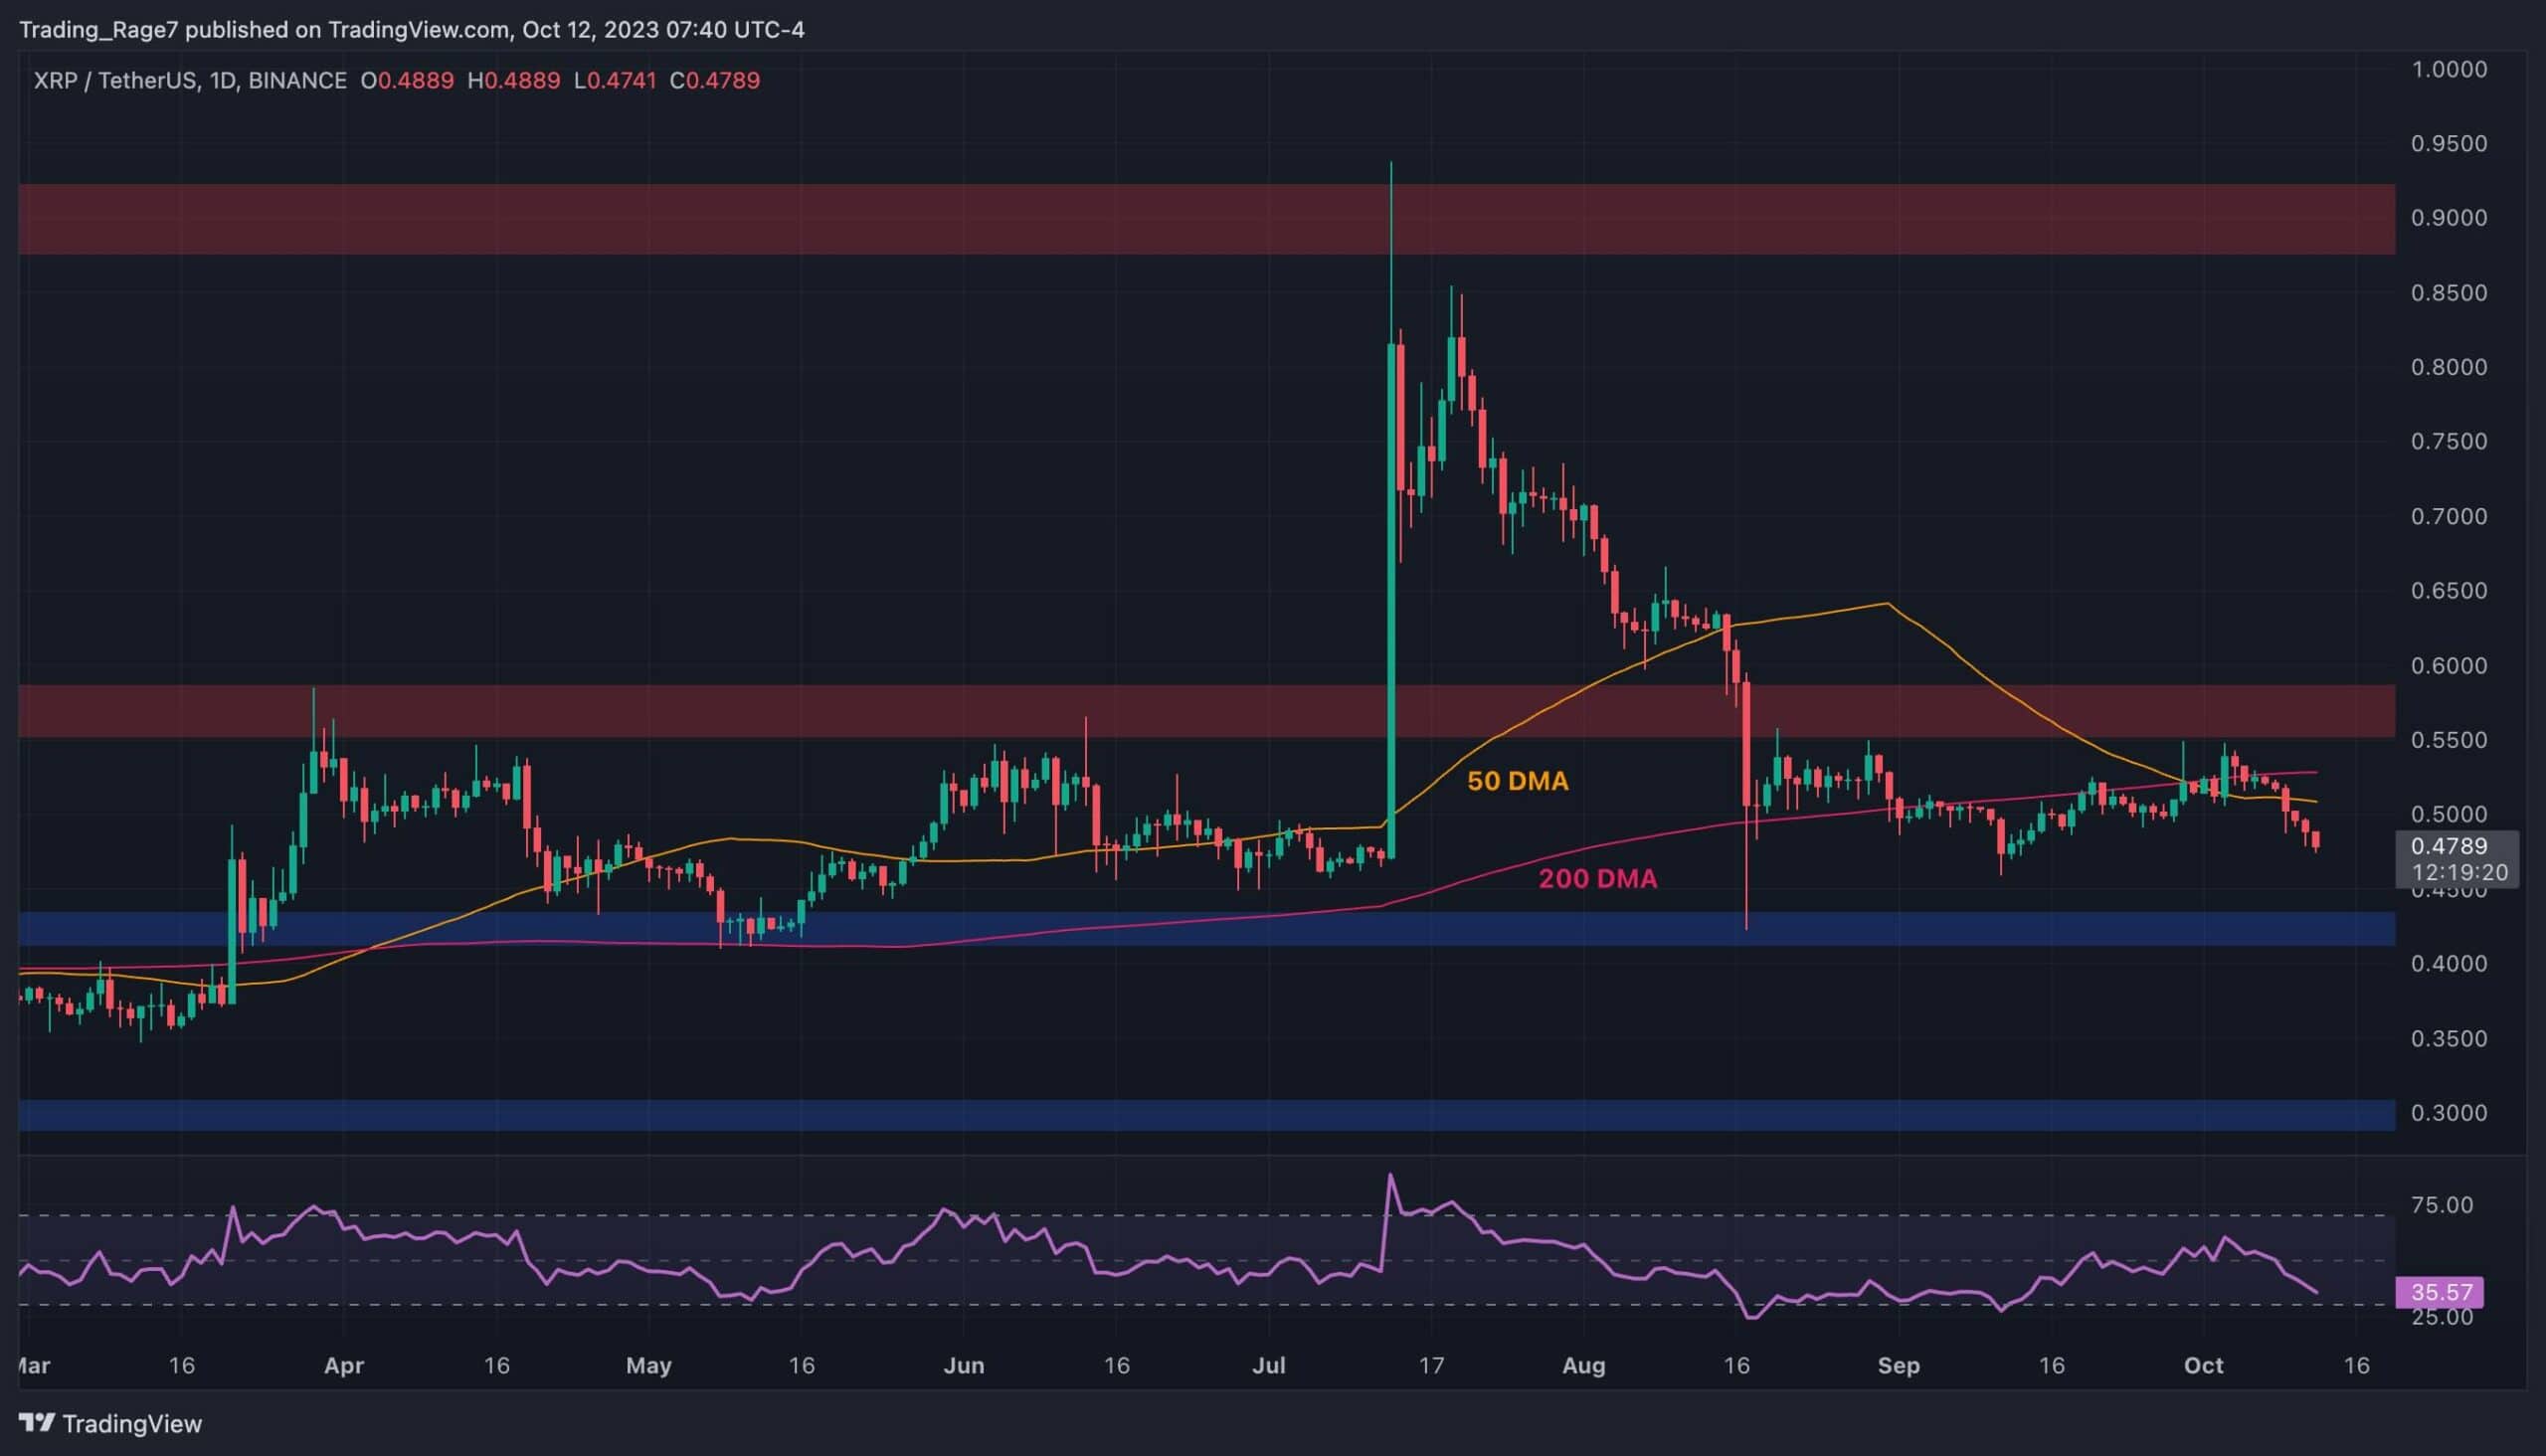
The USDT Paired Chart
Against USDT, the price has been declining since the rejection from the $0.55 resistance area. It has also broken below both the 50-day and 200-day moving averages, which are located around the $0.5 and $0.54 levels, respectively.
The RSI indicator is showing values below 50%, indicating bearish momentum. Consequently, a drop toward the $0.43 support level appears likely in the short term.
The BTC Paired Chart
The situation looks worse against BTC. The 50-day and 200-day moving averages are converging around the 1900 SAT level, potentially leading to a bearish crossover with the 50-day dropping below the 200-day. Moreover, the 1800 SAT support level seems to be breaking downwards, which could result in a rapid decline towards the 1600 SAT area.
Similar to the USDT paired chart, the RSI again suggests that momentum favors the sellers, making a bearish continuation more probable than a rebound.

The post Is a Huge Crash to $0.43 Coming for Ripple? (XRP Price Analysis) appeared first on CryptoPotato.