Investors Pour Money Into Crypto Investments for 4th Straight Month
Alex Thorn
Head of Firmwide Research
Galaxy
Hear Alex Thorn share his take on “Bitcoin and Inflation: It’s Complicated” at Consensus 2023.
Alex Thorn
Head of Firmwide Research
Galaxy
Hear Alex Thorn share his take on “Bitcoin and Inflation: It’s Complicated” at Consensus 2023.
:format(jpg)/www.coindesk.com/resizer/Nmp3uOLrfZuoxAeaCg5z6b27KoU=/arc-photo-coindesk/arc2-prod/public/S65B2QZAVNEBRBOGNCIVH5F7F4.png)
Lyllah Ledesma is a CoinDesk Markets reporter currently based in Europe. She holds bitcoin, ether and small amounts of other crypto assets.
Alex Thorn
Head of Firmwide Research
Galaxy
Hear Alex Thorn share his take on “Bitcoin and Inflation: It’s Complicated” at Consensus 2023.
Alex Thorn
Head of Firmwide Research
Galaxy
Hear Alex Thorn share his take on “Bitcoin and Inflation: It’s Complicated” at Consensus 2023.
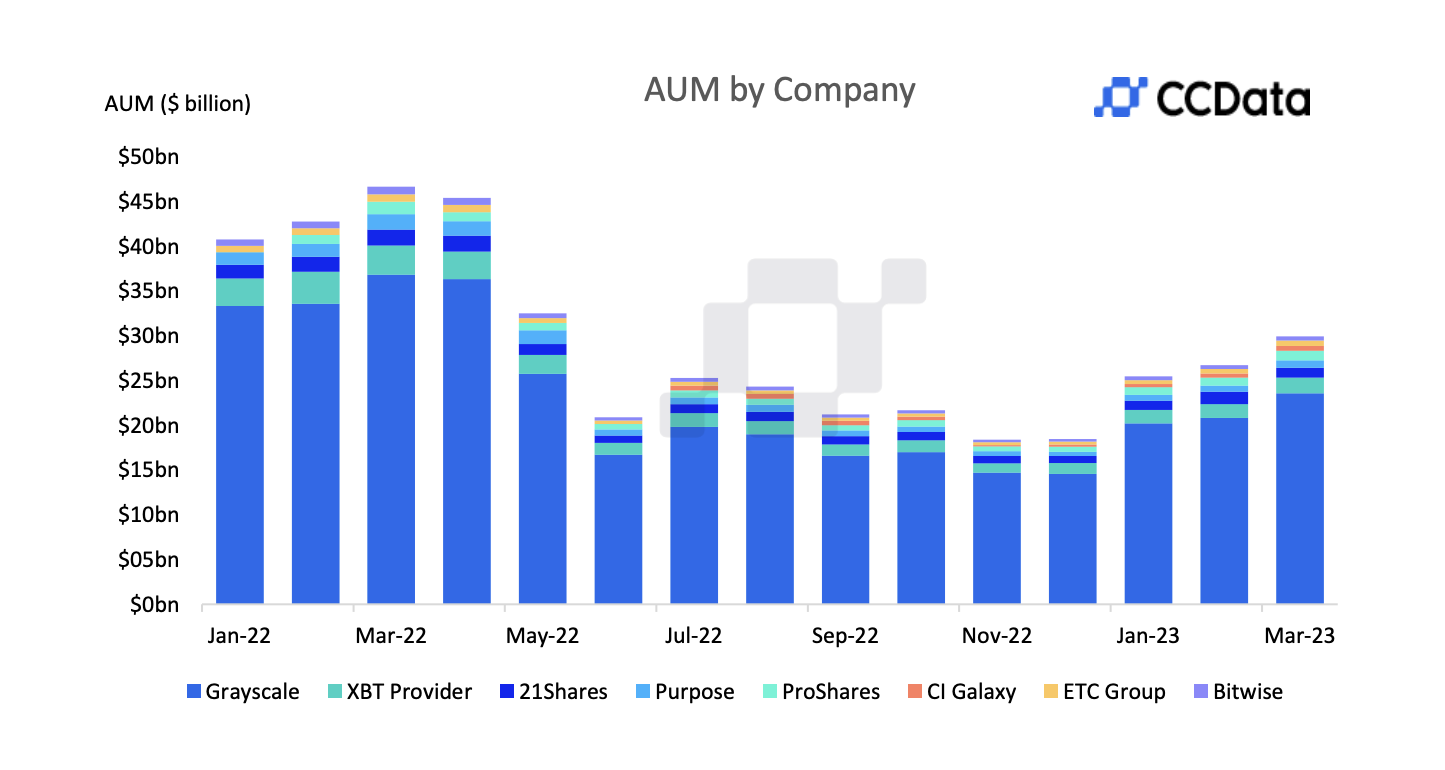
The amount invested in digital-asset products climbed for a fourth straight month in March as cryptocurrency prices continued to soar, according to data from CryptoCompare.
Assets under management increased to $13.4 billion, up 10.9% from February and up 60% from November, when the total sank to its lowest level of 2022 amid crypto exchange FTX’s collapse.
Investments in bitcoin-based products rose 14% to $22.7 billion, while ether-related ones increased 6.25% to $7.22 billion. Bitcoin’s (BTC) share of overall investment hit 72%, reaching a nine-month high in mid-March. Crypto-related products labeled “other” saw assets decrease 13.3% to $1 billion, taking their market share down to 3.2%.
“The increase in bitcoin market share was consistent with the surge in bitcoin dominance and the shift away from altcoins that investors have been making in response to the recent market turbulence,” the report stated.

(CryptoCompare)
CI Galaxy, a firm that manages funds that invest in cryptocurrencies, recorded the highest increase in assets for the second consecutive month, rising 20.3% to $553 million, followed by ProShares, which saw a 19.1% increase to $1.08 billion.
Grayscale Investments remained the dominant player, recording a total of $23.6 billion, a 13.2% increase compared to February. Grayscale is owned by CoinDesk’s parent company, Digital Currency Group.
Edited by Nick Baker.
DISCLOSURE
Please note that our
privacy policy,
terms of use,
cookies,
and
do not sell my personal information
has been updated
.
The leader in news and information on cryptocurrency, digital assets and the future of money, CoinDesk is a media outlet that strives for the highest journalistic standards and abides by a
strict set of editorial policies.
CoinDesk is an independent operating subsidiary of
Digital Currency Group,
which invests in
cryptocurrencies
and blockchain
startups.
As part of their compensation, certain CoinDesk employees, including editorial employees, may receive exposure to DCG equity in the form of
stock appreciation rights,
which vest over a multi-year period. CoinDesk journalists are not allowed to purchase stock outright in DCG
.
:format(jpg)/www.coindesk.com/resizer/Nmp3uOLrfZuoxAeaCg5z6b27KoU=/arc-photo-coindesk/arc2-prod/public/S65B2QZAVNEBRBOGNCIVH5F7F4.png)
Lyllah Ledesma is a CoinDesk Markets reporter currently based in Europe. She holds bitcoin, ether and small amounts of other crypto assets.
Learn more about Consensus 2023, CoinDesk’s longest-running and most influential event that brings together all sides of crypto, blockchain and Web3. Head to consensus.coindesk.com to register and buy your pass now.
:format(jpg)/www.coindesk.com/resizer/Nmp3uOLrfZuoxAeaCg5z6b27KoU=/arc-photo-coindesk/arc2-prod/public/S65B2QZAVNEBRBOGNCIVH5F7F4.png)
Lyllah Ledesma is a CoinDesk Markets reporter currently based in Europe. She holds bitcoin, ether and small amounts of other crypto assets.


