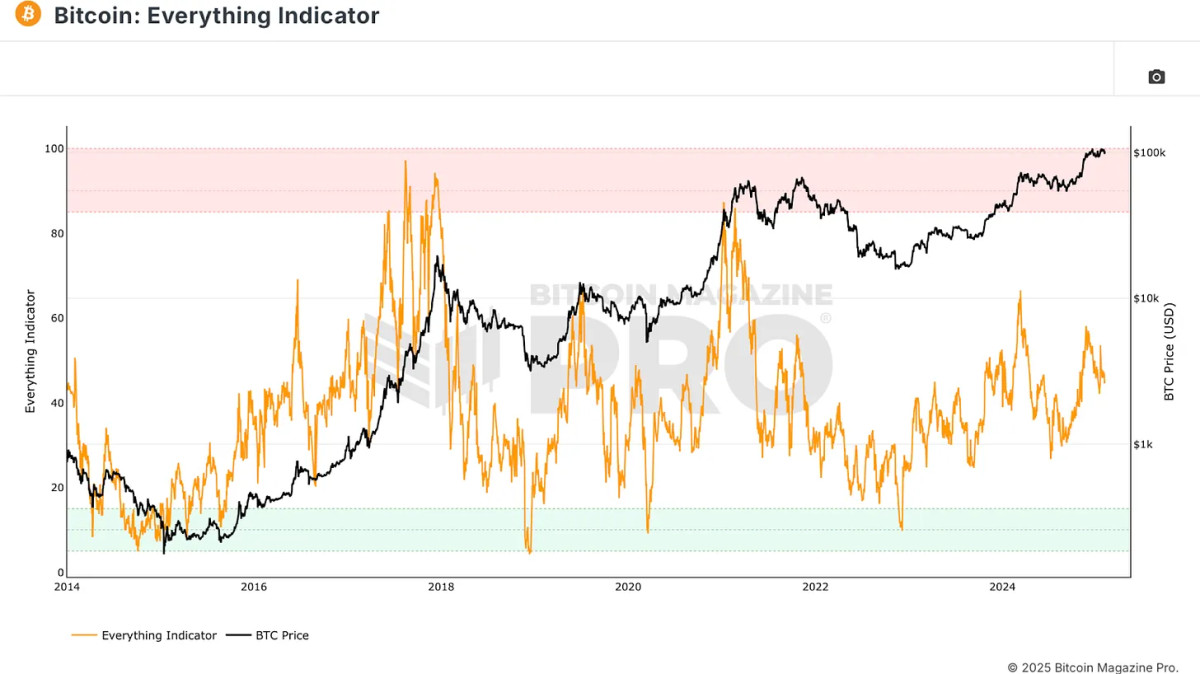
Wouldn’t it be great if we had one all-encompassing metric to guide our Bitcoin investing decisions? That’s precisely what has been created, the Bitcoin Everything Indicator. Recently added to Bitcoin Magazine Pro, this indicator aims to consolidate multiple metrics into a single framework, making Bitcoin analysis and investment decision-making more streamlined.
For a more in-depth look into this topic, check out a recent YouTube video here: The Official Bitcoin EVERYTHING Indicator
Why We Need a Comprehensive Indicator
Investors and analysts typically rely on various metrics, such as on-chain data, technical analysis, and derivative charts. However, focusing too much on one aspect can lead to an incomplete understanding of Bitcoin’s price movements. The Bitcoin Everything Indicator attempts to solve this by integrating key components into one clear metric.
Figure 1: The new Bitcoin Everything Indicator.
View Live Chart 🔍
The Core Components of the Bitcoin Everything Indicator
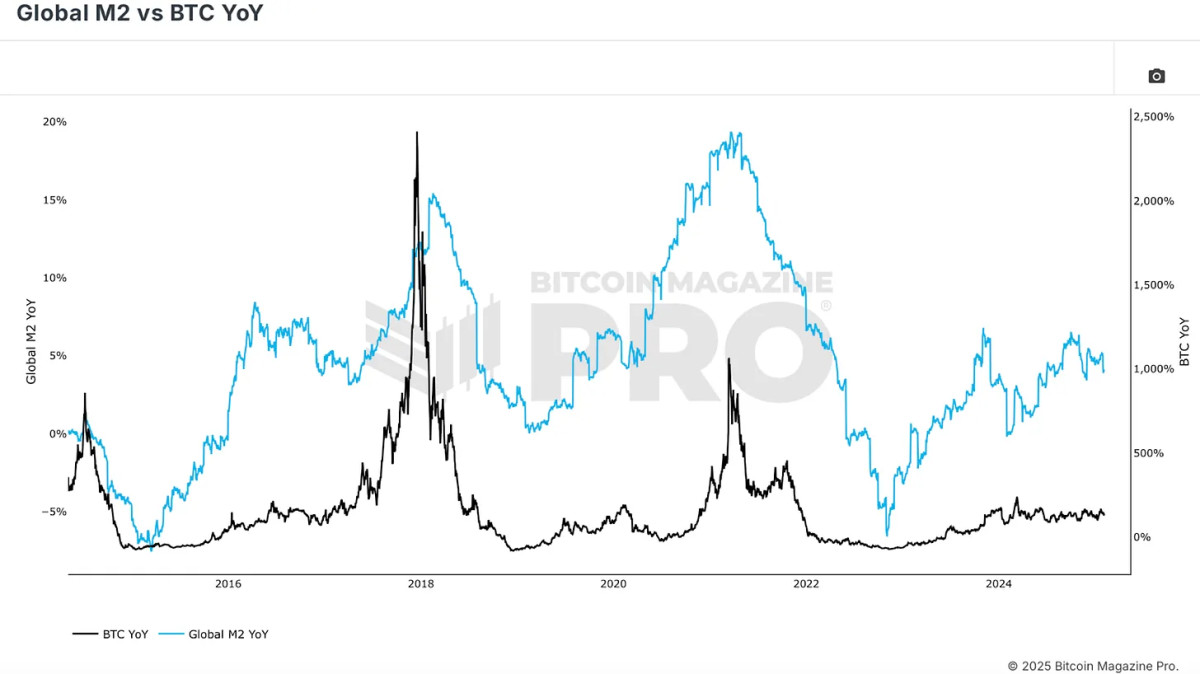
Bitcoin’s price action is deeply influenced by global liquidity cycles, making macroeconomic conditions a fundamental pillar of this indicator. The correlation between Bitcoin and broader financial markets, especially in terms of Global M2 money supply, is clear. When liquidity expands, Bitcoin typically appreciates.
Figure 2: Global Liquidity cycles have had a major influence on BTC price action.
View Live Chart 🔍
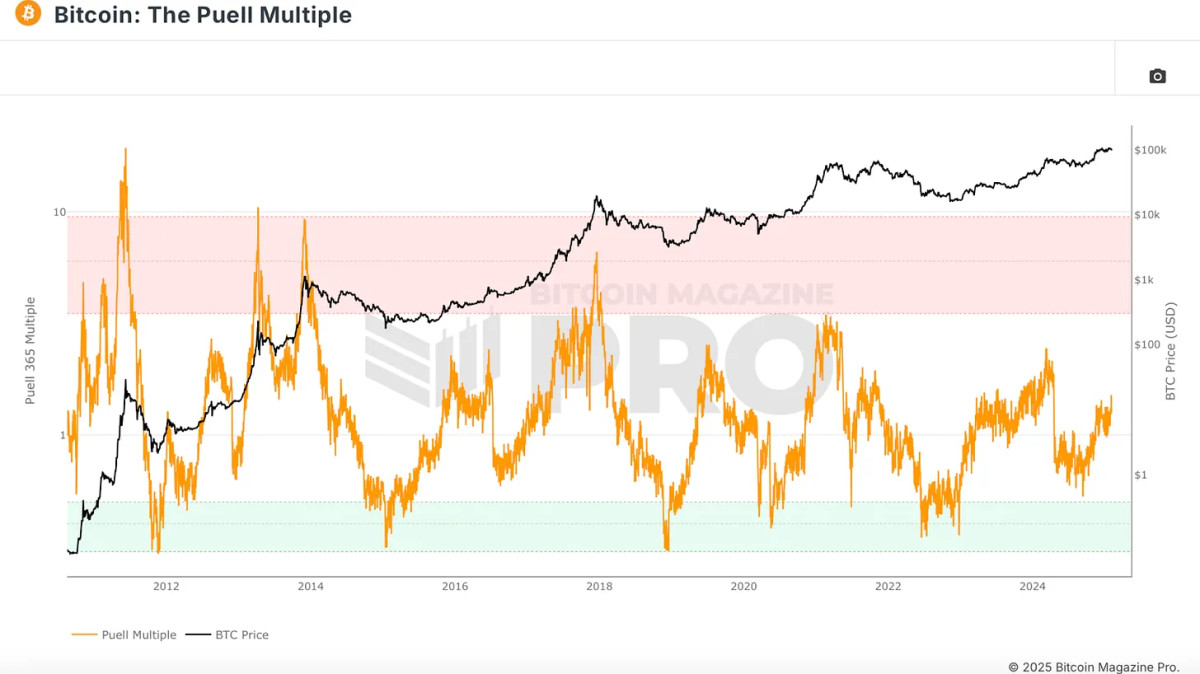
Fundamental factors like Bitcoin’s halving cycles and miner strength play an essential role in its valuation. While halvings decrease new Bitcoin supply, their impact on price appreciation has diminished as over 94% of Bitcoin’s total supply is already in circulation. However, miner profitability remains crucial. The Puell Multiple, which measures miner revenue relative to historical averages, provides insights into market cycles. Historically, when miner profitability is strong, Bitcoin tends to be in a favorable position.
Figure 3: BTC miner profitability has been an accurate gauge of network health.
View Live Chart 🔍
On-chain indicators help assess Bitcoin’s supply and demand dynamics. The MVRV Z-Score, for example, compares Bitcoin’s market cap to its realized cap (average purchase price of all coins). This metric identifies accumulation and distribution zones, highlighting when Bitcoin is overvalued or undervalued.
Figure 4: The MVRV Z-Score has historically been one of the most accurate cycle metrics.
View Live Chart 🔍
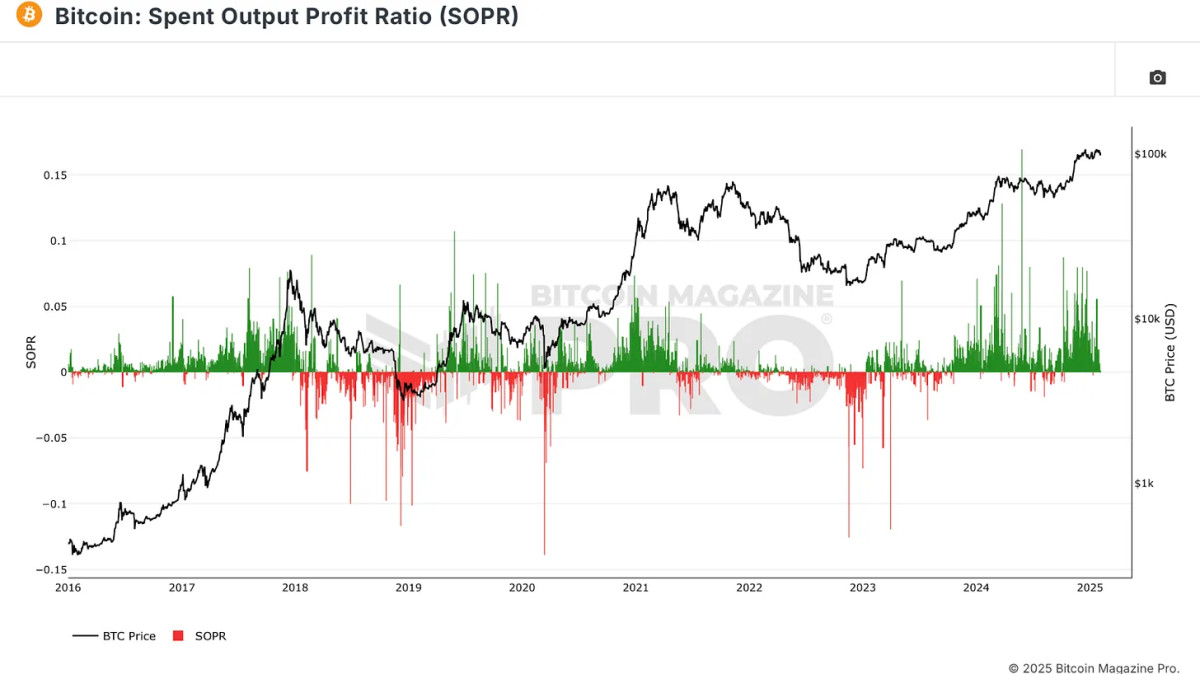
Another critical on-chain metric is the Spent Output Profit Ratio (SOPR), which examines the profitability of coins being spent. When Bitcoin holders realize massive profits, it often signals a market peak, whereas high losses indicate a market bottom.
Figure 5: SOPR gives insight into real-time realized investor profits and losses.
View Live Chart 🔍
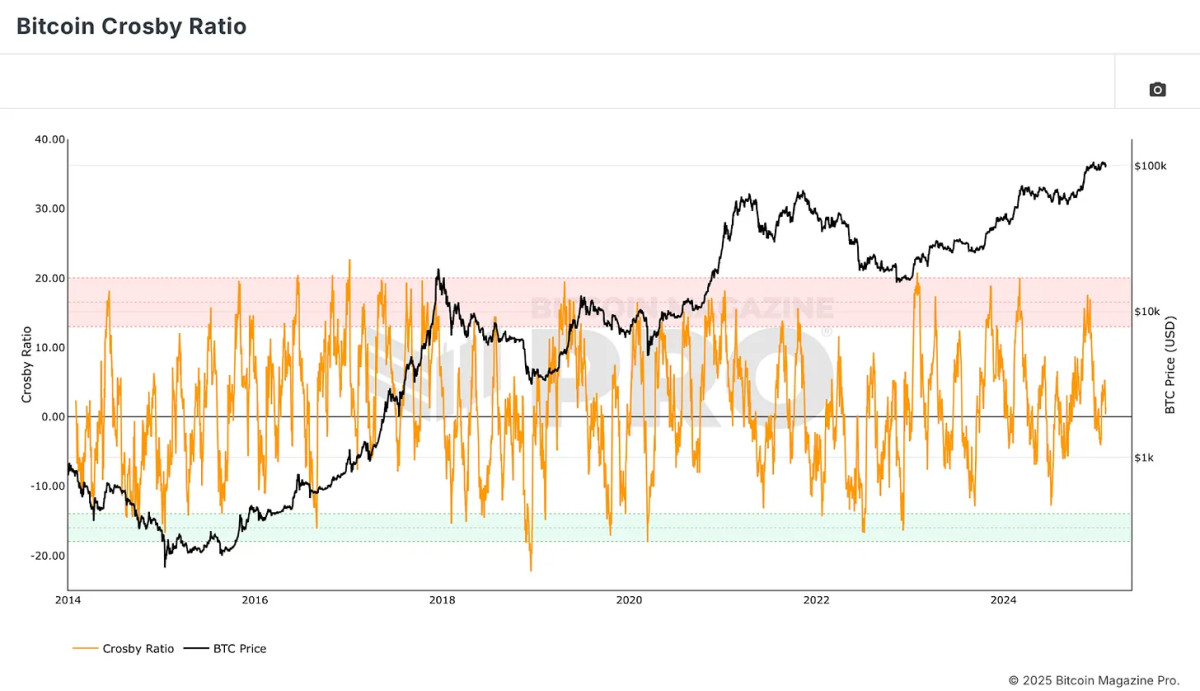
The Bitcoin Crosby Ratio is a technical metric that assesses Bitcoin’s overextended or discounted conditions purely based on price action. This ensures that market sentiment and momentum are also accounted for in the Bitcoin Everything Indicator.
Figure 6: The Crosby Ratio has technically identified peaks and bottoms for BTC.
View Live Chart 🔍
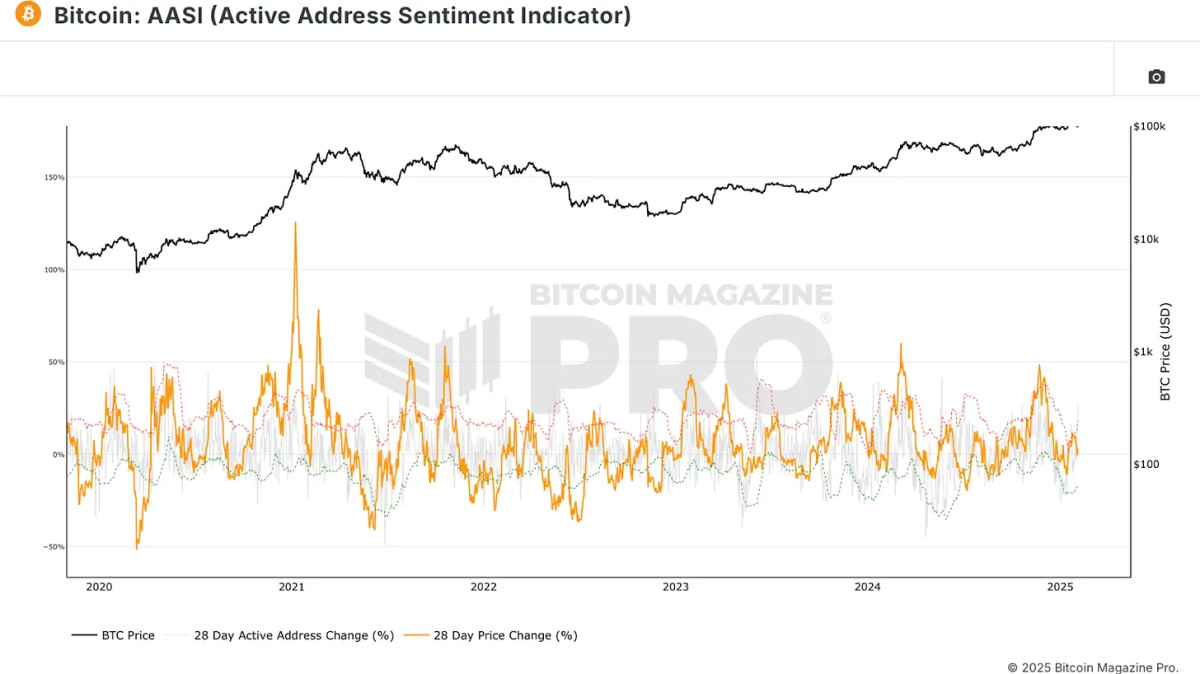
Network usage can offer vital clues about Bitcoin’s strength. The Active Address Sentiment Indicator measures the percentage change in active addresses over 28 days. A rise in active addresses generally confirms a bullish trend, while stagnation or decline may signal price weakness.
By blending these various metrics, the Bitcoin Everything Indicator ensures that no single factor is given undue weight. Unlike models that rely too heavily on specific signals, such as the MVRV Z-Score or the Pi Cycle Top, this indicator distributes influence equally across multiple categories. This prevents overfitting and allows the model to adapt to changing market conditions.
Figure 8: The most influential factors impacting the price of bitcoin.
Historical Performance vs. Buy-and-Hold Strategy
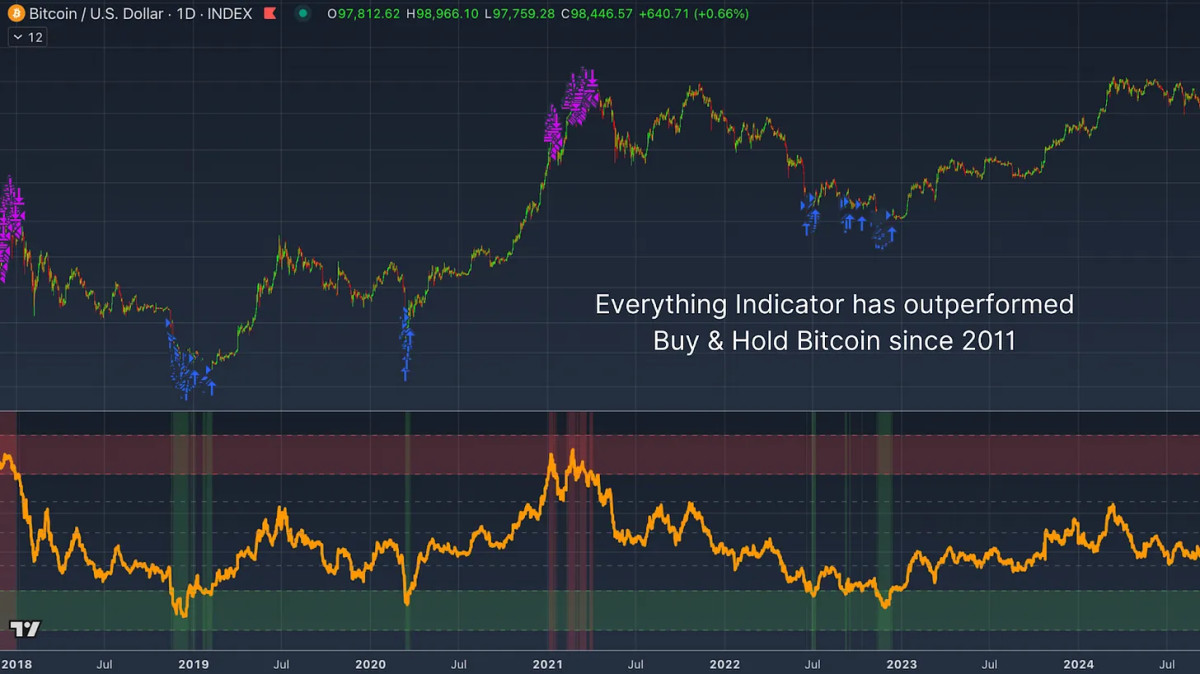
One of the most striking findings is that the Bitcoin Everything Indicator has outperformed a simple buy-and-hold strategy since Bitcoin was valued at under $6. Using a strategy of accumulating Bitcoin during oversold conditions and gradually selling in overbought zones, investors using this model would have significantly increased their portfolio’s performance with lower drawdowns.
Figure 9: Investing using this metric has outperformed buy & hold since 2011.
For instance, this model maintains a 20% drawdown compared to the 60-90% declines typically seen in Bitcoin’s history. This suggests that a well-balanced, data-driven approach can help investors make more informed decisions with reduced downside risk.
Conclusion
The Bitcoin Everything Indicator simplifies investing by merging the most critical aspects influencing Bitcoin’s price action into a single metric. It has historically outperformed buy-and-hold strategies while mitigating risk, making it a valuable tool for both retail and institutional investors.
For more detailed Bitcoin analysis and to access advanced features like live charts, personalized indicator alerts, and in-depth industry reports, check out Bitcoin Magazine Pro.
Disclaimer:This article is for informational purposes only and should not be considered financial advice. Always do your own research before making any investment decisions.
A country so troubled could benefit mightily from an early adoption of such a powerful technology.Dear Ebrahim Raisi,Congratulations on your victory in the presidential election. This election and your term as President will dictate the future of Iran. I am a citizen of Iran who has spent my life living in America, and I want…
2TM, the owner of Mercado Bitcoin, had captured $200 million in July and is now valued at about $2.15 billion.2TM, the owner of Brazil’s biggest bitcoin exchange, Mercado Bitcoin, has raised $50 million in an extension round.Now valued at $2.15 billion, the group had captured $200 million in July from SoftBank Group Corp.Mercado Bitcoin has…
Listen To This Episode: AppleSpotifyGoogleLibsynOvercast In this episode of “The Van Wirdum Sjorsnado,” hosts Aaron van Wirdum and Sjors Provoost discussed activation of the Taproot soft fork upgrade, and more specifically, the lock-in on timeout (LOT) parameter. The LOT parameter can be set to either “true” (LOT=true) or “false” (LOT=false). LOT=false resembles how several previous…
Workers in Argentina may be able to receive pay in BTC and store their wealth without fear of inflation.The “Pay Me In Bitcoin” movement just got a lot stronger today when José Luis Ramón, a member of Argentina’s National Congress, announced he submitted a bill that would allow workers in a dependency relationship and exporters…
This article is featured in Bitcoin Magazine’s “The Primary Issue”. Click here to get your Annual Bitcoin Magazine Subscription.Click here to download a PDF of this article.Tuesday, August 29th @ 11:36 AM The following is an interview with Brian Consolvo, Principal–Technology Risk at KPMG. He is a co-author of KPMG’s new report “Bitcoin’s role in
Nearly three-quarters of U.K.-based crypto businesses have been forced to bank abroad due to the difficulty in opening a bank account locally, according to a survey conducted by CryptoUK, a self-regulatory trade body representing the domestic crypto asset industry. The organization, which carried out a survey of more than 40 leading companies in the crypto…
The humanitarian work being done by Agua x Vida is another example of the power of permissionless money.This is an opinion editorial by Renata Rodrigues, global community and education lead at Paxful.Social Change Powered By Bitcoin: Part One Bitcoin is changing the face of philanthropy. Not only does bitcoin offer transparency and efficiency to nonprofit…
Bitcoin Magazine This Easy Bitcoin ETF Flow Strategy Beats Buy and Hold by 40% Bitcoin has seen an institutional capital influx on a scale previously unfathomable. Billions of dollars are flowing into Bitcoin ETFs, reshaping the liquidity landscape, inflow-outflow dynamics, and investor psychology. While many interpret this movement as smart money executing complex strategies backed
Bitcoin investors and analysts constantly seek innovative tools and indicators to gain a competitive edge in navigating volatile market cycles. A recent addition to this arsenal is the Pi Cycle Top Prediction chart, now available on Bitcoin Magazine Pro. Designed for professional and institutional investors, this chart builds on the widely recognized Pi Cycle Top