Introducing On-Chain Bitcoin Analysis
In collaboration with Glassnode, Bitcoin Magazine is introducing more Bitcoiners to the world of on-chain analytics.
This article is a collaboration by Glassnode and Bitcoin Magazine to introduce Bitcoiners to the world of on-chain analysis. Our aim is to simplify, demystify and improve access to on-chain data, helping you take the first steps into using these powerful new tools.
The Bitcoin blockchain is one of the most organic sources of data into human behavior in a free market that the world has ever seen. From its cypherpunk roots without price, to today’s corporate adoption with eyes on #LazerRaysTo100K, human demand for ultimate scarcity has attracted buyers and sellers from all walks of life.
Financial markets at their core are a balance of supply and demand which ultimately plot human psychology and perception of value against time. Market analysts have developed and deployed many tools to evaluate present and future valuations. Their goal is to find market inefficiencies, edge and financial advantage over their competitors.
Broadly speaking, there are three primary fields of market analysis and approaches that are utilized within the traditional finance world:
- Macroeconomic (Macro): Analysis of the big picture interrelation of asset classes, geopolitics and central bank policies over very long time scales. The aim is to identify large scale macro trends and opportunities with focus on baskets, indices and asset classes rather than individual “stock picks.”
- Fundamental Analysis/Value Investing (FA): Analysis of the intrinsic and structural advantages and weaknesses of a particular asset or asset class against the total addressable market and competitors. The aim is seeking to capitalize on under/overvaluation and market inefficiencies and identifying prices of maximum relative value.
- Technical Analysis (TA): Analysis of price signals, charts and indicators to extract information, patterns and probabilities with respect to the supply and demand balance over time. TA often places less relative emphasis on asset fundamentals, and instead focuses on the distillation of all known information into one metric: price.
Analysts and traders can opt to deploy any combination of skills and techniques from all fields, while others may specialize in just one. In all cases however, there is a critical input:
Accurate, high quality, timely and preferably asymmetric data.
Data availability is also subject to varying timescales; Technical analysts can observe price data to the second, fundamental analysts may watch quarterly reporting seasons, and macro investors pay attention to monthly central bank meetings and year-over-year changes.
Along comes Bitcoin.
Radical Transparency
A sound, digital monetary asset that continues to take ground in the minds of investors and analysts around the world. Over the past 12 years, a plethora of strategies and models have been developed in an attempt to model and project the adoption curve, performance and price of bitcoin. Analysts have used everything from transaction volumes to estimates of stored value and even rainbows, with no end in sight for the innovation and creativity.
Going back as far as 2011 Bitcointalk forums, we see the first discussion of the “bitcoin days destroyed” concept (now “coin days destroyed (CDD)”). These early ideas gave rise to open-source iteration and deeper study of the information contained within the Bitcoin ledger. This has now introduced a brand-new concept and field of analysis to financial markets:
On-Chain Analysis: Analysis of the immutable record and objective truth that is the Bitcoin ledger. Analysts observe the supply and demand dynamics, human psychology and decisions, and patterns of spending, HODLing and miner hashing within a truly free market.
By taking the radically-transparent and openly-public information that Bitcoin provides, anyone can now assess the true movement of coins, miner activity and the volume and age of wallet holdings. Bitcoin acts as an immutable record of human behavior, psychology and decision making within a free market for perfect scarcity.
While Bitcoin itself does not know the price or the trades that happen, it does have a perfect memory of every UTXO, every difficulty adjustment and every timestamp for when events happened on chain. Despite this information being public record, very few know how to study it properly to establish a macro view of the bitcoin market.
Glassnode’s objective is to solve that problem.
Principles Of On-chain Analysis
It is true that many of the original ideas and concepts needed to construct on-chain metrics are complex, and require skills in data science, calculations and coding. However, the application of ready-to-go tools such as those in Glassnode Studio are actually far less intimidating than you may think!
One does not need to be a math or code wizard to utilize on-chain tools. In fact, on-chain analysis maximally benefits Bitcoiners who have a good grasp of the network fundamentals and the incentives of the people who interact with it.
There are two key disciplines of on-chain analysis:
- Blockchain Archaeology: A very specialized role for someone who processes granular data like transactions, exchange balances and wallet clusters.They convert this “micro data” into reliable and accurate “macro metrics.”
- On-Chain Analysts: Next, these analysts take the macro metrics and interpret the most likely trends and indicators as it relates to market sentiment and behavior of various parties of interest.
The secret sauce to effective on-chain analysis is asking the right questions and knowing where to look:
- Who are the network participants whose behavior you are interested in (whales, exchanges, miners, speculators, etc.)?
- What are their drivers, incentives and pain points (profit and loss, mined incomes, accumulation of sats, etc.)?
- How are their decisions printed immutably on-chain (fees paid, transaction volumes, difficulty adjustments, wallet balances, coin dormancy, etc.)?
Let’s start with a simple example of how the behavior of the “smart money” investors might show up on chain.
On Chain In Practice
We can reasonably assume that smart money and whale investors have a better-than-average understanding about Bitcoin. They specialize in accumulating cheap coins in a bear market, HODLing in cold storage and realizing profits by selling expensive coins into bull market strength. As such, we have a few metrics that we can keep an eye on to follow their actions in aggregate:
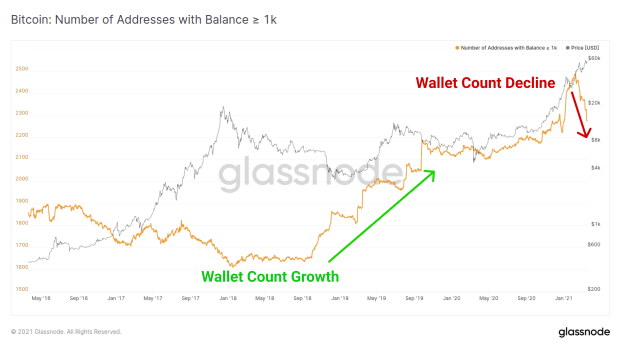
- Are large wallet balances spending or receiving coins (Address >1,000 BTC)?

- Are long dormant coins being spent back into circulation (ASOL and CDD)?

- Are large volumes of coins maturing/HODL’d in cold storage (e.g., HODL waves)?

When the smart money is accumulating, we can expect young coins to enter cold storage and mature and fewer coin days will be destroyed. We may also see more large wallets (>1,000 BTC) growing in a “whale spawning season.” This may lead to a supply squeeze and precede the start of a bullish trend.
Conversely, when the conditions are right, these investors might bring their coins out of cold storage and start spending into the economy. These old coins will destroy larger volumes of coin days, have larger average lifespans, convert a large volume of old coins into young coins and reduce the number of whale wallets.
This example is just one of a combination of on-chain tools that paints a picture of one group of network participants in the macro Bitcoin economy. We could also observe exchange balances, miner spending behaviors, HODL demand and combine these insights with our traditional macro, fundamental and technical analysis for a holistic assessment.
The beautiful part about on-chain data is that it reflects the objective and unforgeable truth. It is expensive to make all actions on chain as one must pay a fee with scarce sats, burn energy with every hash and consider the opportunity cost of every spend. As a result, observations on-chain tend to be slower than technical analysis, but have a higher conviction than day-to-day price action (making it the perfect tool for low-time-preference HODLers!).
On-Chain Paradigm
For an Bitcoiner, one really could not ask for a better field of play for bitcoin with respect to building conviction:
- Macro backdrop for the ages with a tailwind for hard assets
- Fundamental character of the soundest, hardest money ever conceived
- Technical price chart that would make any analyst’s eyes water
- On-chain analysis tools that provide a brand new and unique look into the objective truth of bitcoin’s heartbeat
Glassnode aims to make on-chain analysis accessible to everyone, no matter whether you are a Bitcoin pleb or an on-chain Jedi. As the world comes to terms with the paradigm shift that Bitcoin represents, those who develop a deep understanding of what is going on on-chain are likely to find an out-sized advantage over those who do not.
On-chain analysis is technical analysis of Bitcoin fundamentals, and Bitcoiners are already leaps and bounds ahead on the starting blocks.
At Glassnode, we are expanding both of our content lines and launching new metric explainers in our Academy to help on-board more Bitcoiners into this new field. One of the best ways to understand Bitcoin is to listen to what it is telling you, block by block.
Stay tuned for the next editions in this series brought to you by Glassnode and Bitcoin Magazine, where we will explore how different network participants’ behavior are imprinted on-chain, and how we can maximize insights from this unforgeable data.
This is a guest post by Glassnode. Opinions expressed are entirely their own and do not necessarily reflect those of BTC Inc or Bitcoin Magazine.


