There have been many claims in recent years that bitcoin and the miners securing the network via SHA-256 proof of work use an unconscionable amount of energy. But what data are these claims based on, are the source calculations using flawed or sound approaches and assumptions? How much electrical power does the network draw and how much electrical energy has the Bitcoin network used historically?
Methodologies And Misconceptions
Due to the vast, globally distributed topology of the Bitcoin network, the amount of electrical power and energy that miners consume isn’t exactly verifiable, instead it must be estimated. Among the energy consumption hysteria over the previous few years, a surprisingly large number of reputable sources have weighed in and attempted to estimate Bitcoin’s network energy consumption in more level-headed and data-derived ways:
University of Cambridge, Judge Business School (JBS)
The International Energy Agency (IEA)
Electric Power Research Institute (EPRI)
Coin Center
CoinShares
Marc Bevand
Hass McCook
Alex de Vries
Myself
Estimation methodologies seem to fall into two major categories: economics-based approachesrooted in financial assumptions, as well as physics-based approaches planted in engineering principles. These two estimation approaches were thoroughly compared and contrasted at BTC2019.
It’s important to understand when digesting all of these yearly usage estimations that electrical consumption is typically measured in two ways: instantaneously (power, watts, kilowatts, etc.) and that same instantaneous power measurement integrated over time (energy, joules, kilowatt-hours (kWh), etc.)
Small Bitcoin miners draw about 1,300 watts of power and use about 31,200 watt hours of energy over a 24-hour period.
The Problems With Economics-Based Network Energy Estimations
Economics–based approaches that estimate the Bitcoin network energy consumption generally assume perfectly rational market behavior, and can easily be manipulated with a few input variable misassumptions.
In theory, the Bitcoin mining industry is rational, profit maximizing and perfectly competitive: mining marginal revenue should tend to equal marginal cost (MR = MC). Meaning, on long enough time horizons, the market should find an equilibrium, where the cost of energy consumed in a unit of bitcoin’s production should be roughly equivalent to the unit’s market value at the time of minting. This calculation methodology can be distilled as, “How much can Bitcoin network miners afford to spend on electricity?”
Typically, these types of estimations are too dependent on a single volatile variable: the market exchange price of bitcoin. Below is a quick, simplified example of this type of estimation:
Let’s try this estimation. Bitcoin blocks are generated roughly every 10 minutes — a rate of 6 per hour, or 144 every day. Currently, a single bitcoin block contains 6.25 BTC of coinbase block subsidy; that’s 37.5 BTC per hour, or 900 newly-minted bitcoin rewarded to miners daily. With bitcoin’s current market exchange price of about $10,750 at the time of this writing, that is roughly $9,675,000 earned per day that bitcoin miners have available to spend on electricity.
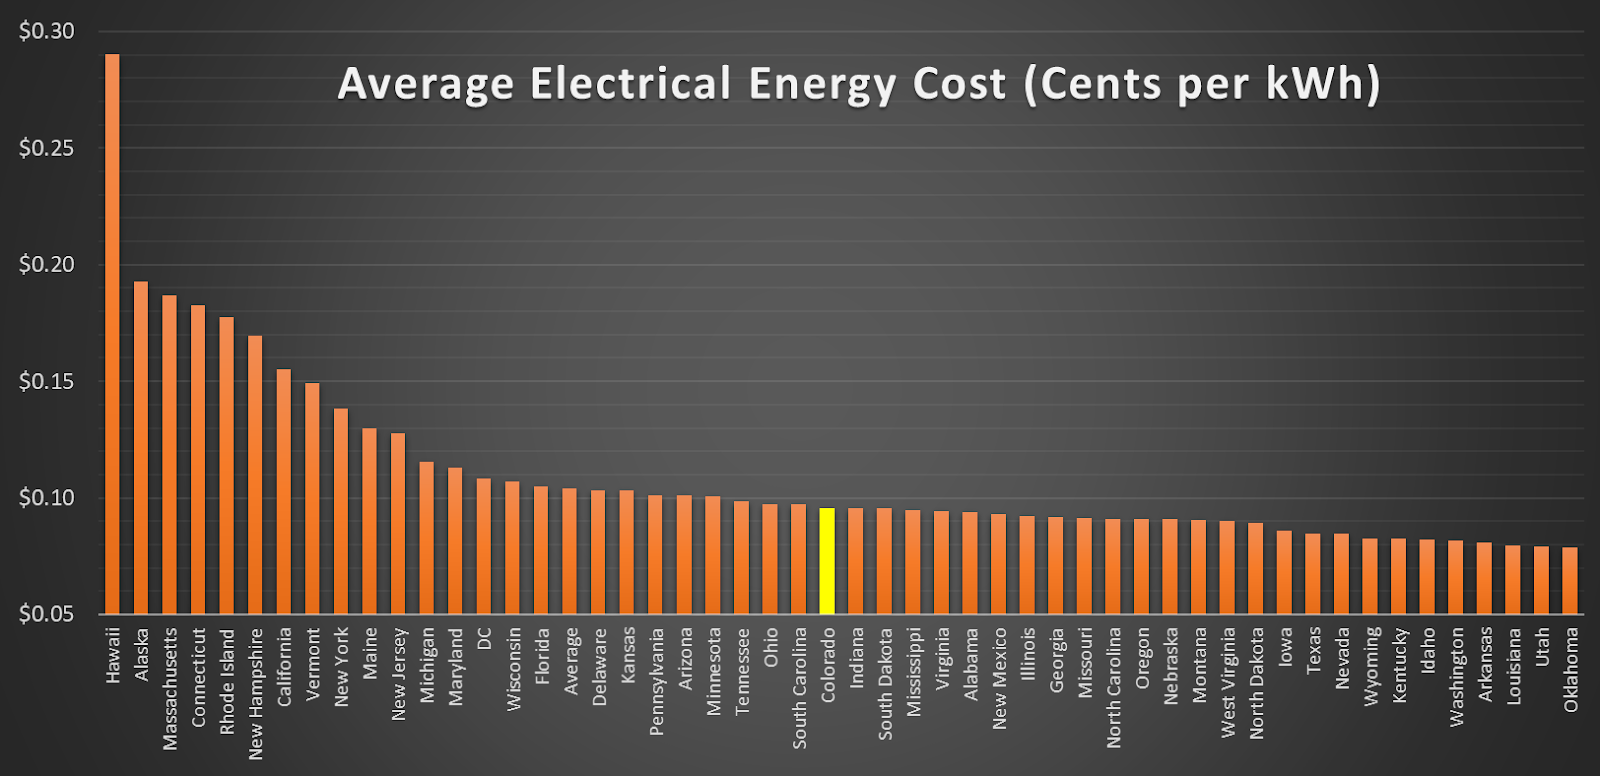
Average U.S. electrical costs in cents per kWh by state, per EIA data
This amount of daily energy equates to roughly 35.3 TWh of yearly usage that the bitcoin miners could afford to consume, if we take a snapshot today and assume constant bitcoin price for a year and U.S. average electrical costs.
While this method is overly reliant on bitcoin price, it is also heavily dependent on the assumed electrical energy cost for miners. The calculations and conclusions of this kind of estimate can be drastically different or even manipulated depending on the assumptions used as inputs: energy costs ($/kWh) and the price of bitcoin ($/BTC).
Here we used the average U.S. electrical cost of $0.10/kWh. However, in the U.S., electrical costs actually vary seasonally, from state to state, city to city and, in some cases, neighborhood to neighborhood. Global electrical costs have the same incongruence. This isn’t even including wide-ranging industrial, commercial or residential electrical energy rates, adding even more sources of error to these economics-based estimation techniques. And, in fact, this calculation’s heavy energy price dependence has yet another flaw: some miners’ high in ingenuity have near-zero fuel cost as they harvest excess, otherwise wasted, inaccessible or curtailed energy sources.
This quick exercise highlights, in my opinion, why this type of economics-based estimation approach is a gross oversimplification fraught with the following issues:
Bitcoin mining, hash rate and, therefore, network energy consumption isn’t as responsive to sudden price movements as these economics-based estimation methods are.
The economics-based model claims energy usage is cut in half along with network miner rewards after each bitcoin block reward halving cycle, which is every 210,000 blocks or about four years, while difficulty and proof-of-work-based data disproves this.
This type of model assumes a single average global energy cost ($/kWh); electrical energy costs vary widely by region, seasonally and even by energy source.
This is likely to be an upper-bound estimation.
The Benefits Of Physics-Based Network Energy Estimations
Physics–based network energy estimation approaches, on the other hand, tend to be a very rigorous type of “running of the numbers” that the Bitcoin community is accustomed to.
These methods use independently verifiable on-chain difficulty, proof-of-work data and original equipment manufacturer (OEM) -published heat rate specifications to more accurately estimate historical energy inputs into the bitcoin mining system. The physics estimation attempt may best be described as a “bitcoin stoichiometric ratio unit analysis calculation:”
Bitcoin Difficulty (Unitless) → Bitcoin Hash Rate (Daily Average TH/s)
Daily Average Hash Rate (TH/s) → Yearly Hashes (TH/Year)
Energy Per Year (Joules/Year) → (kWh/Year) → (TWh/Year) → (ktoe/Year)
So, let’s try out this style of estimation using bitcoin proof-of-work difficulty data and OEM-published data. Bitcoin network difficulty self-adjusts once every 2,016 blocks, or roughly once every two-week period. This difficulty adjustment is to compensate for block production speed discrepancies and, thus, network hash rate fluctuations.
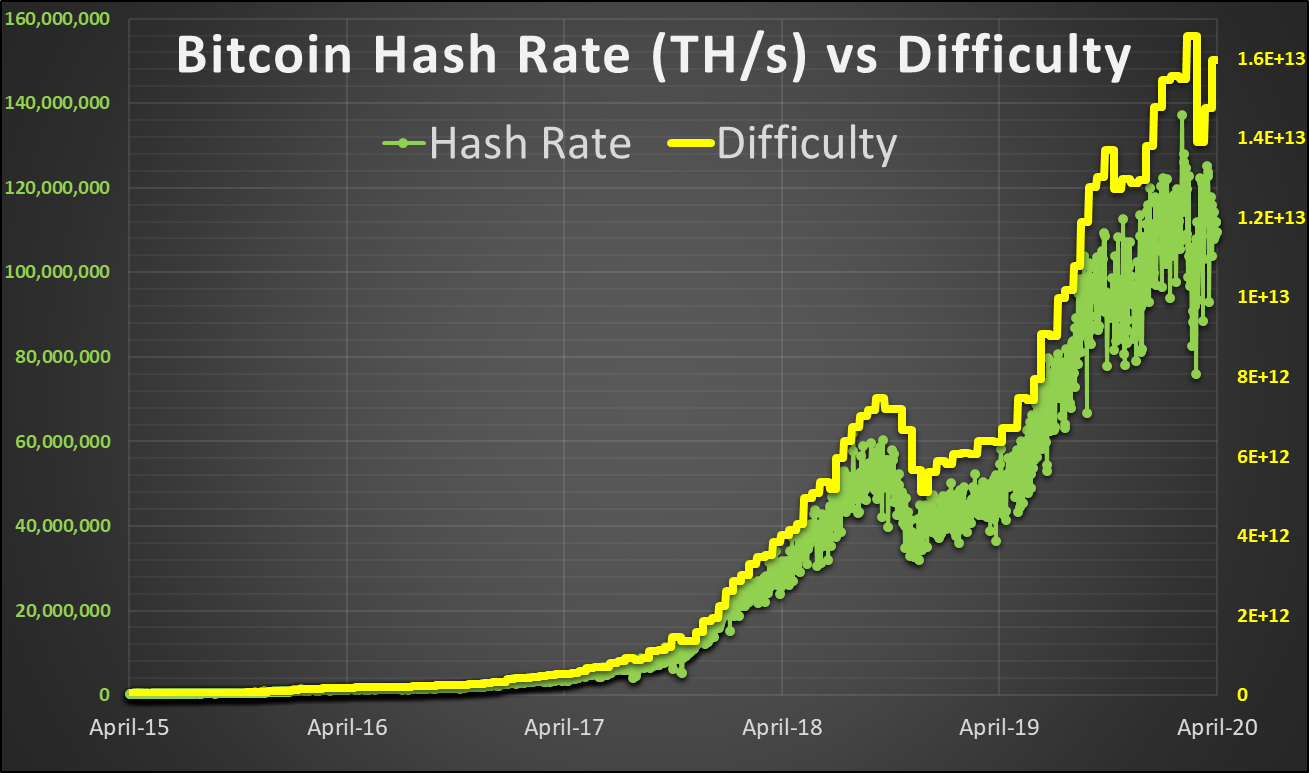
Bitcoin network hash rate (Th/s) compared to difficulty, April 2015 to April 2020.
This difficulty and proof-of-work relationship allows us to derive an estimate for network hash rate based on the block production rate and the associated difficulty level. From the amount of work done at the various difficulty levels over the previous decade, we can roughly estimate the amount of SHA-256 hashes computed per year on the Bitcoin network, shown below in terahashes per year (Th/year) or a trillion hashes per year. We can also do this same type of exercise with daily data to produce more granular calculations (spoiler: keep reading).
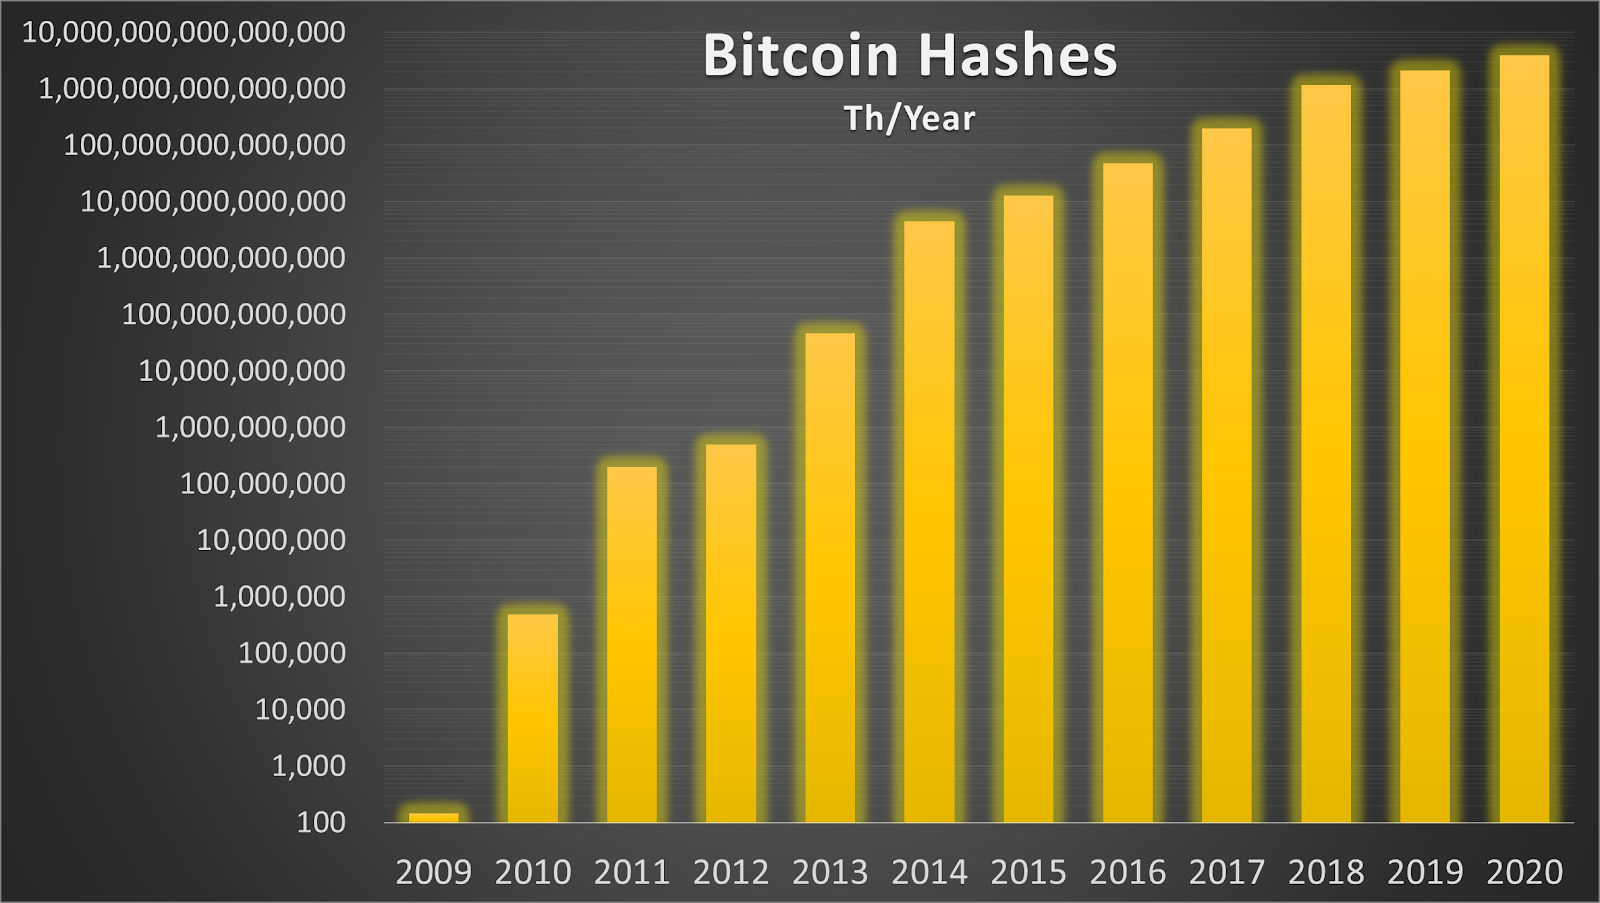
Estimated total Bitcoin network terahashes by year.
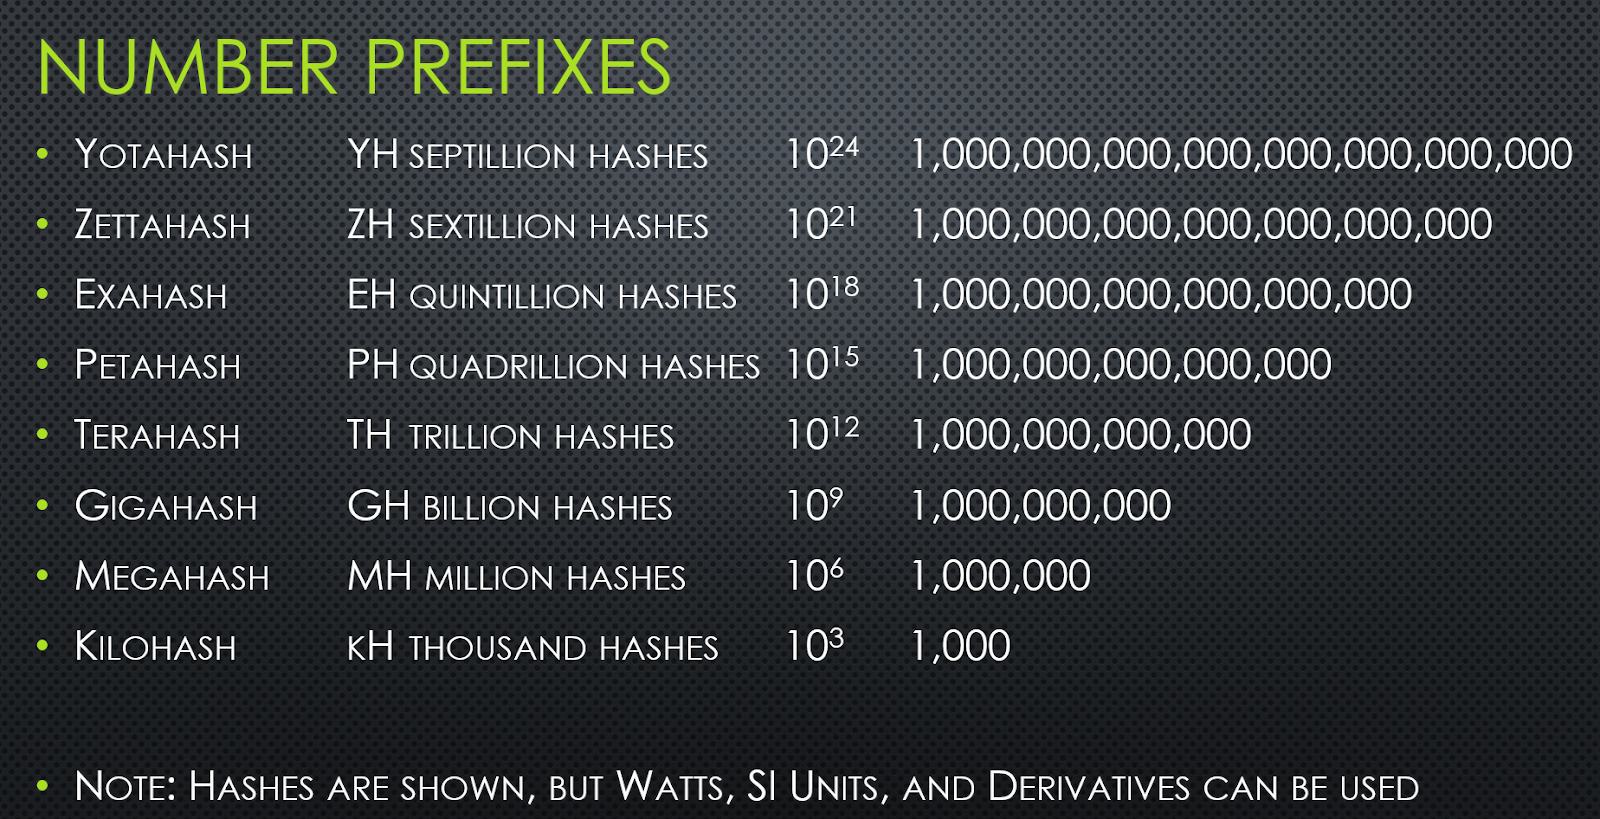
Bitcoin is on pace to have roughly 3,934 yotahashes computed on the network in 2020 or about 3,934 septillion hashes (“yota” and “septillion” are the largest of the Scientific International (SI) prefixes to date, (10²⁴)),
Scientific International (SI) unit prefixes, based on NIST data here.
Now that we have an estimation for the amount of hashes per year, next we must compile mining rig efficiency data over the past 11 years to understand how much energy would have been required to produce that amount of work.
Here it is important to understand the different types of mining equipment that have provided work toward the Bitcoin blockchain over the years. Each era and year has distinctly different proof-of-work efficiency characteristics, which change the network’s energy consumption values over time. From the humble beginnings of the Bitcoin genesis block being built by work derived from CPUs (central processing units), to blocks eventually being constructed with GPUs (graphics processing units), then on to FPGAs (field programmable gate arrays), and finally ASICs (application-specific integrated circuits) the Bitcoin network has evolved at a stunning pace.
Bitcoin network hash rate colored by general device type eras, in terahashes per second.
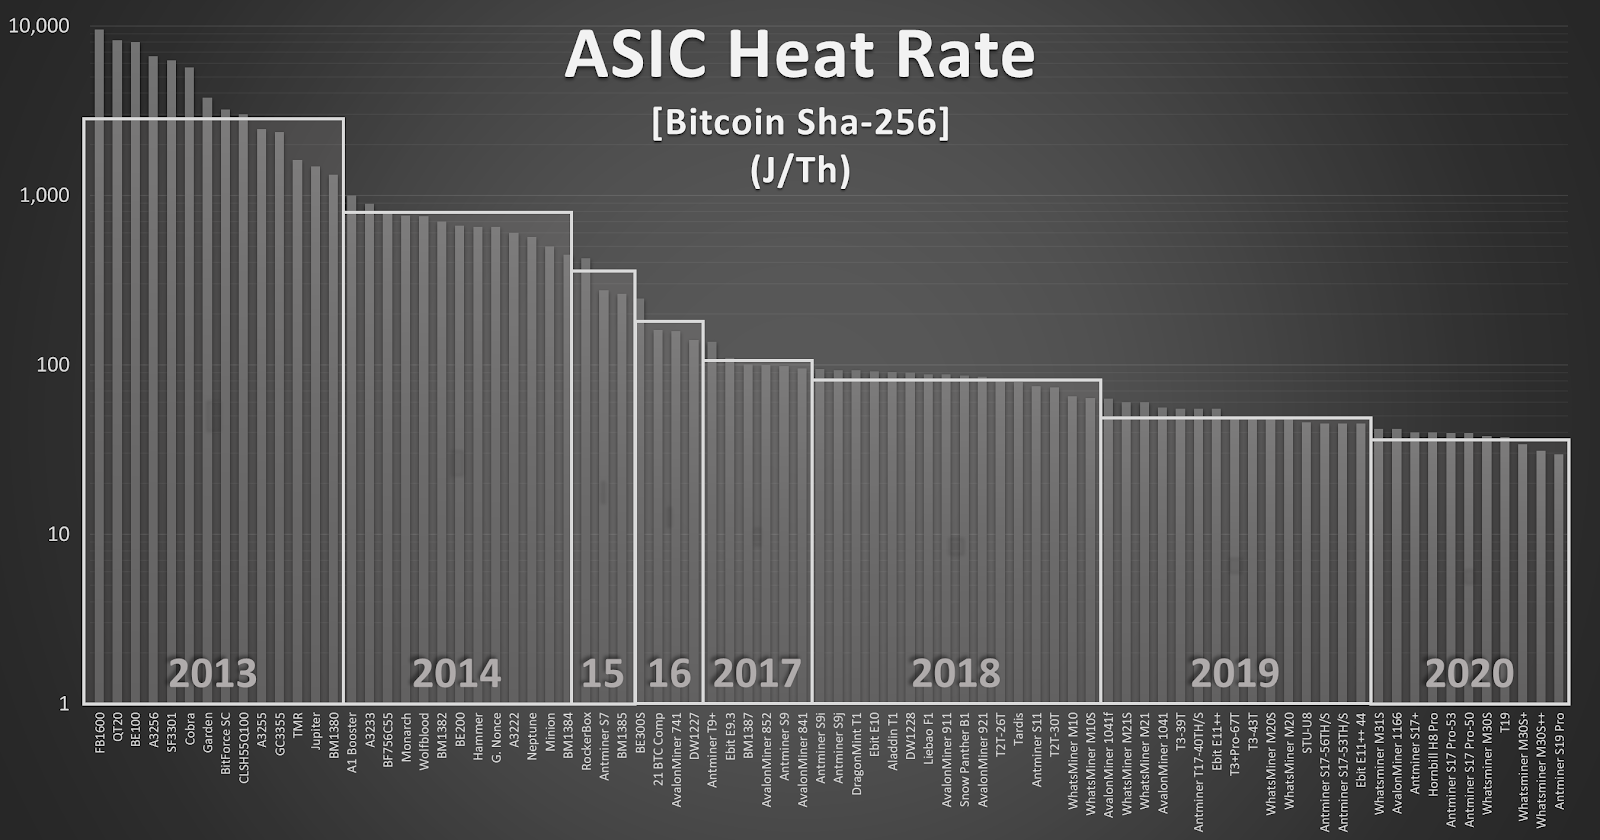
Important note:efficiencyis defined as useful work performed over energy expended to complete that work (terahash/joules — Th/J). However, ASIC original equipment manufacturers typically cite a type ofheat rate specification, or the inverse of efficiency, showing energy expended over useful work (joules per terahash — J/Th).
As you can see in the log scale chart below, over the past eight years, bitcoin mining ASICs’ heat rates have been steadily marching lower every year, meaning network mining efficiency has been increasing.
Manufacturer published SHA-256 ASIC energy per hash heat rate in joules/terahash by bitcoin mining rig.
Translating this data into an average yearly heat rate (chart below) shows a similar steep decline during the entire history of bitcoin mining. CPU, GPU and FPGA benchmarks along with published OEM power usage data was used to estimate 2009 to 2012 network average heat rate. ASIC miners announced in 2020 were visualized above and below to show the continued decrease in hash heat rate, but they were discarded from the energy estimations as they are not yet publicly available.
Bitcoin mining equipment average yearly heat rate, the inverse of efficiency (j/Th)
So, now that we have compiled all of the necessary data (yearly hashes and yearly hash heat rate), let’s combine them via an engineer’s attempt at bitcoin mining energy stoichiometry:
Energy Per Year (Joules/Year) → (kWh/Year) → (TWh/Year)
Simply multiply the yearly work completed (terahash/year) by the yearly estimated heat rate (in joules/terahash) for miners on the system and you arrive at a joules/year estimation. We will convert from joules/year to kWh/year (a kWh is equal to 3.6 megajoules) and below those yearly energy estimates are charted.
Yearly estimates For Bitcoin network energy consumption, in kWh
However, this physics-based estimation method also has some issues:
The quantity of active miners by level of efficiency isn’t known, and this physics-based model assumes equal participation from all miner models available on the market by year released.
This model also uses a step function for yearly heat rate data as in input. That yearly data abruptly changes at the first of each year, a gradual heat rate decline would be more realistic as older miners steadily retire and new ones fire up.
It assumes old miners retire after a year, which is also unlikely as equipment life cycles are now ranging for two or more years.
This is likely to be a lower-bound type of estimation.
Comparing Different Network Energy Estimations
Where do these yearly energy consumption estimates fall among the previously-cited calculation attempts? Interestingly enough, both of our calculations, even using drastically different methodologies and with all of the shortcomings discussed above — the economic-based estimation (35.3 TWh) and the physics-based estimation (40.17 TWh) — are very similar in value. They also fall within the range of a variety of other popular estimations from noteworthy individuals, entities and institutions shown in the chart below. That all of these estimations are fairly similar in magnitude lends credibility to the various different estimators as well as the wide variety of methodologies and different assumptions used.
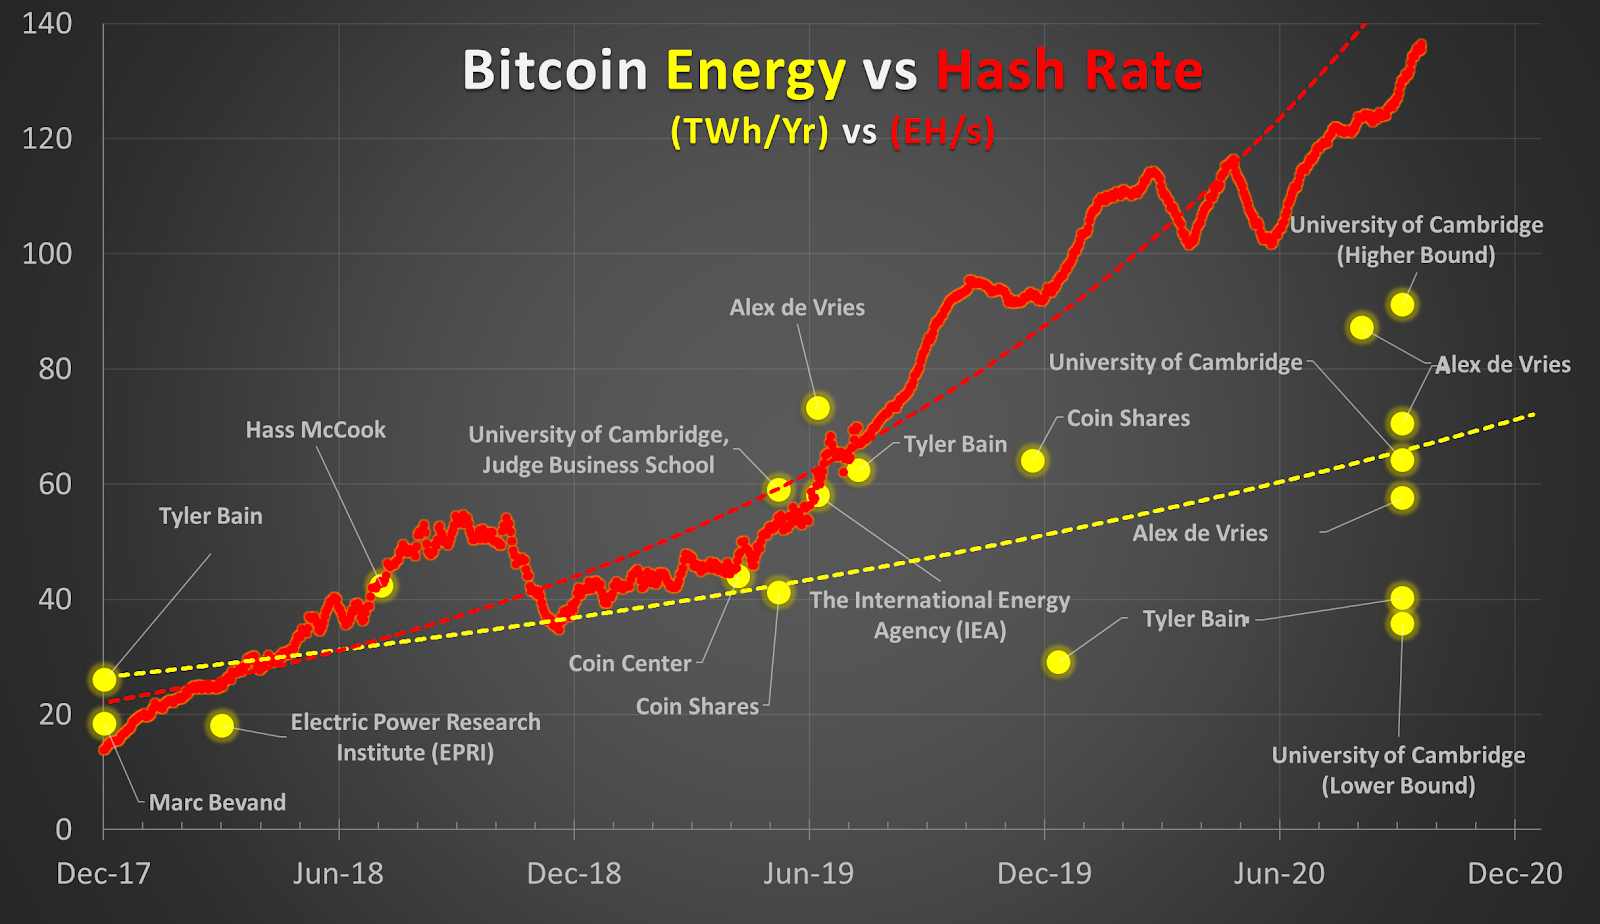
Noteworthy below: it appears that the Bitcoin network hash rate (EH/s) is beginning to decouple from the general yearly energy (TWh/year) estimation trend. This may be due to the decreasing heat rate of SHA-256 ASIC mining equipment if the estimate is physics based, or due to the halving and price stagnation if the estimate is economics based.
Bitcoin network hash rate (EH/s) and yearly electrical energy (TWh/year) estimates from various sources
This chart above shows yearly energy estimation snapshots at time of publishing in TWh/year, but a few of these sources (University of Cambridge [C-BECI] and Alex de Vries [D-BECI]) actually publish these yearly estimates on a daily graph going back a few years. This gets back to the previous energy vs. power discussion: logic should prevent plotting yearly energy estimations on a daily axis.
Regardless, I thought it would be worth comparing these published estimates with our above calculations using more continuous time series data going back to late 2017 (the previous market all-time high). The economic and physics calculations, the Cambridge estimates, as well as Digiconomist‘s results are all fairly similar in magnitude over time, again adding some peer review and validity to these different estimation techniques.
A yearly energy estimation comparison (TWh/year)
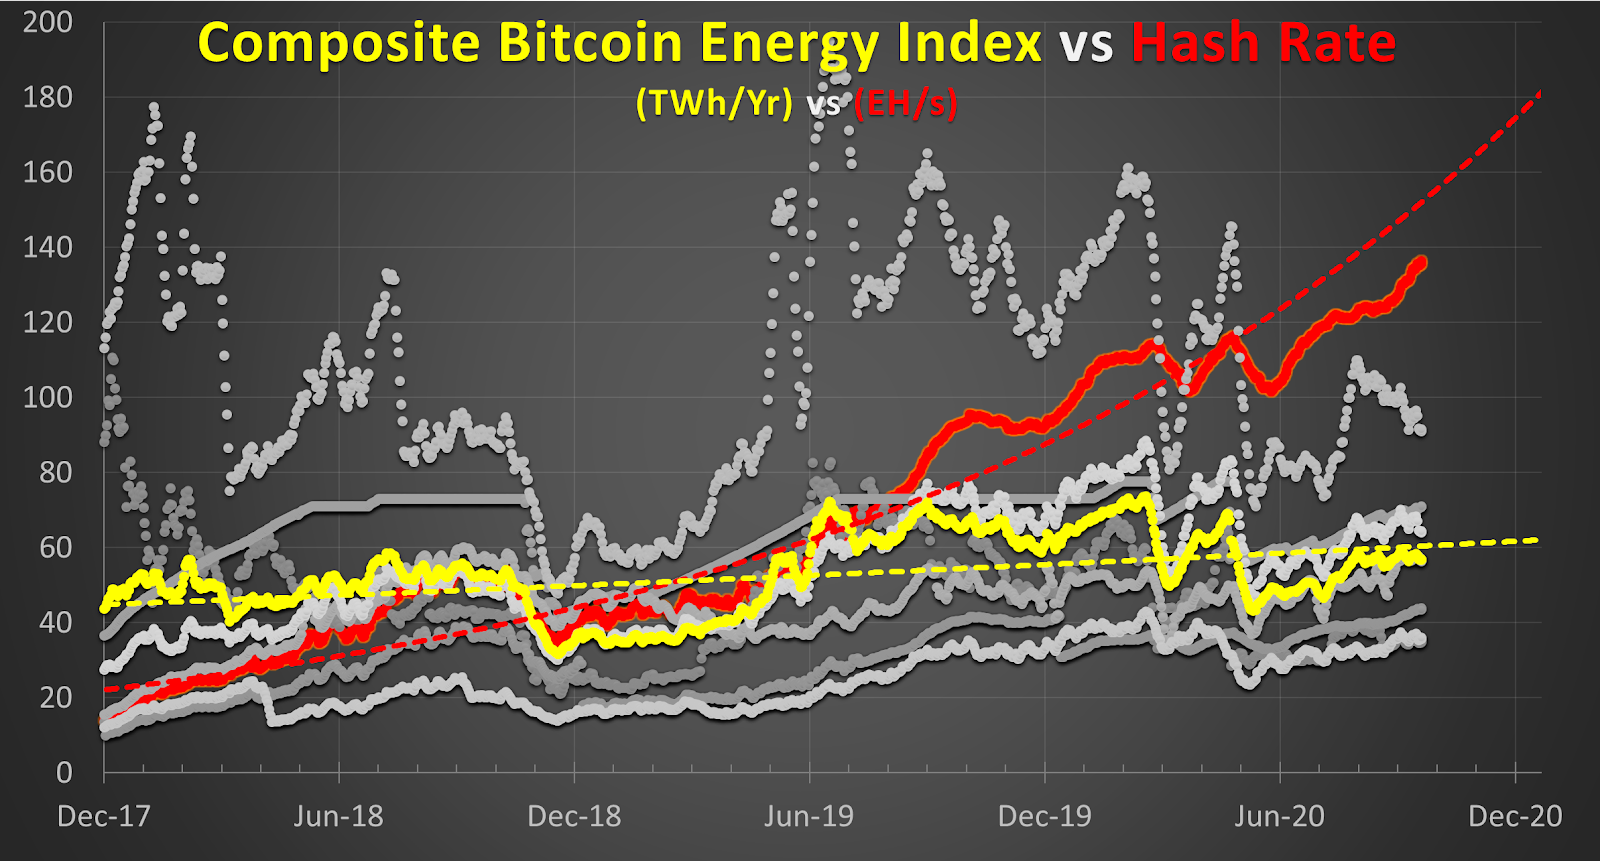
Our above estimation methodologies appear to align nicely with the other various daily interval yearly energy estimates, so they were averaged together to create a sort of Composite Bitcoin Energy Index (CBEI) as shown below in TWh/year. Each of these estimations have different assumptions, varying levels and sources of inaccuracy, and thus their composite may be more accurate. This composite of estimations (CBEI) has just recently retested the 60 TWh threshold for total yearly Bitcoin network energy consumption.
A yearly energy estimation average, Composite Bitcoin Energy Index (CBEI)
How does this composite energy index compare to Bitcoin network hash rate over time? The CBEI shows a similar decoupling as hash rate and energy around early 2019 with hash rate continuing to rise and energy consumption staying relatively steady as ASIC heat rates and bitcoin mining incentives have shrunk.
Interestingly, snapshot bitcoin consumption estimations are commonly extrapolated for an entire year, expressed as an energy value in TWh/Year without supporting time data or evidence. Daily network power estimations would be much preferred to all of these yearly energy consumption estimates plotted on a daily chart. The chart crime in this case is the egregious graphical error that makes folks massively misinterpret the data: yearly energy estimates graphed on a daily axis. So, I took the liberty of converting these daily interval estimates into a daily power estimation chart to correct for these above chart errors that force data misinterpretations.
I present the Composite Bitcoin Power Index (CBPI) compiled from the D-BECI and Minimum, the C-BECI Maximum, Minimum and Estimated, as well as our above economics- and physics-based estimates.
This CBPI composite estimates for Bitcoin’s instantaneous electrical usage as expressed in watts, the unit of electrical power. The CBPI peaked recently at nearly 7.58 GW, or about 6 DeLorean time machines at 1.21 Gigawatts (or should I say jigawatts?).
CBPI In Context
Energy values that large are difficult to digest, especially in a yearly context, so let’s put these estimations in perspective with some quick comparisons:
650 TWh/year consumed by the banking system
200 TWh/year used in gold mining
75 TWh/year used on PC and console gaming
60 TWh/year on bitcoin mining (CBEI)
11 TWh/year used on paper currency and coin minting
7 TWh/year used on Christmas lights in the U.S.
A comparison of our index to other popular energy usage estimates.
Based on our estimations above, the Bitcoin network consumes roughly 40 to 60 TWh/Year or around 0.15 percent of global yearly electricity generation (26,700 TWh) and only about 0.024 percent of global total energy production (14,421,151 ktoe). (A ktoe is also a unit of energy: a kiloton of oil equivalent, 11.36 MWh.)
So, Bitcoin energy consumption today is only a very tiny portion of what many consider to be a significant civilization-level problem: ever-increasing human energy consumption. Check out interesting solutions to this problem outlined a century ago by Nikola Tesla. As recently as September 2020, a study claimed that nearly 76 percent of the Bitcoin network is powered by clean energy sources. Also, remember that once Einstein discovered mass-energy equivalence and humanity harnessed the energy embedded in the atom, energy for the advancement of mankind has become materially abundant.
This is a guest post by Tyler Bain. Opinions expressed are entirely his own and do not necessarily reflect those of BTC Inc or Bitcoin Magazine.
The post Introducing CBEI: A New Way To Measure Bitcoin Network Electrical Consumption appeared first on Bitcoin Magazine.
Bitcoin is a young, fresh technology with incredible potential — and we haven’t even touched the surface of possibilities.Watch This Episode On YouTubeListen To This Episode:BitcoinTVAppleSpotifyGoogleLibsynOvercastAudibleRumbleI can’t help but take pride in the Bitcoin community’s relentless optimism. In many other industries, whether it be through the direct decline of the industry, or a sense of general…
Calling bitcoin miners bitcoin validators will improve the public's perception on Proof of Work (PoW) and prevent the framing effect from occurring.This is an opinion editorial by Doc Sharp, a bitcoin product designer currently funded by Spiral to contribute to various bitcoin FOSS projects.It's not a stretch of truth to anyone who's been around the…
Follow Nikolaus On 𝕏 Here For Daily Posts When Bitcoin was first launched by Satoshi Nakamoto, there was no price. It was literally worth $0. The price of bitcoin first broke over $100 in April of 2013 and was captured on film as it rose to an all time high of $111. Later that year
Global payment processing platform PayPal has been awarded a patent for a technique that can help with the timely detection and reduction of ransomware attacks. Ransomware attacks are a form of malware that takes over the victim's computer, locks up the files therein and demands a ransom before the files can be accessed again —…
Users of South African exchange Africrypt are missing $2.3 billion in bitcoin after the founders have disappeared.The founders of South African cryptocurrency exchange Africrypt, two brothers named Ameer and Raees Cajee, have reportedly vanished, as has more than $2.3 billion in bitcoin belonging to clients.“A Cape Town law firm hired by investors say they can’t…
The drop in bitcoin price means mining rigs are on sale and prospective buyers may see big discounts before the summer ends.One reason why miners often pay close attention to bitcoin’s price is because mining machines have a strong positive correlation to its fluctuations. And as bitcoin’s dollar-denominated value has dropped precipitously this month, mining…
Bitcoiners want to help other people adopt bitcoin. There are many methods to do this, but in-person conversations work best. How many people can you onboard?This is an opinion editorial by Mark Maraia, an entrepreneur, author of “Rainmaking Made Simple” and a Bitcoiner.The bitcoin price is not the main driver of the meeting of the…
Bitcoin Core version 25.0 has been released, bringing new features, bug fixes and performance improvements to the software. Users can download the latest version from the official Bitcoin Core website or update their existing installations. The release notes outline the changes and provide instructions on how to upgrade.One notable change is the allowance of transactions…
Leading cryptocurrency data provider CoinMarketCap has announced that 70.3 percent of the exchanges listed on its platform have complied with its mandatory exchange data requests aimed at boosting transparency in trade volume reporting. 95 percent of the trade volumes reported by CoinMarketCap were fake according to a report released in April 2019 by Bitwise Asset Management. It…