If You Invested $1 Daily In Bitcoin For 9 Years, You Would Have $18M
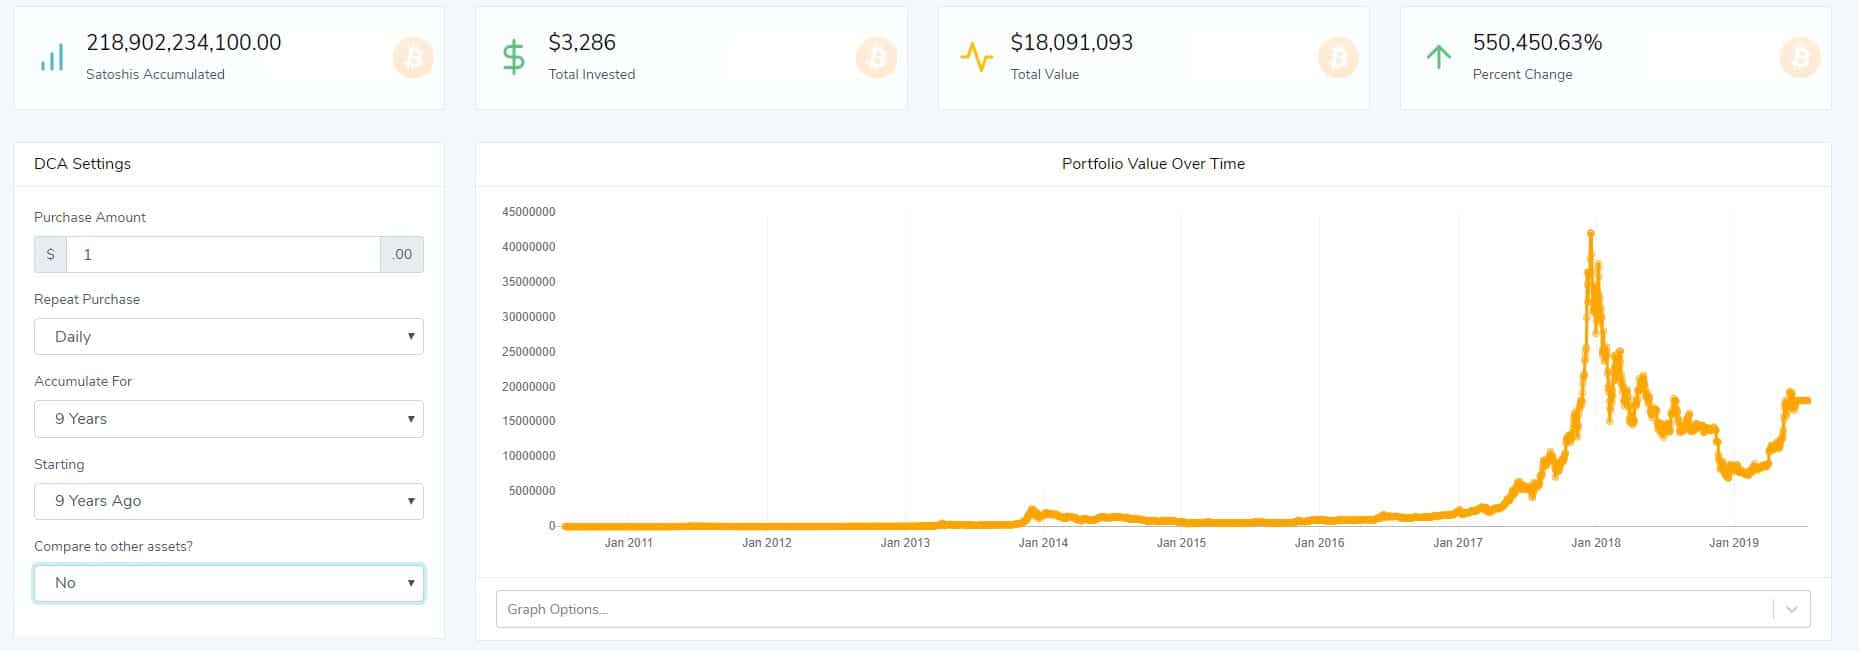
The dollar-cost averaging investment strategy seems to be one that has turned out to be particularly profitable when it comes to Bitcoin. Apparently, if you have been investing as little as $1 in BTC over the past 9 years, you would have received a return upwards of $18 million. That’s more than 550,000% return on your investment.
DCA Investing Pays Off With Bitcoin
From day trading to long-term holding, there are plenty of different strategies that people use to participate in the cryptocurrency market. However, as it turns out, one of the particularly stable and profitable ones has turned out to be the dollar-cost averaging investment strategy.
This is a strategy which requires you to divide the purchase amount equally into small portions and buy Bitcoin at consistent intervals. A simple example would be to buy $1 worth of BTC every day, or every week, over a certain amount of time.
While $1 per day might sound like nothing, it’s important to remember that this is not a get-rich-quick type of investment scheme but rather a longer-term play. And, so far, it has proven to be particularly profitable.
If you had started buying $1 worth of Bitcoin on this day 9 years ago, you would have made a return of 550,450.63%. You would have invested a total of $3,286 and you would have made $18,091,093.

Of course, many would argue that the price of Bitcoin back then was particularly cheap because hardly anyone knew about it. So let’s have a look at a shorter time span.
Investing $1 per day starting 5 years ago would have made you $22,850 with an investment of as little as $1,826. That’s an ROI of 1,151.38%
If you started doing this 3 years ago, you would have made a total of $4,406 with an investment of $1,095, giving you an ROI of 302.43%.
Going even further, if you started using the DCA strategy with $1 per day one year ago, you would have made $580 with an investment of $365. That’s an ROI of 58.93%.
While it may not sound like a lot of money, keep in mind that we’re talking of an investment as little as $1 per day. What’s important is the overall ROI. 58.93 return on your investment for a time frame as short as one year is a massive yield. It’s also worth noting that this doesn’t require absolutely any prior investment knowledge – all you have to do is put up a certain amount of money into BTC on predetermined intervals.
What About Other Assets?
Bitcoin is oftentimes compared to gold. In fact, just a few days ago, the Chairman of the US Federal Reserve, Jerome Powell, said that “Bitcoin is a store of value… like gold.”
As such, it makes sense to take a closer look at what the DCA investment strategy would have earned if you chose to invest in gold instead. Again, let’s look at the same time frames.
If you spent 9 years investing $1 in Gold every single day, you would have invested a total of $3,286 and you would have made $3,341. That’s a return of 1.68%. For 5 five years, that return would have been 9.22%, for three years – 6.41%, and for one year – 6.93%. Obviously, these numbers are not even close to what investing in Bitcoin would have earned you.
Of course, it’s also important to note that the DCA strategy has its setbacks. For instance, the profit is not maximized in a bullish market. Also, it could be challenging to discipline yourself to buy a fixed amount of BTC, especially if the price is low and you feel tempted to buy more, or vice versa.
The post If You Invested $1 Daily In Bitcoin For 9 Years, You Would Have $18M appeared first on CryptoPotato.


