How Will The SEC Fiasco Impact Bitcoin and What’s Next? (BTC Price Analysis)
The price of Bitcoin is currently on a downward trajectory since it faced resistance at $30K in April. However, there are notable support levels that may prevent further decline.
Technical Analysis
By: Edris
The Daily Chart:
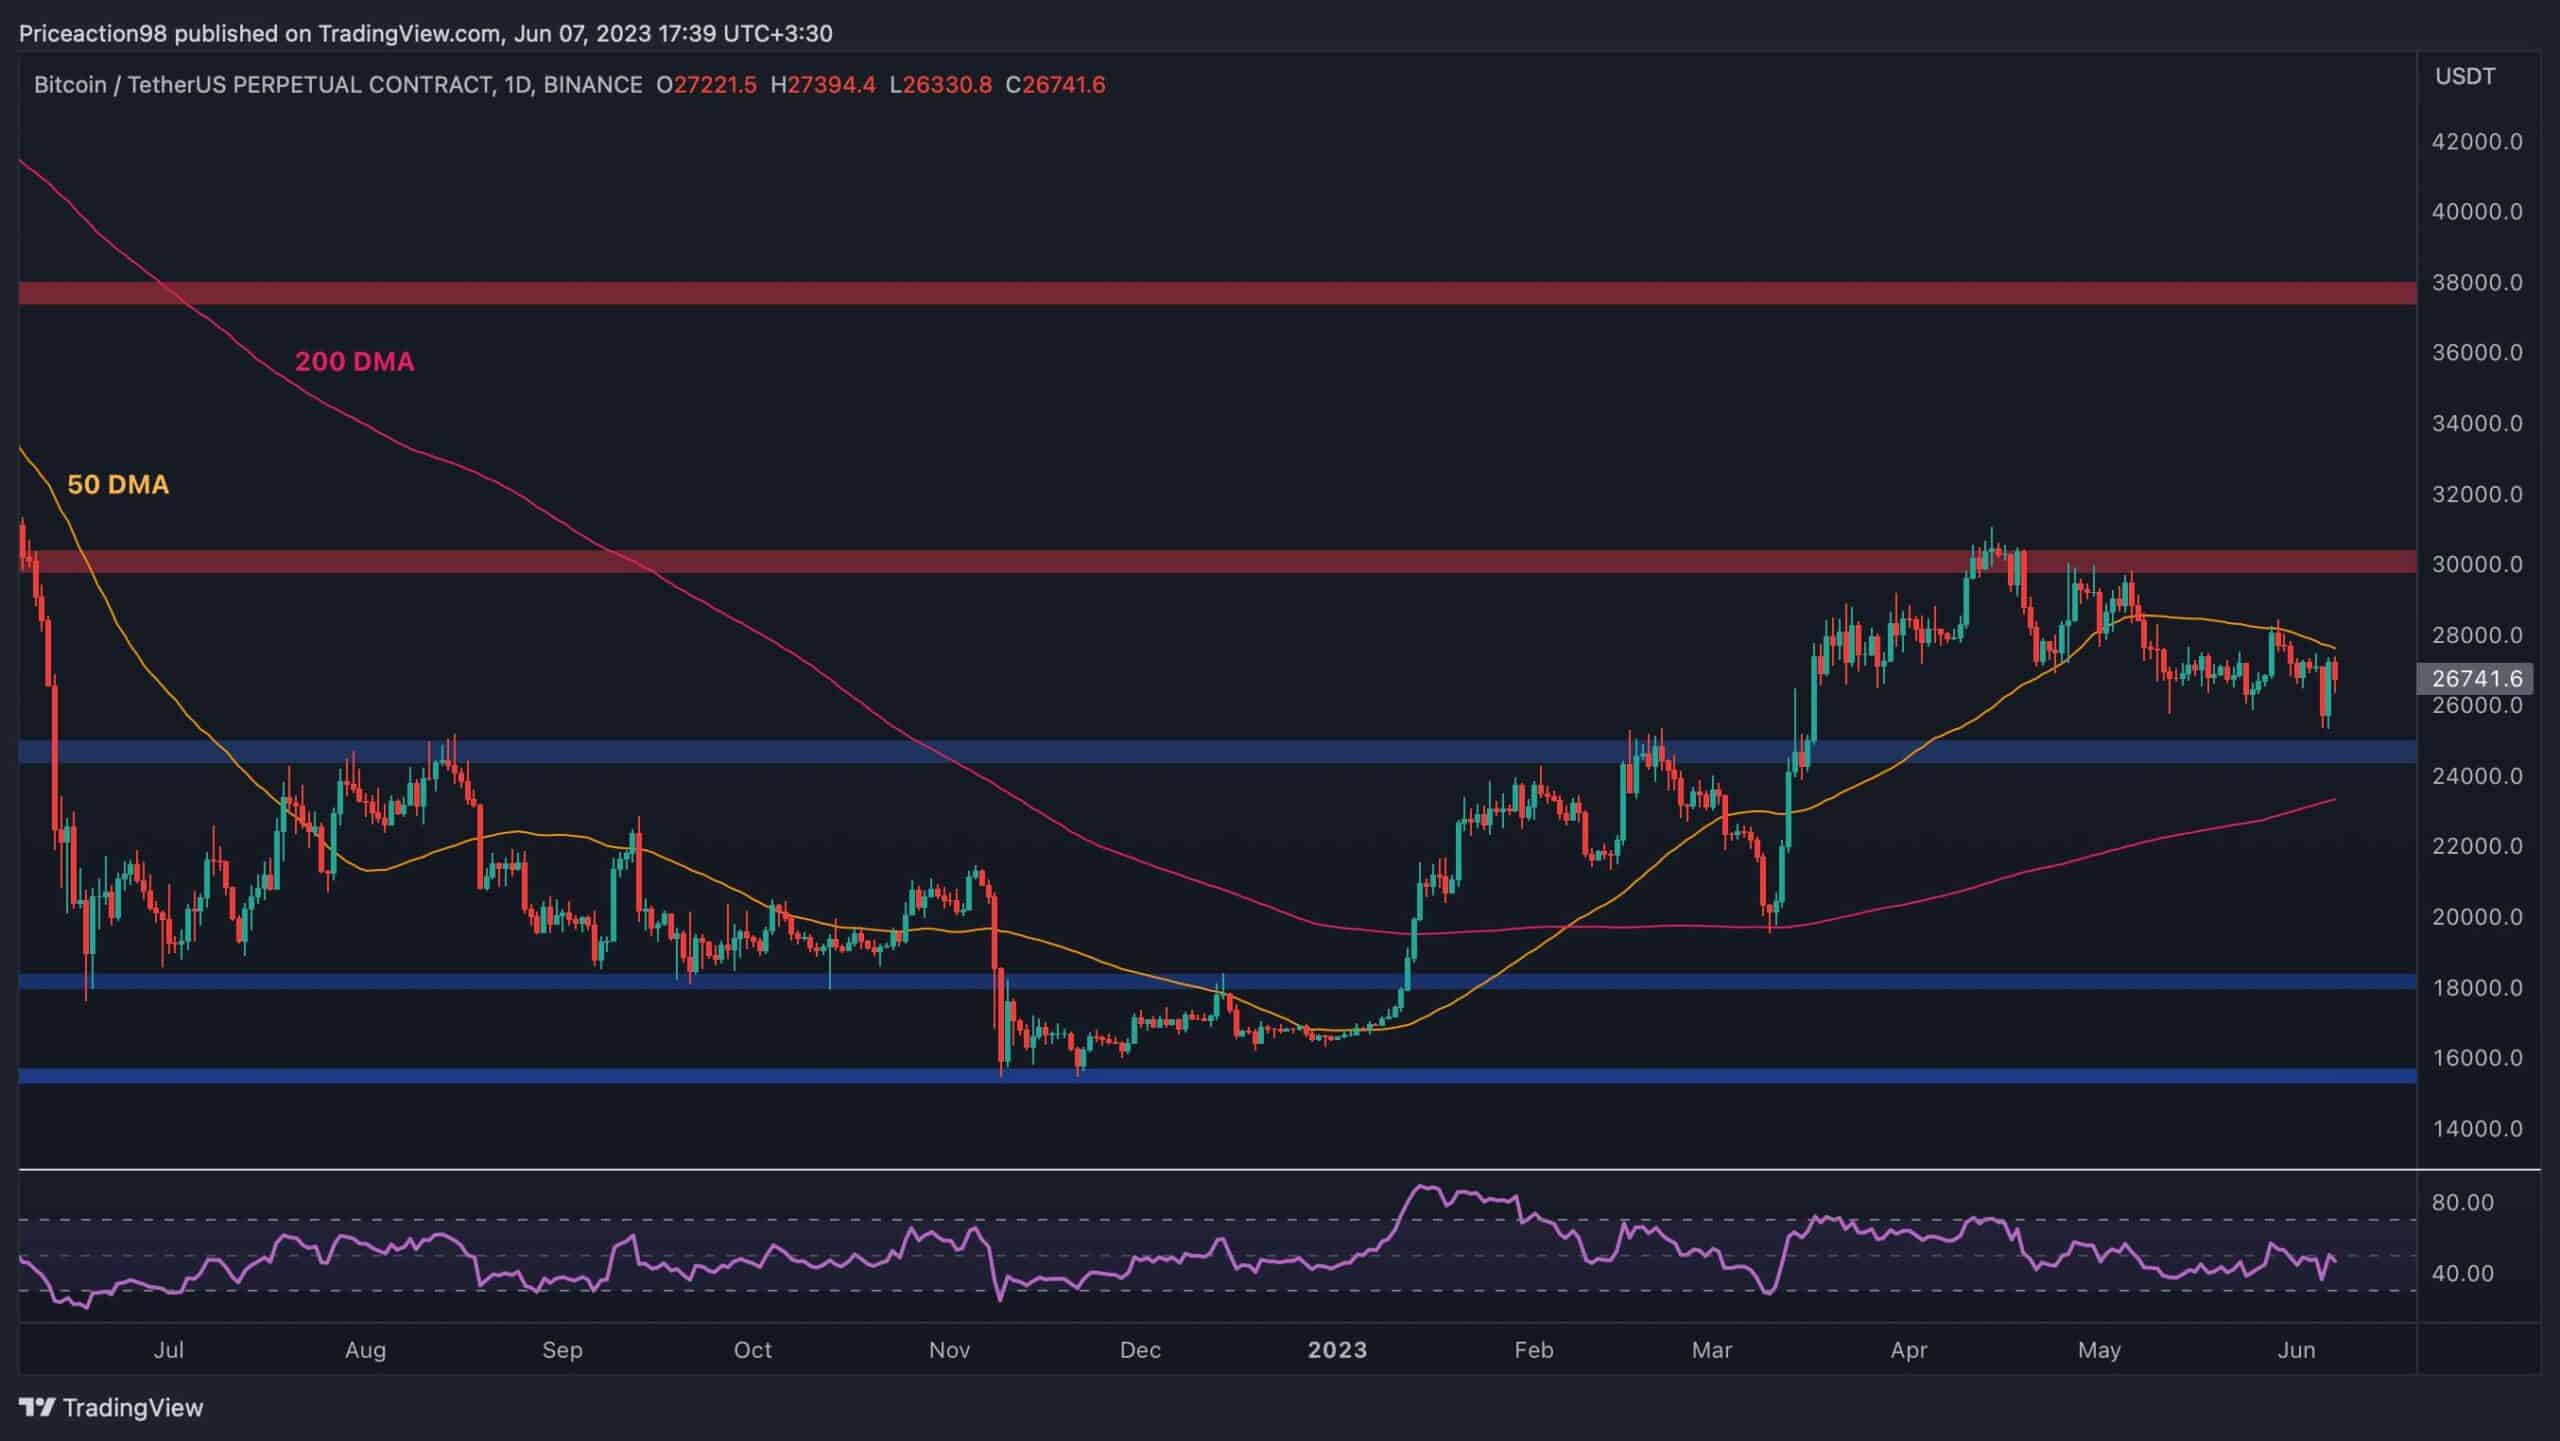
On the daily timeframe, the Bitcoin price has consistently formed lower highs and lows in the past couple of months. The 50-day moving average acted as a strong resistance, causing a downward rejection near the $28K level.
Following yesterday’s rebound, the price is testing the 50-day moving average again. A bullish breakout would result in a rally towards the $30K level, while another rejection would lead to a drop-down to the $25K support level and the key 200-day moving average located around the $24K mark.
The 4-Hour Chart:
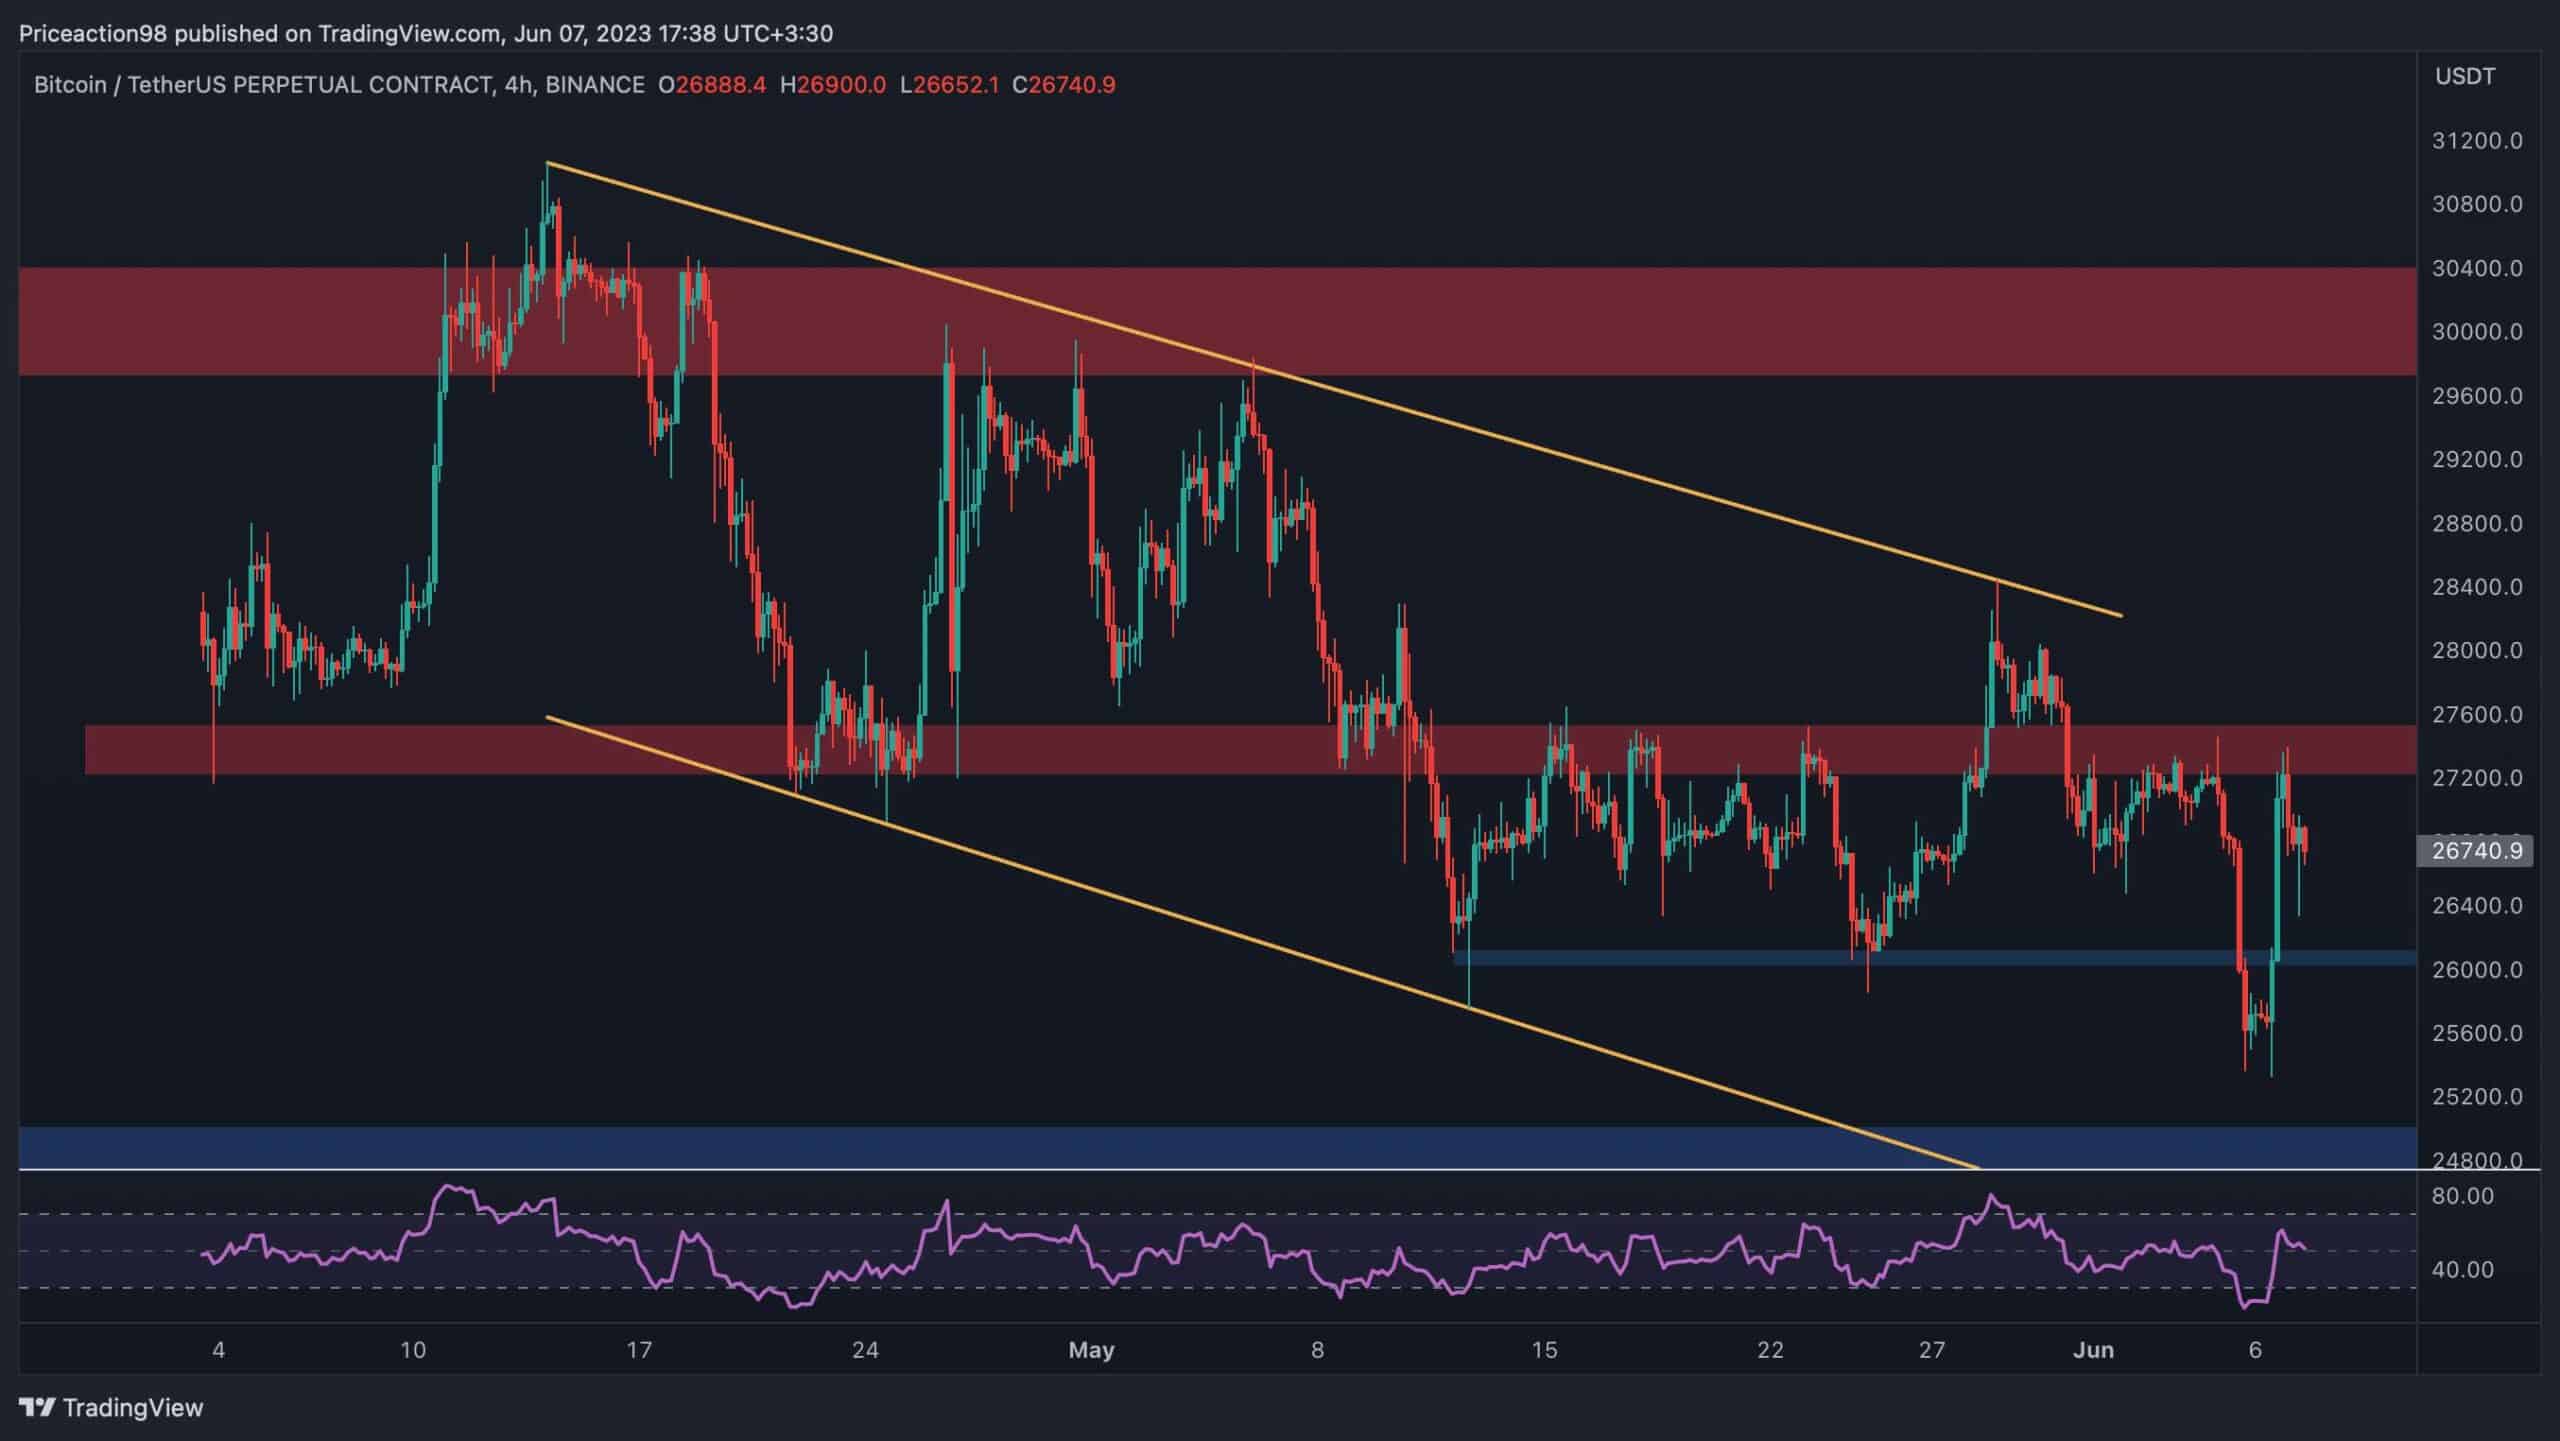
Looking at the 4-hour timeframe, it is clear that the Bitcoin price faced a significant barrier at the $27,500 resistance level and experienced a sharp decline thereafter. The short-term support level at $26K has also been breached, indicating a continued downward movement with strong momentum.
However, the BTC price has now reversed following the RSI’s overbought signal and is currently retesting the $27,500 resistance area. If it breaks above this point, the descending channel is likely to be broken as well, paving the way for the market to rise toward the $30K level once again.
On-chain Analysis
By Shayan
While many were optimistic about the beginning of a bull market, a wave of fear and uncertainty spread through the industry because of what happened lately. On Monday, the Securities and Exchange Commission (SEC) filed a lawsuit against Binance, leading to a 5% drop in the price of Bitcoin. The next day, it field a lawsuit against Coinbase as well.
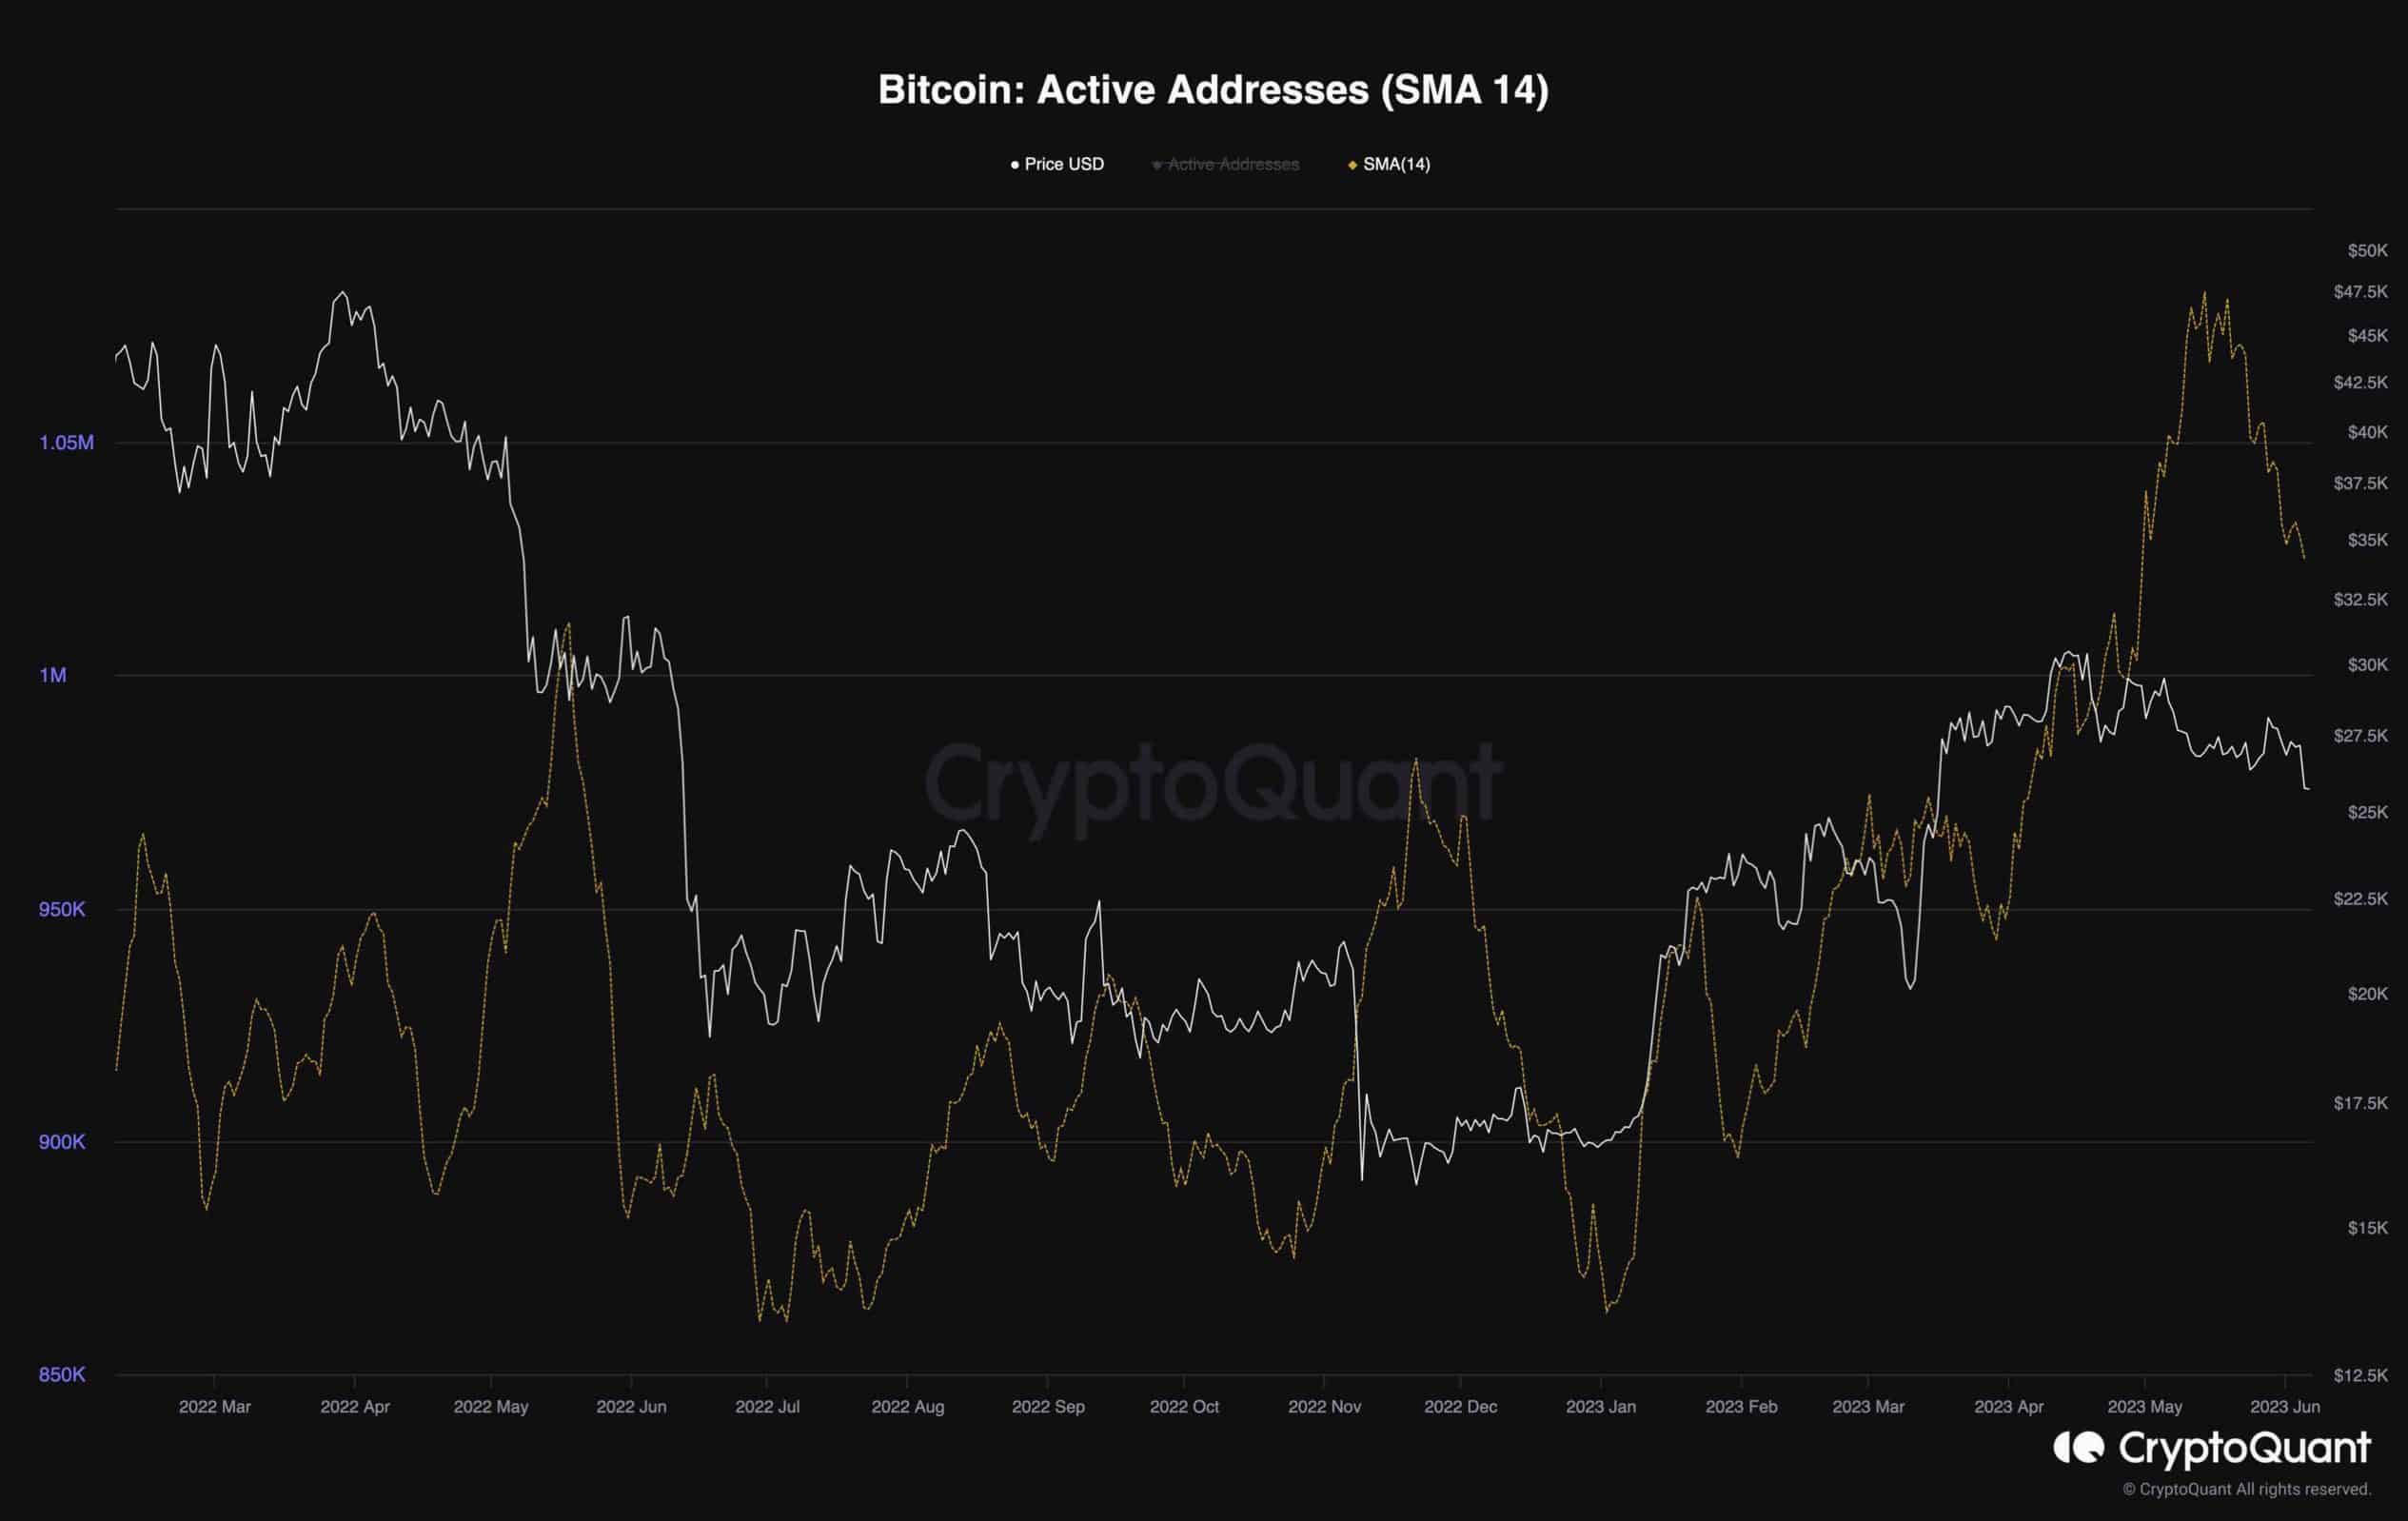
A graph representing the Active Addresses metric, which indicates the number of participants actively engaging with Bitcoin’s network alongside the price, provides valuable insights. The chart demonstrates an upward trend, signaling a positive outlook for network activity and the demand for Bitcoin.
Unfortunately, this trend has recently reversed, and the metric is now experiencing a significant decline, primarily attributed to the recent FUD.
The post How Will The SEC Fiasco Impact Bitcoin and What’s Next? (BTC Price Analysis) appeared first on CryptoPotato.