How To Identify Bitcoin Price Bottoms
Looking at the metrics that help us determine bitcoin price bottoms.
The below is from a recent edition of the Deep Dive, Bitcoin Magazine’s premium markets newsletter. To be among the first to receive these insights and other on-chain bitcoin market analysis straight to your inbox, subscribe now.
In today’s Daily Dive we will dig into a new metric for timing bitcoin bottoms. This metric will use the realized price of two separate cohorts of bitcoin investors; long-term holders and short-term holders.
First, before digging into the metric, let’s define some of the terms:
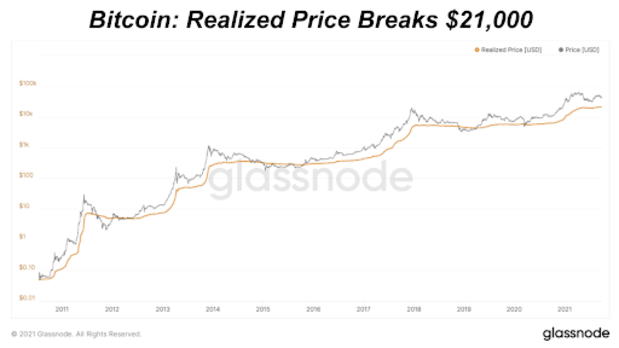
Realized Price: Realized price is the average price that every coin (technically: UTXO) was moved on the network. For some, realized market capitalization is an easier metric to understand. Realized market capitalization, which is nearly an identical metric as realized price, takes the aggregate of every bitcoin on the network at the price it last moved. Realized price is currently $21,100, while realized capitalization is $397.4 billion. Realized price can otherwise be thought of as the cost basis for everyone across the network on average.

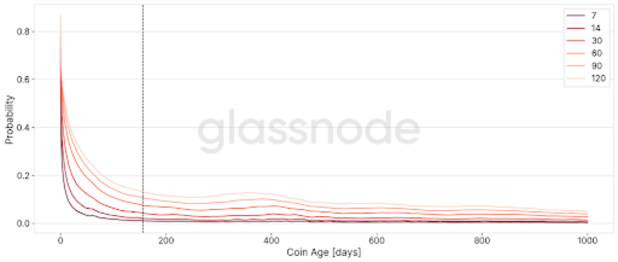
Long-Term Holder: A long-term holder is defined as someone whose bitcoin has not moved wallet addresses in 155 days. While 155 days may seem like somewhat of an arbitrary threshold, the time was chosen because the statistical probability of a UTXO being spent decreases the longer it is held. The chart below shows the probability that a UTXO is spent within the specified time in days as a function of its coin age.

With long-term holders defined, anyone whose coin has been dormant for less than 155 days is classified as a short-term holder.
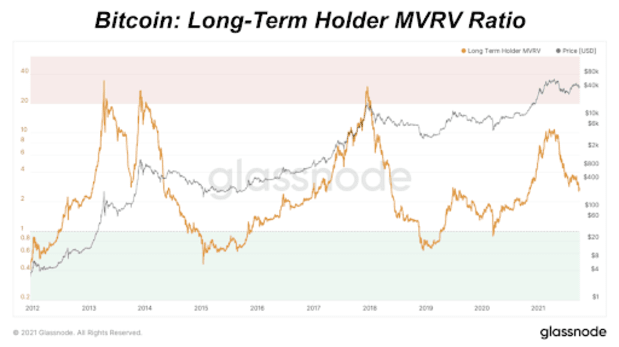
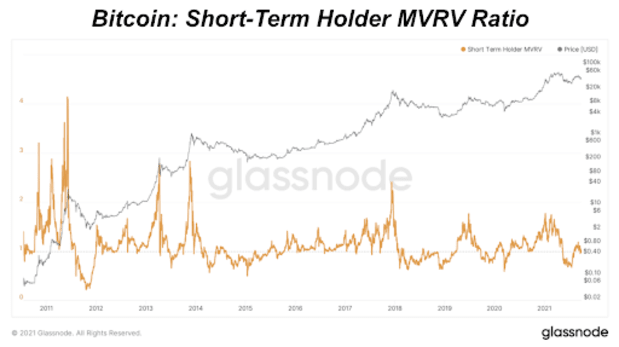
Using Glassnode’s suite of data, we can construct a realized price for both long and short-term holders. While Glassnode does not provide the realized price for these two groups of investors, it is easily calculated using data that is provided. Using the market-value-to-realized-value ratio (MVRV) for the two seperate groups, you simply divide price by the MVRV ratio of the two groups to backwards-calculate the realized price.
Below is the history of MVRV for long-term holders (LTHs) and short-term holders (STHs):
*Note that LTH MVRV is in log scale, while STH MVRV is in linear scale.*
Calculating LTH And STH Realized Price


So, how can the realized price rice of LTHs and STHs help us to identify bitcoin bottoms, and *potentially* help to identify bitcoin tops? Let’s dive in.


