How Solana is Thriving Despite FTX/Alameda-Induced Challenges: Report
A Nansen analyst recently published a report diving deep into the Solana ecosystem, exploring the on-chain data, network developments, and other findings.
As per the findings, amidst challenges like network halts and the FTX/Alameda saga, the Solana blockchain shows significant resilience and continuous improvements, achieving a 100% uptime year-to-date.
Solana’s Performance Till Date
The report shared via an X thread by Nansen on Oct. 5 began by highlighting the current TVL of Solana, which stands at $30.95 million, nearly double the numbers from earlier in the year.
Solana: Past, Present and Future
We’re excited to publish our comprehensive deep dive into the @solana ecosystem. @sandraaleow covers ecosystem catalysts, risks, and highlights, explores the onchain data, network development, and much more
Here are the key findings…
— Nansen
(@nansen_ai) October 5, 2023
The monthly transactions associated with Solana have remained quite stable, while vote transactions have greatly surged. As per Nansen, this increasing transaction and TVL demonstrate its potential for active economic activity.
Sandra, the Nansen analyst, also mentioned a couple of solutions by Solana. For instance, its fee markets and state compressions have addressed major issues in its technology stack.
The state compression reduced the cost of NFT minting by more than 2,000 times. Before this state compression, minting a million NFTs on the Solana network would cost the creator about $253,000. The compression led to a dramatic drop in the cost to merely $113.
The Nansen analyst compared Solana with minting a million NFTs on Ethereum or Polygon, which can cost over $33.6 million and $32.8k, respectively.
The rapid expansion of liquid staking within the Solana network, led by Marinade Finance, Lido Finance, and Jito_sol, was prominently emphasized in the discussion. Nevertheless, despite the substantial growth in Solana’s liquid staking protocols, the report acknowledges that there is still significant potential for further expansion, as only approximately 3% of staked SOL is currently allocated to these protocols.
Furthermore, the analysts mentioned a growing interest in enterprise adoption and payment rails following Visa’s integration of USDC settlement on the Solana blockchain. The Visa USDC integration mainly aimed to bring faster finality and high throughput at virtually negligible costs to users.
One of the tweets also mentioned potential growth factors, saying,
“Other potential tailwinds for Solana include increased enterprise adoption, success in implementing the Firedancer vision, and growing consumer-facing applications leveraging Solana’s advantages.”
The report also notes that Solana has been gaining the attention of consumer-facing apps. It praised Solana’s tech feats, potential partnerships, and infrastructure apps, all indicative of its promise.
Potential Challenges on the Horizon
After highlighting some of these positives of Solana, the report noted that there are still challenges, including the uncertainty of FTX/Alameda’s SOL holdings. Negative news on these holdings will be a temporary barrier to the growth of SOL.
Still, about 71.8 million SOL, equal to $1.16 billion, is locked on FTX – about 17% of SOL’s circulating supply and 13% of its total supply. These SOL tokens’ outcome and eventual release will potentially impact the token’s future.
As per recent reports, around 9.1 million SOL belonging to Alameda Research were unstaked, causing the current price plunges.
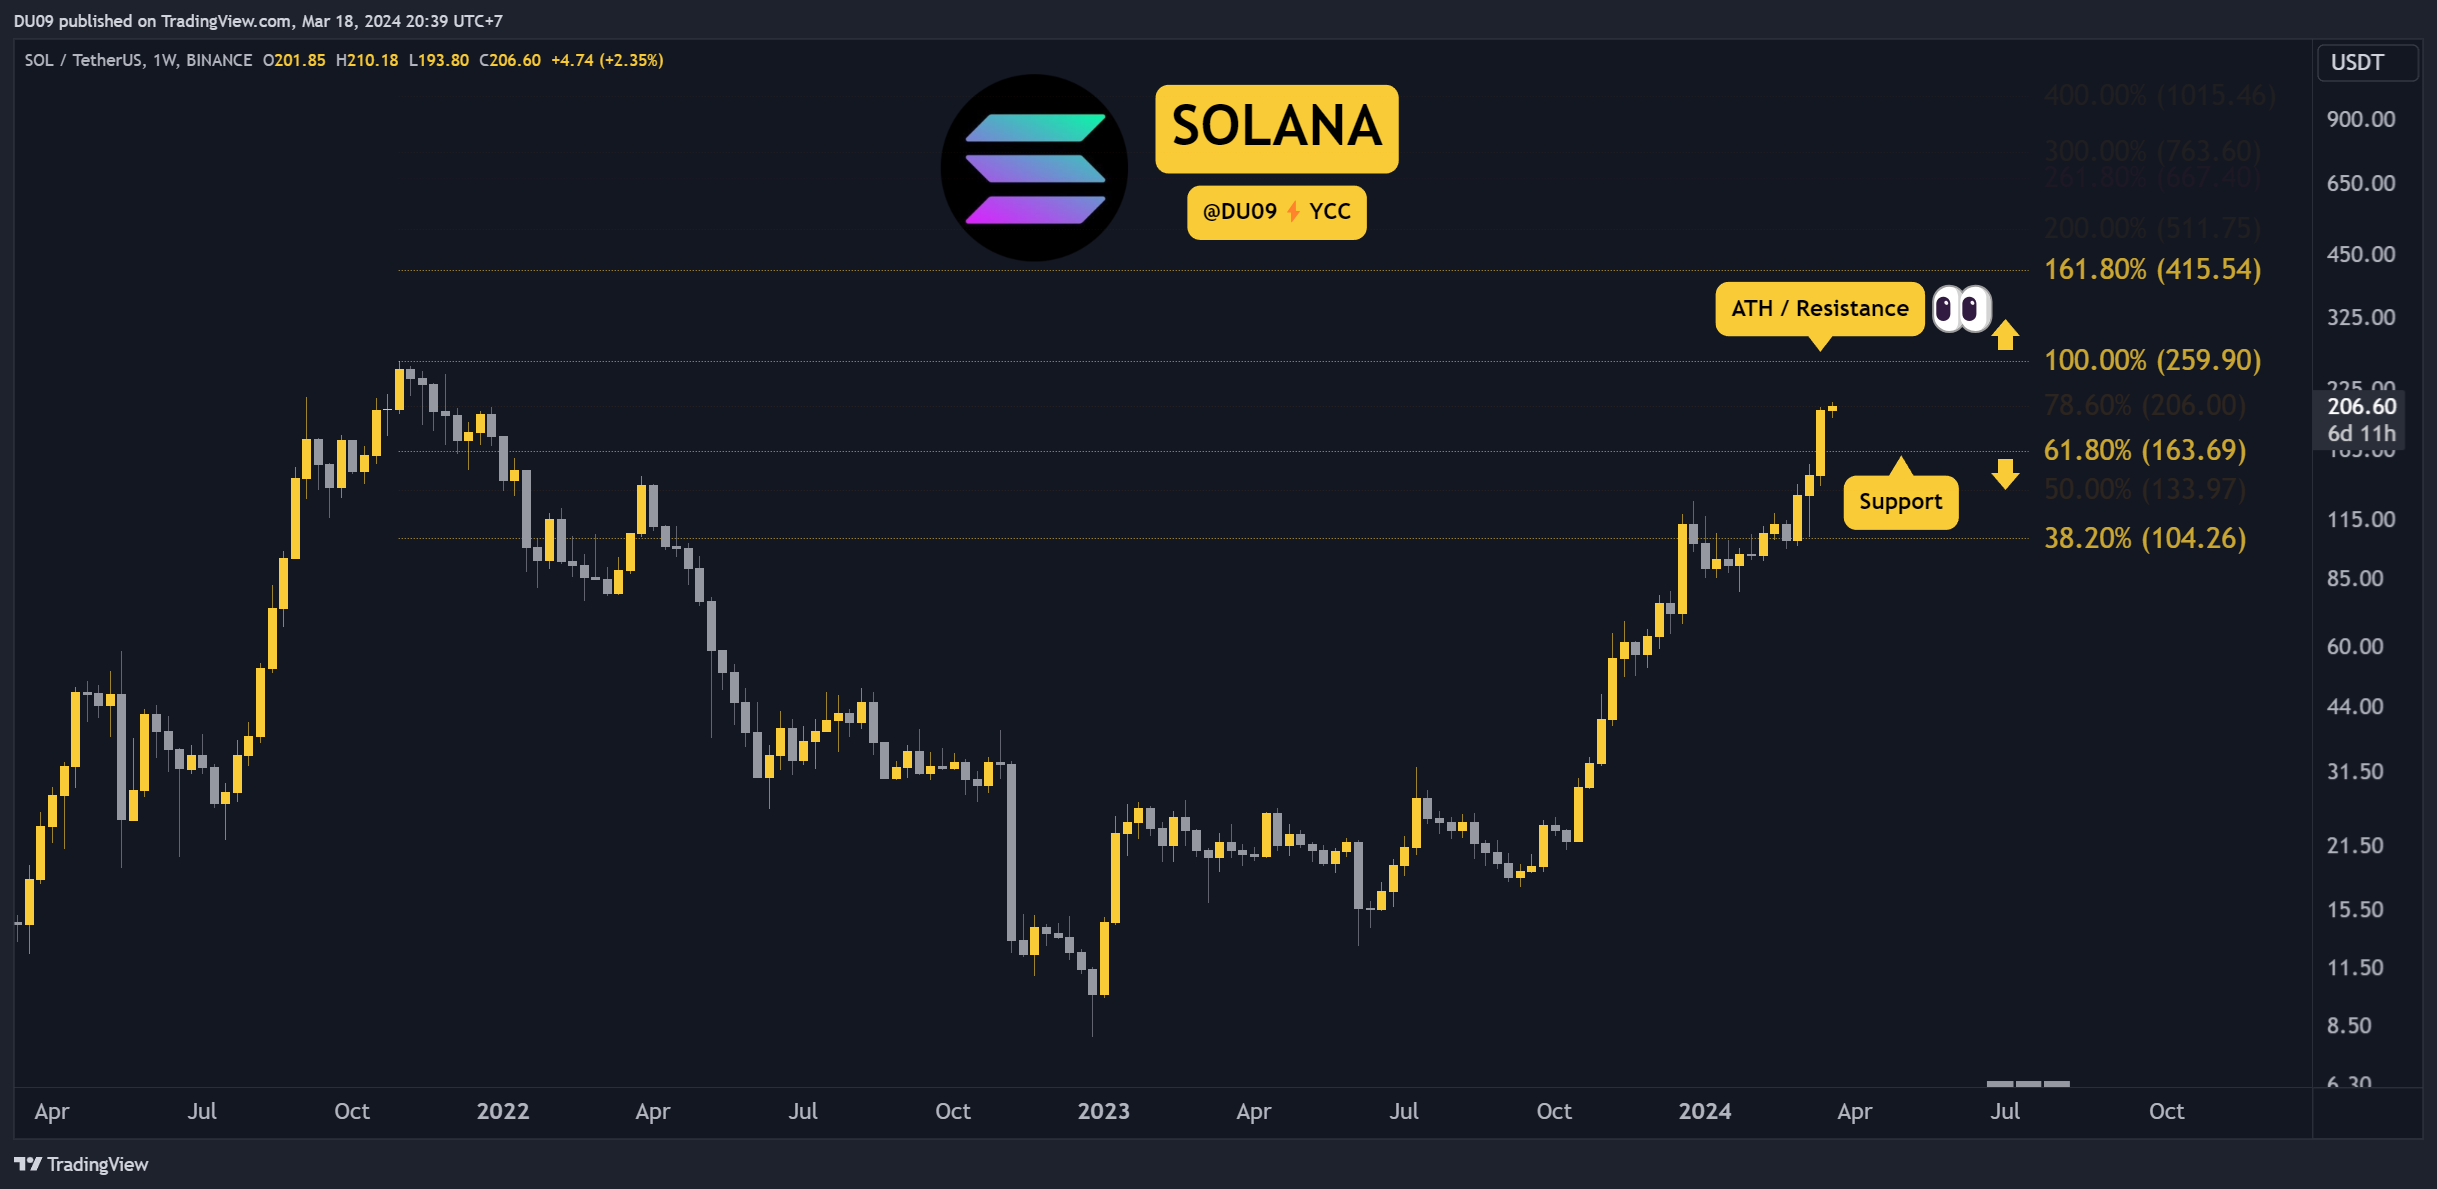
Solana’s price action was also possibly another challenge, with the assets trading in the red for the entire year. However, a look at the price since January suggests that SOL began the year trading at around $10 and currently sits above $20.
The post How Solana is Thriving Despite FTX/Alameda-Induced Challenges: Report appeared first on CryptoPotato.

