How Low Will XRP Crash if $0.5 Fails? (Ripple Price Analysis)
Ripple’s recent downtrend has persisted, resulting in the price falling below both the 100 and 200-day moving averages.
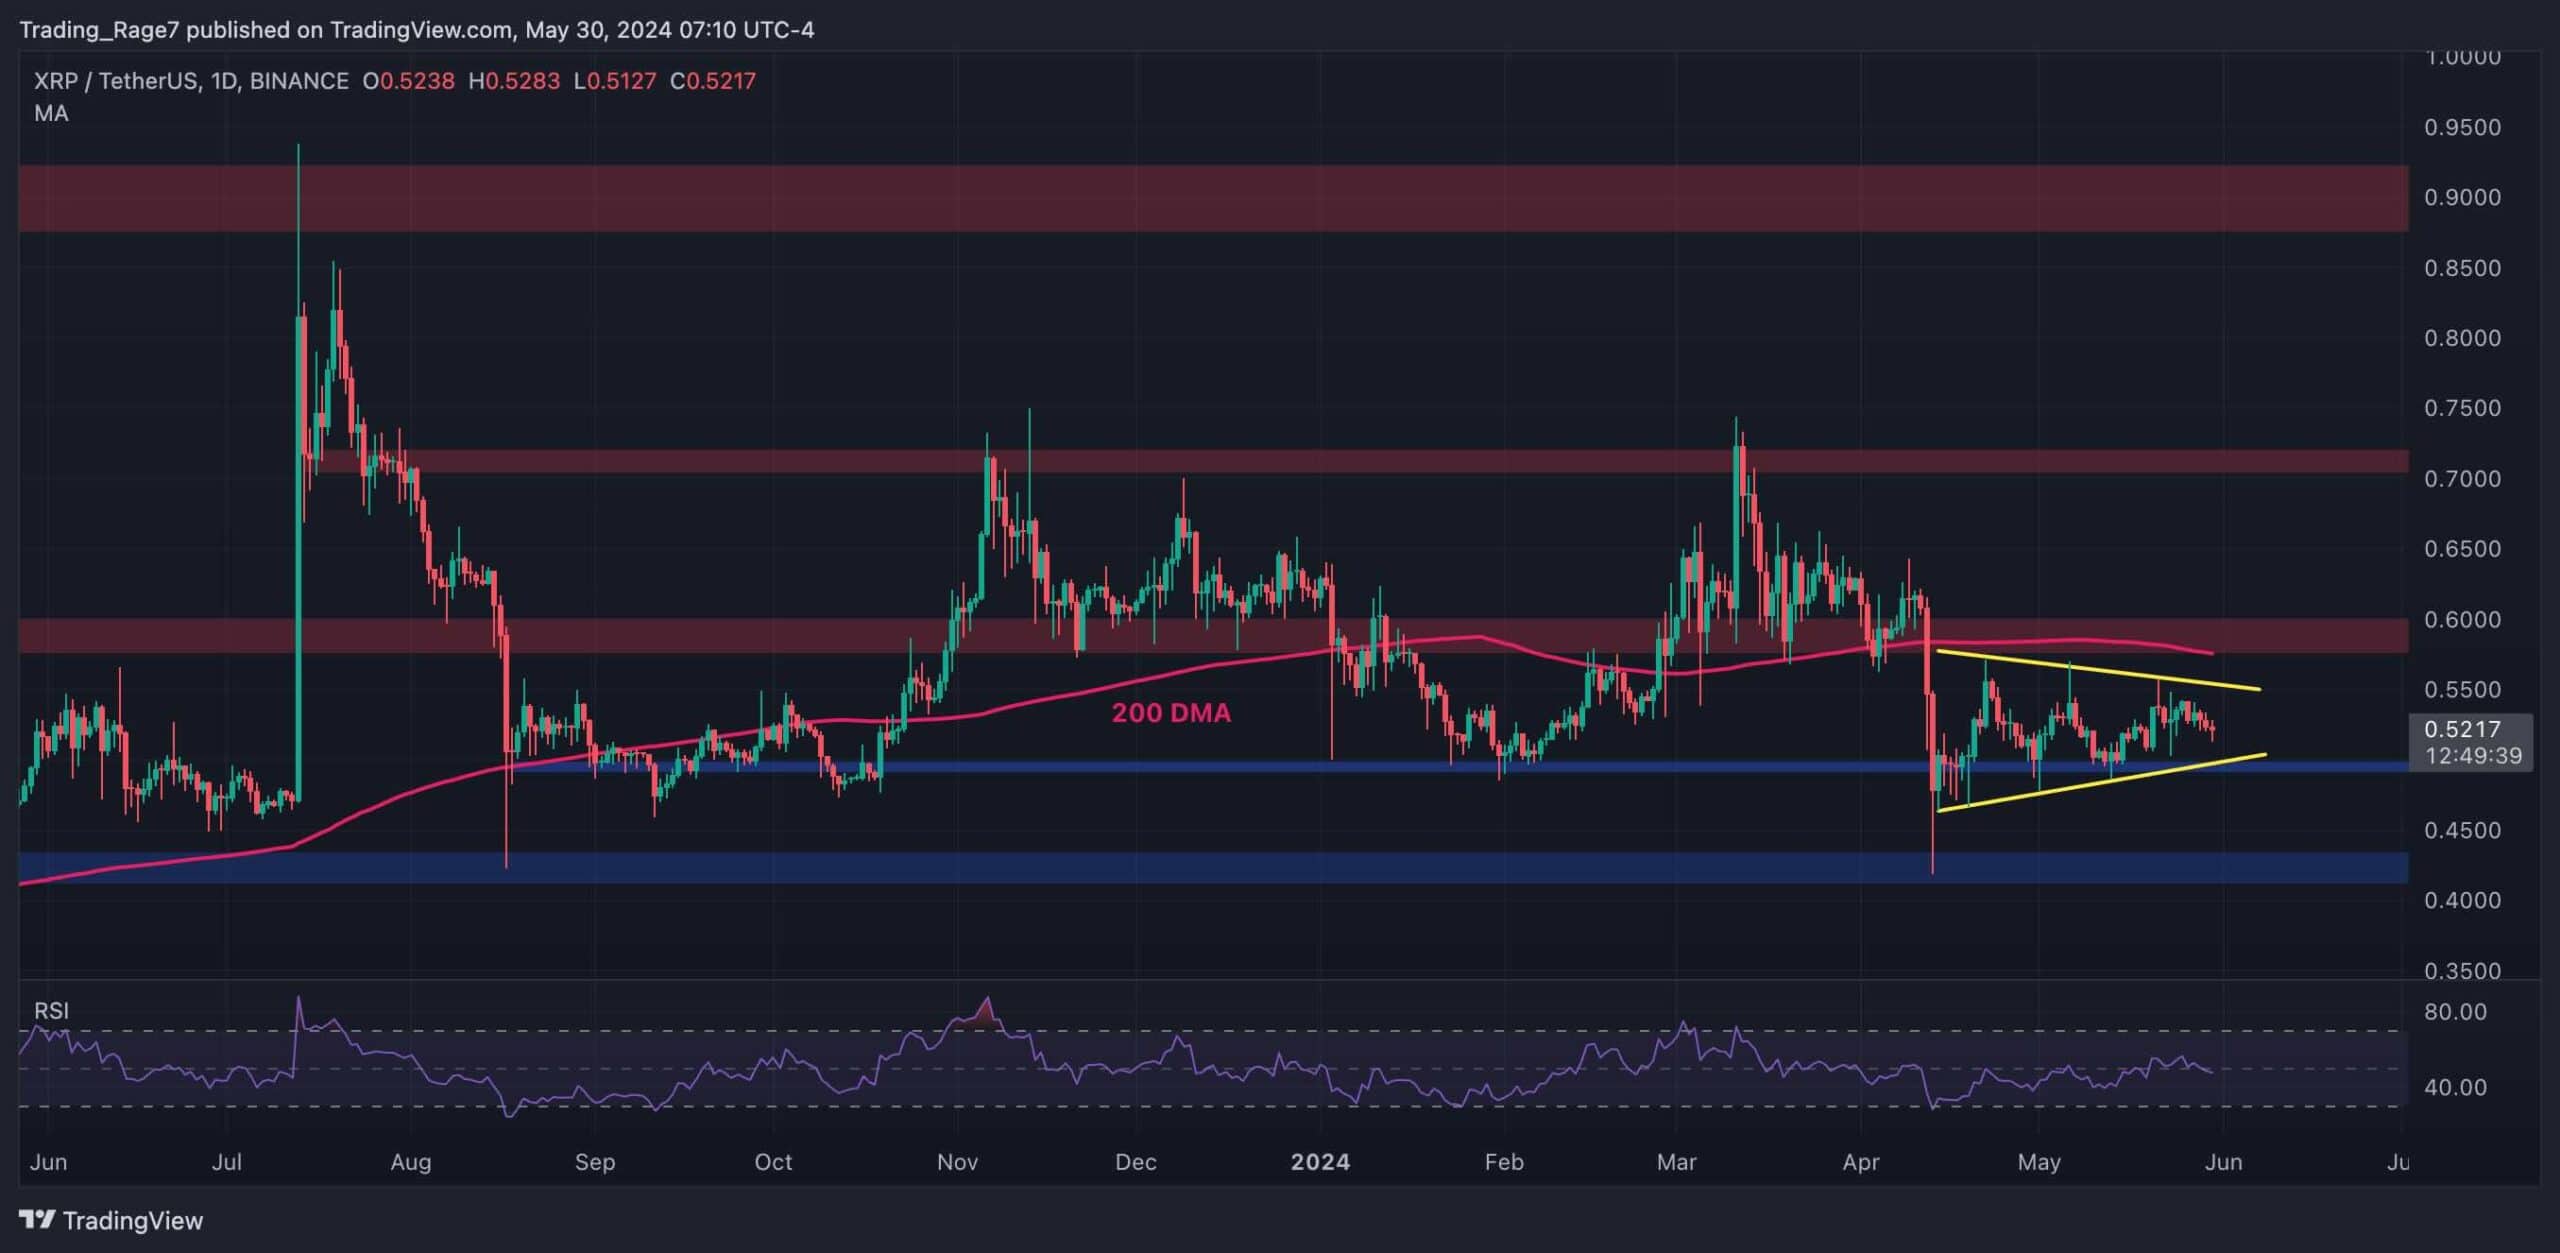
Despite this decline, XRP has reached a substantial support region, marked by the triangle’s lower boundary at $0.5, and a short-term reversal is anticipated.
XRP Analysis
By Shayan
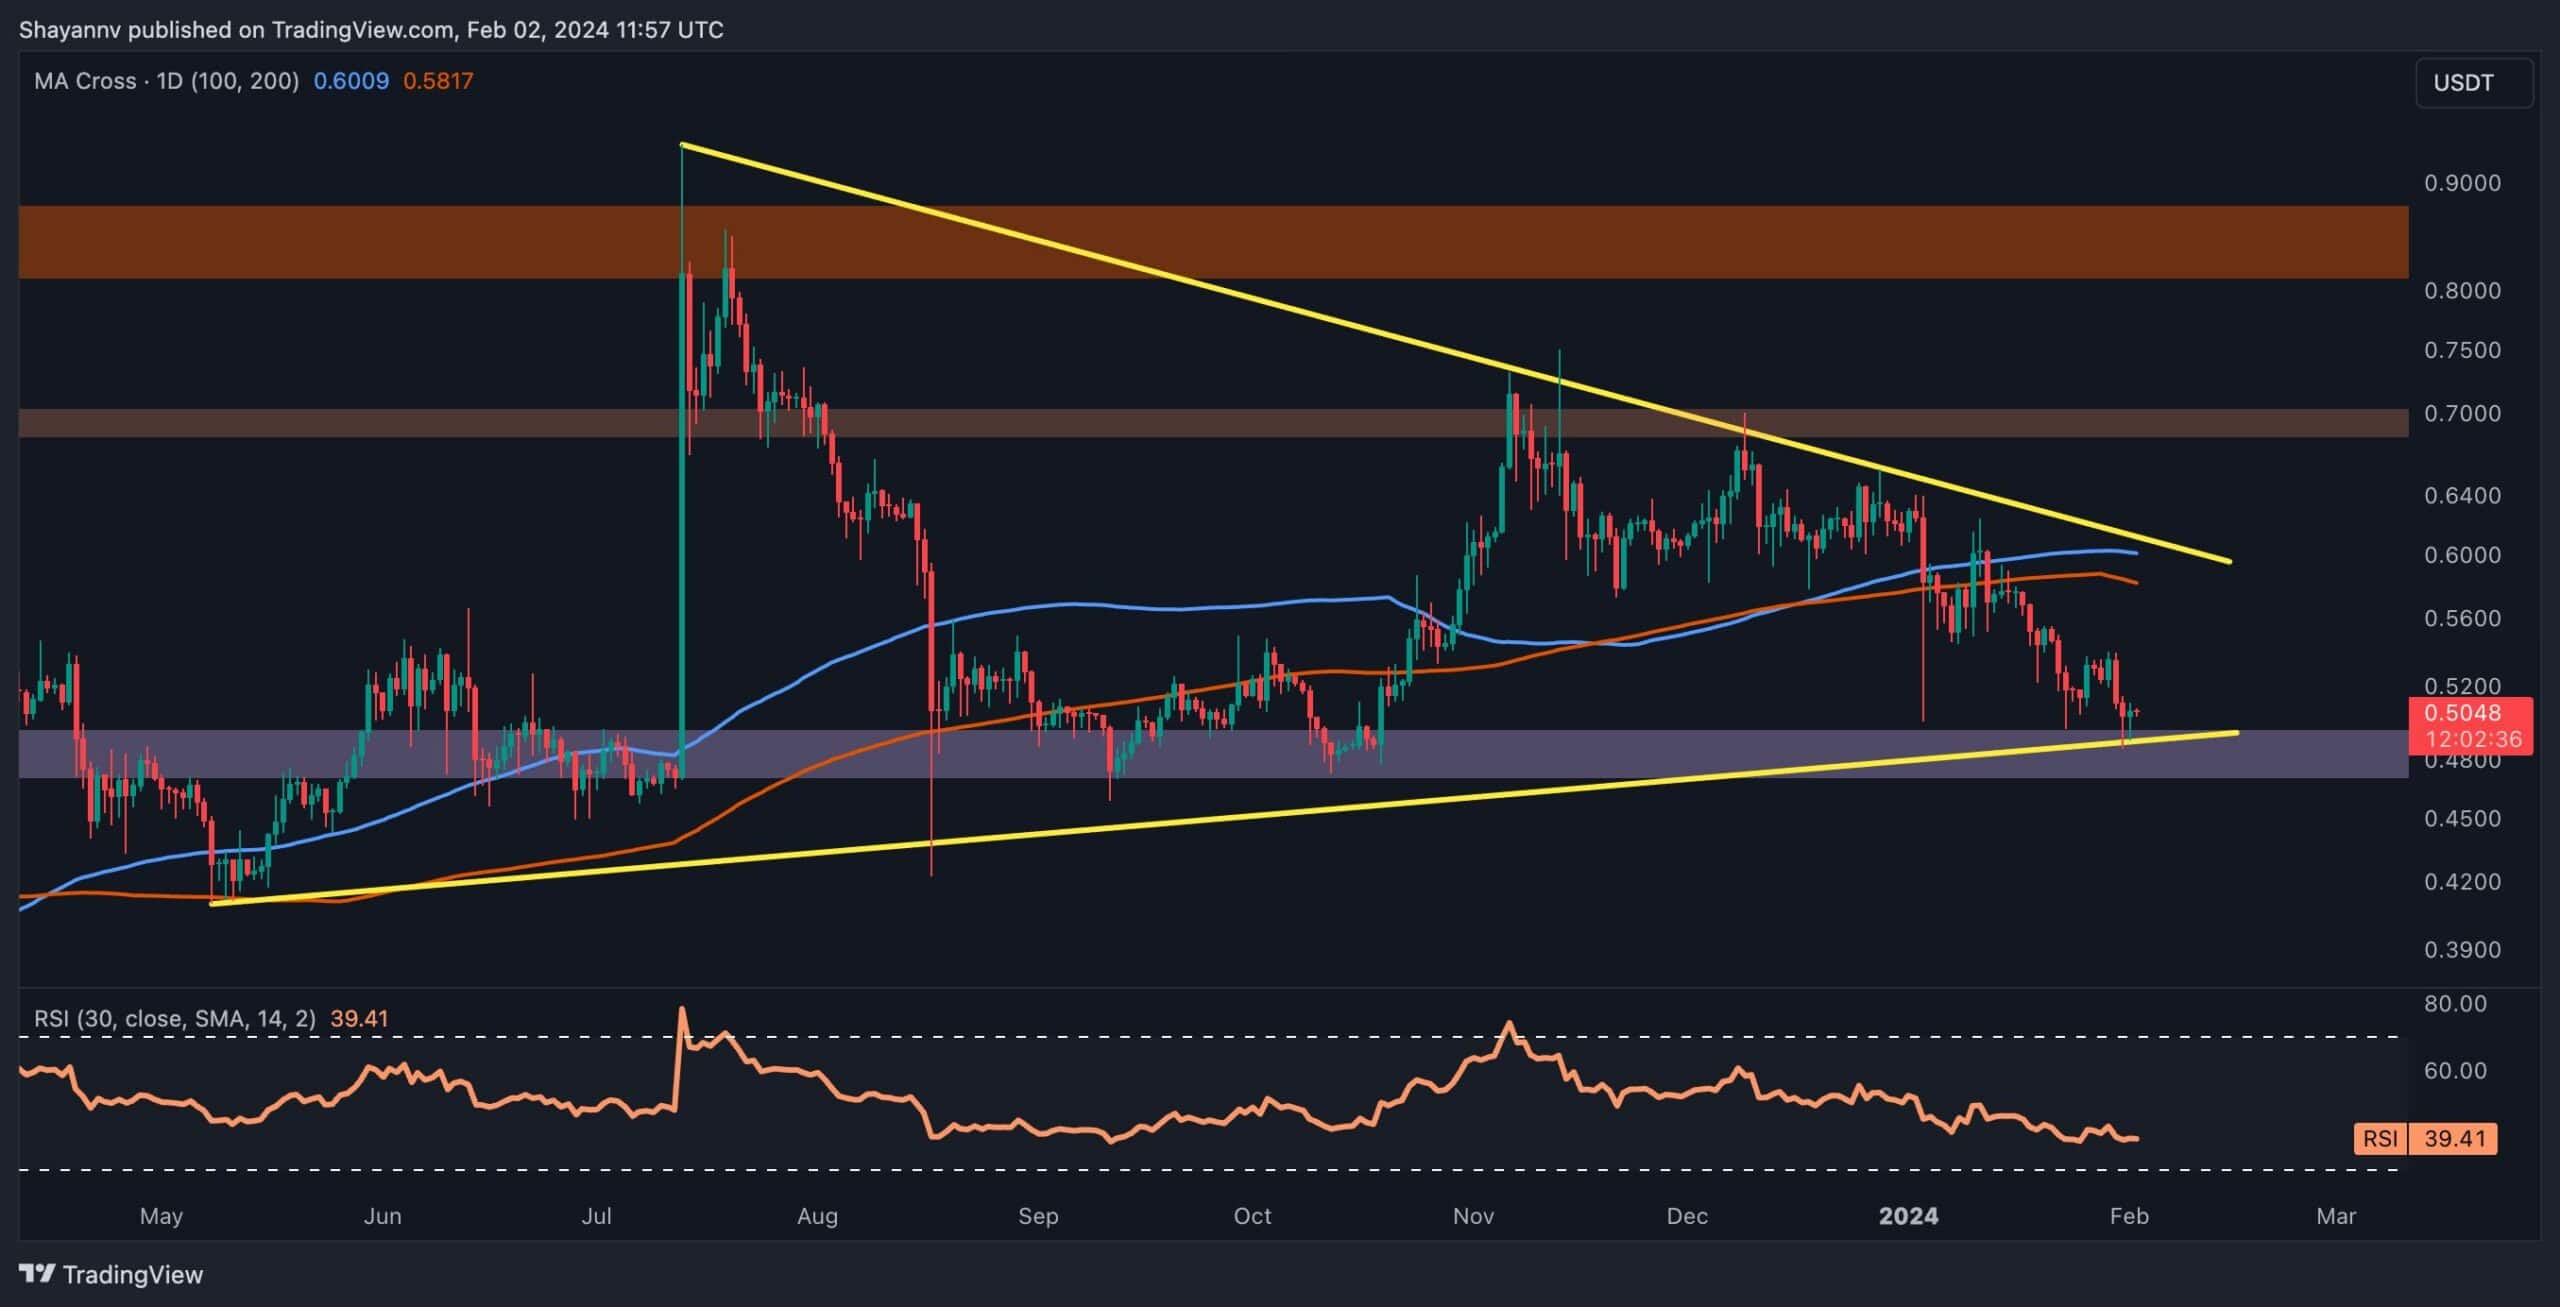
The Daily Chart
A thorough examination of the daily chart reveals a pronounced decline in Ripple’s price, ultimately leading to its arrival at a critical and decisive support region. This support encompasses the static level of $0.5 and the lower boundary of the multi-month triangle. This particular range has effectively blocked bearish attempts over the past year, highlighting heightened demand near the $0.5 threshold.
Consequently, a bullish rebound is expected for Ripple, retracing towards the broken 100 and 200-day moving averages. However, in the event that sellers gain dominance over buyers, the most likely outcome would be a breach below this crucial level, extending the existing downtrend.
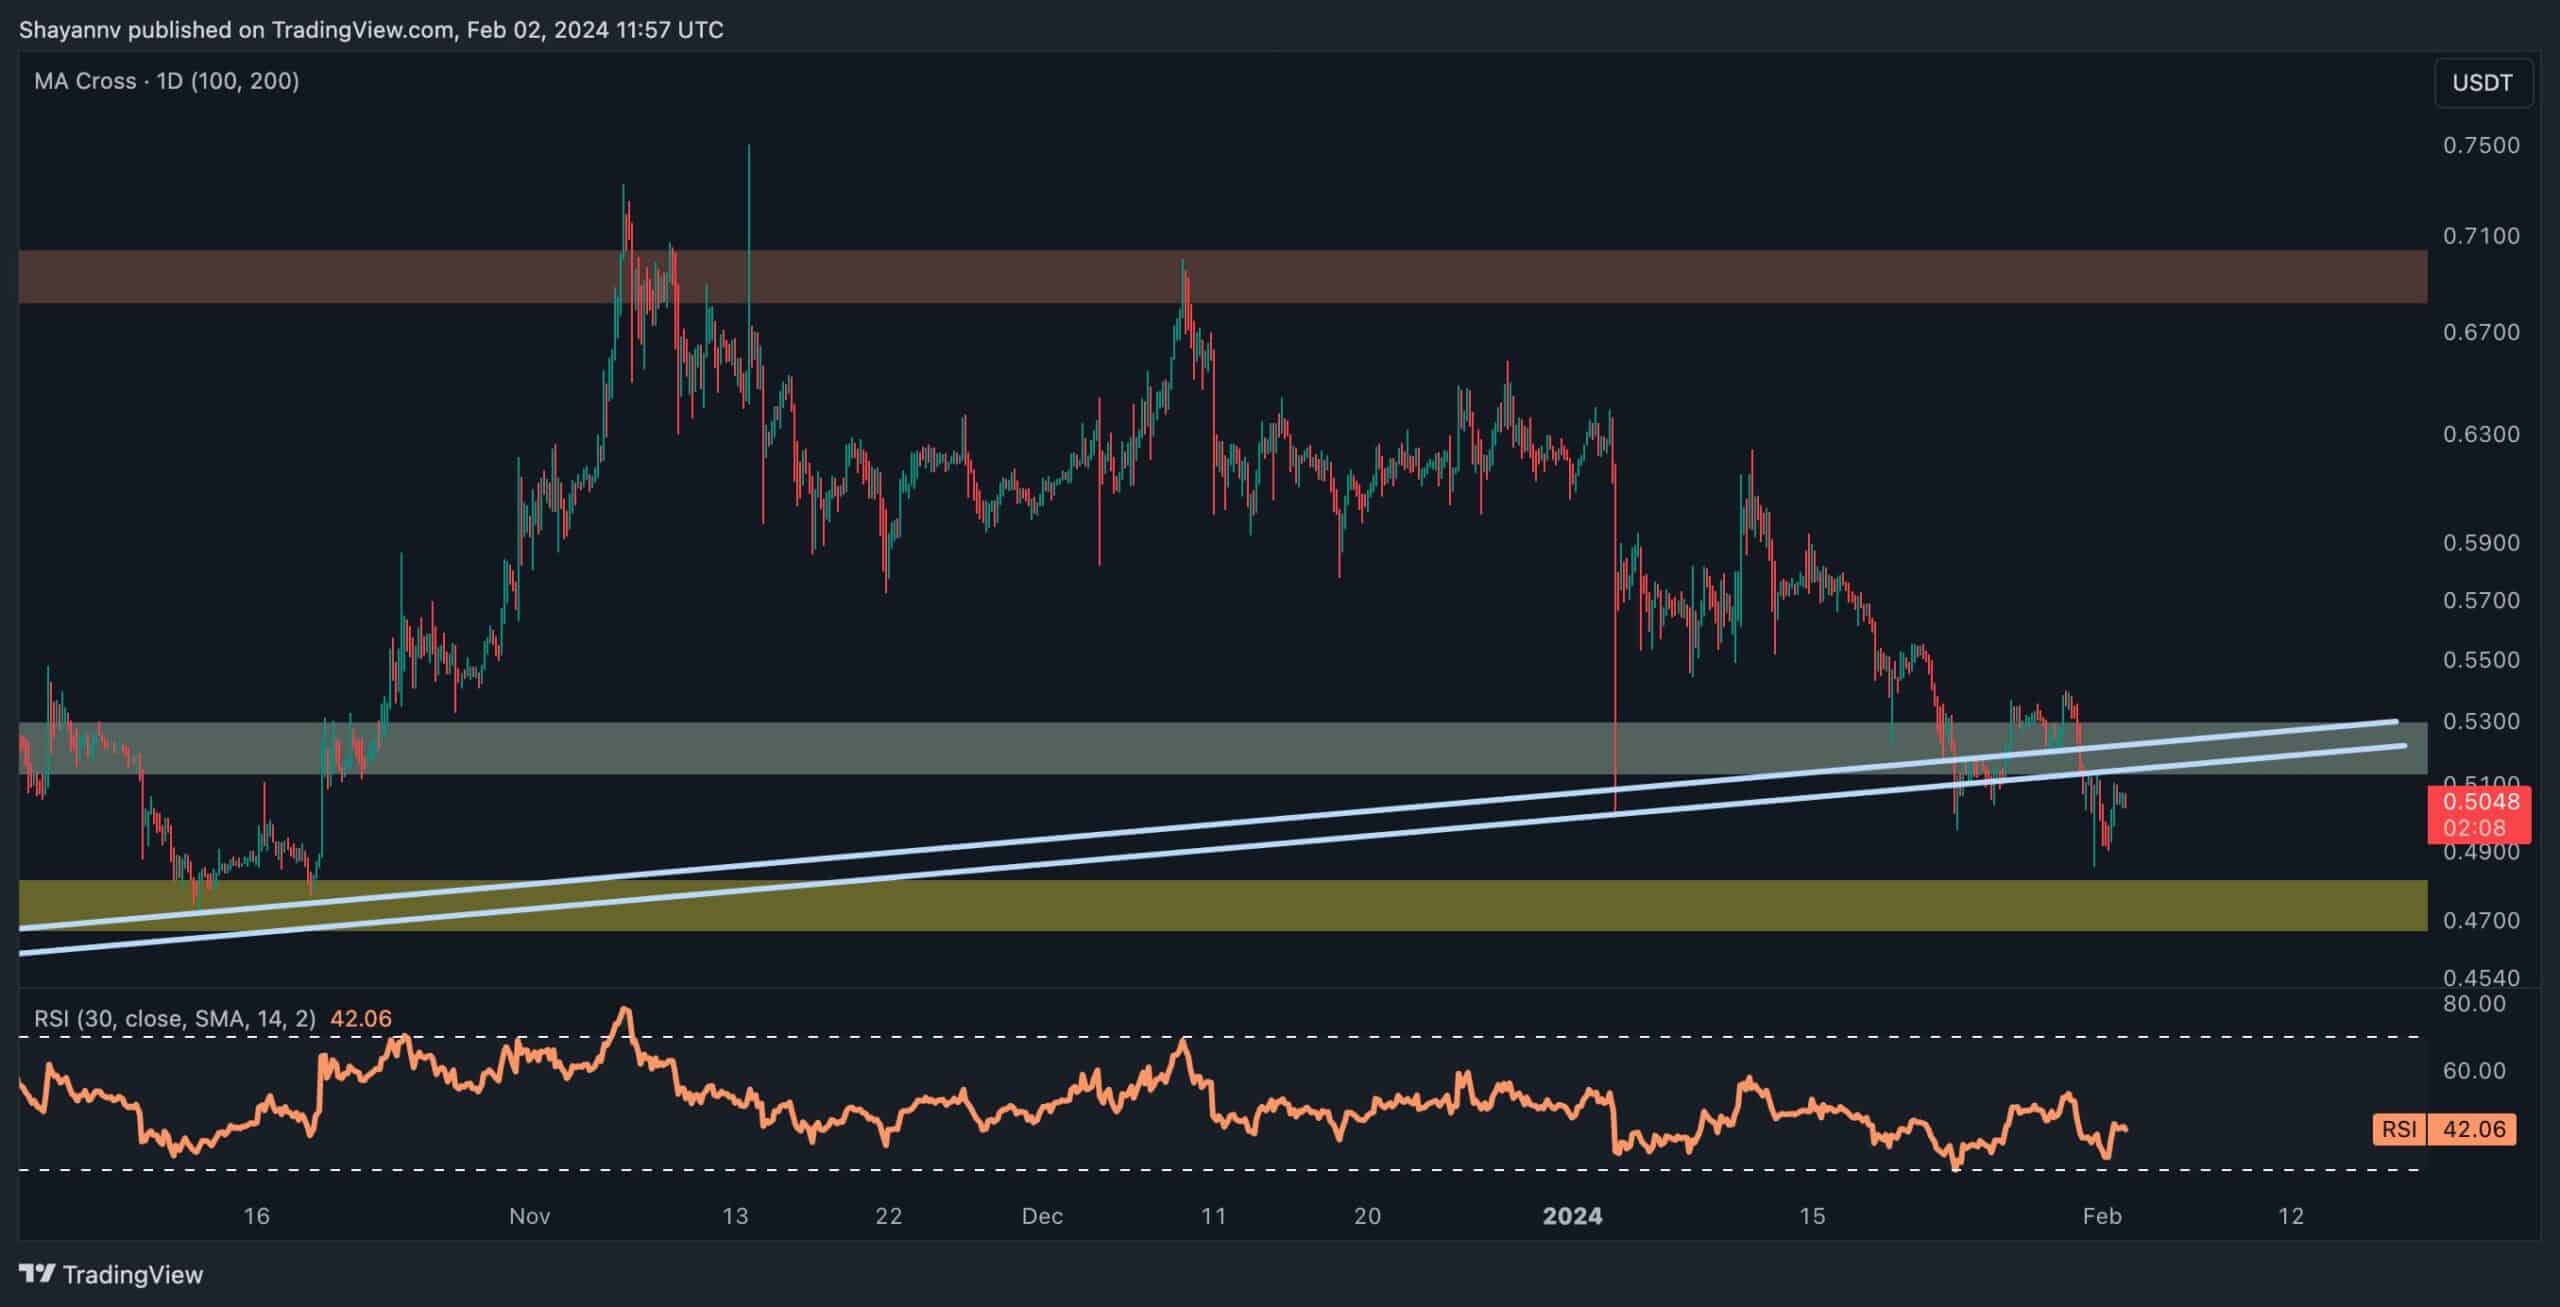
The 4-Hour Chart
A more focused examination of the 4-hour chart underscores the prevailing influence of sellers in the market. Despite this, the price has recently slightly breached a pivotal support region defined by the multi-month ascending trendline, inducing fear in the market.
However, it is crucial to note that the breakout is yet to be considered valid, as there is still potential for a false breakout, a trick often designed to liquidate prevailing long positions in the perpetual market.
In the event of a valid pullback, the price will likely initiate a renewed bearish leg, targeting the $0.47 support region. Continued monitoring of these critical levels will be essential for anticipating potential market movements and assessing the strength of Ripple’s current trend.
The post How Low Will XRP Crash if $0.5 Fails? (Ripple Price Analysis) appeared first on CryptoPotato.