How Low Can SHIB Go? This Support Has to Hold (Shiba Inu Price Analysis)
With sellers in full control of the price action, SHIB is struggling to find support.
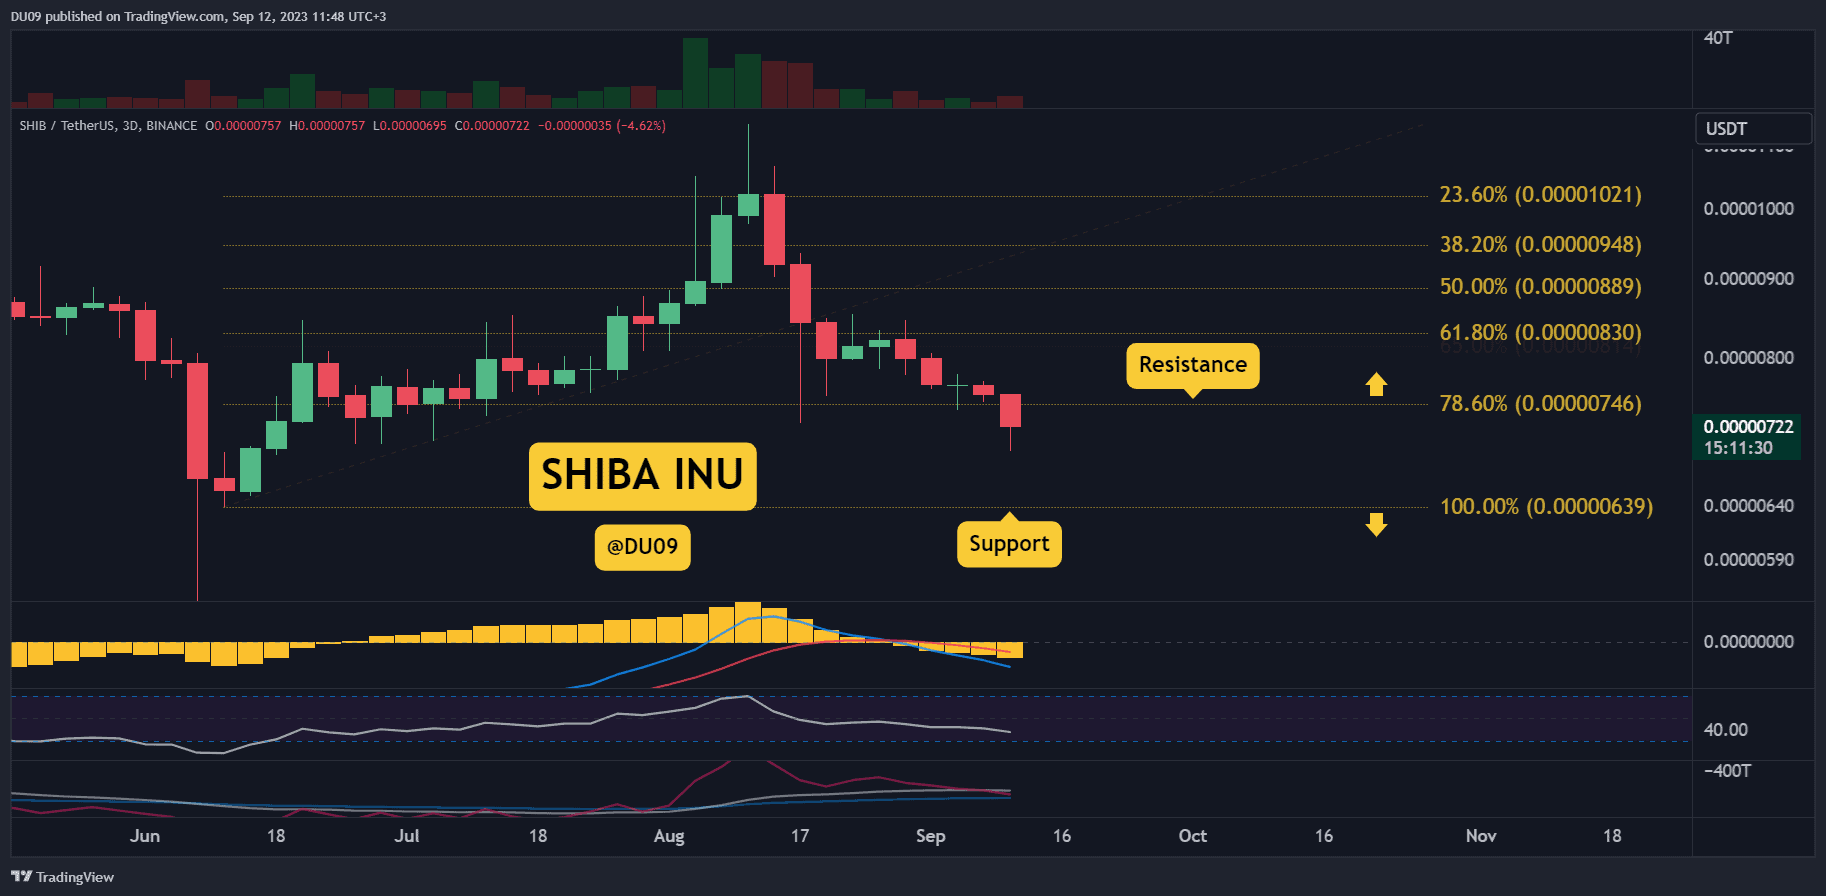
Key Support levels: $0.0000070, $0.0000064
Key Resistance levels: $0.0000075
1. Breakdown and New Lows
With the support at $0.0000075 broken and turned into resistance, Shiba Inu made a new low. This intensified the downtrend and put sellers in charge again. SHIB seems likely to make new lows if buyers don’t return soon.
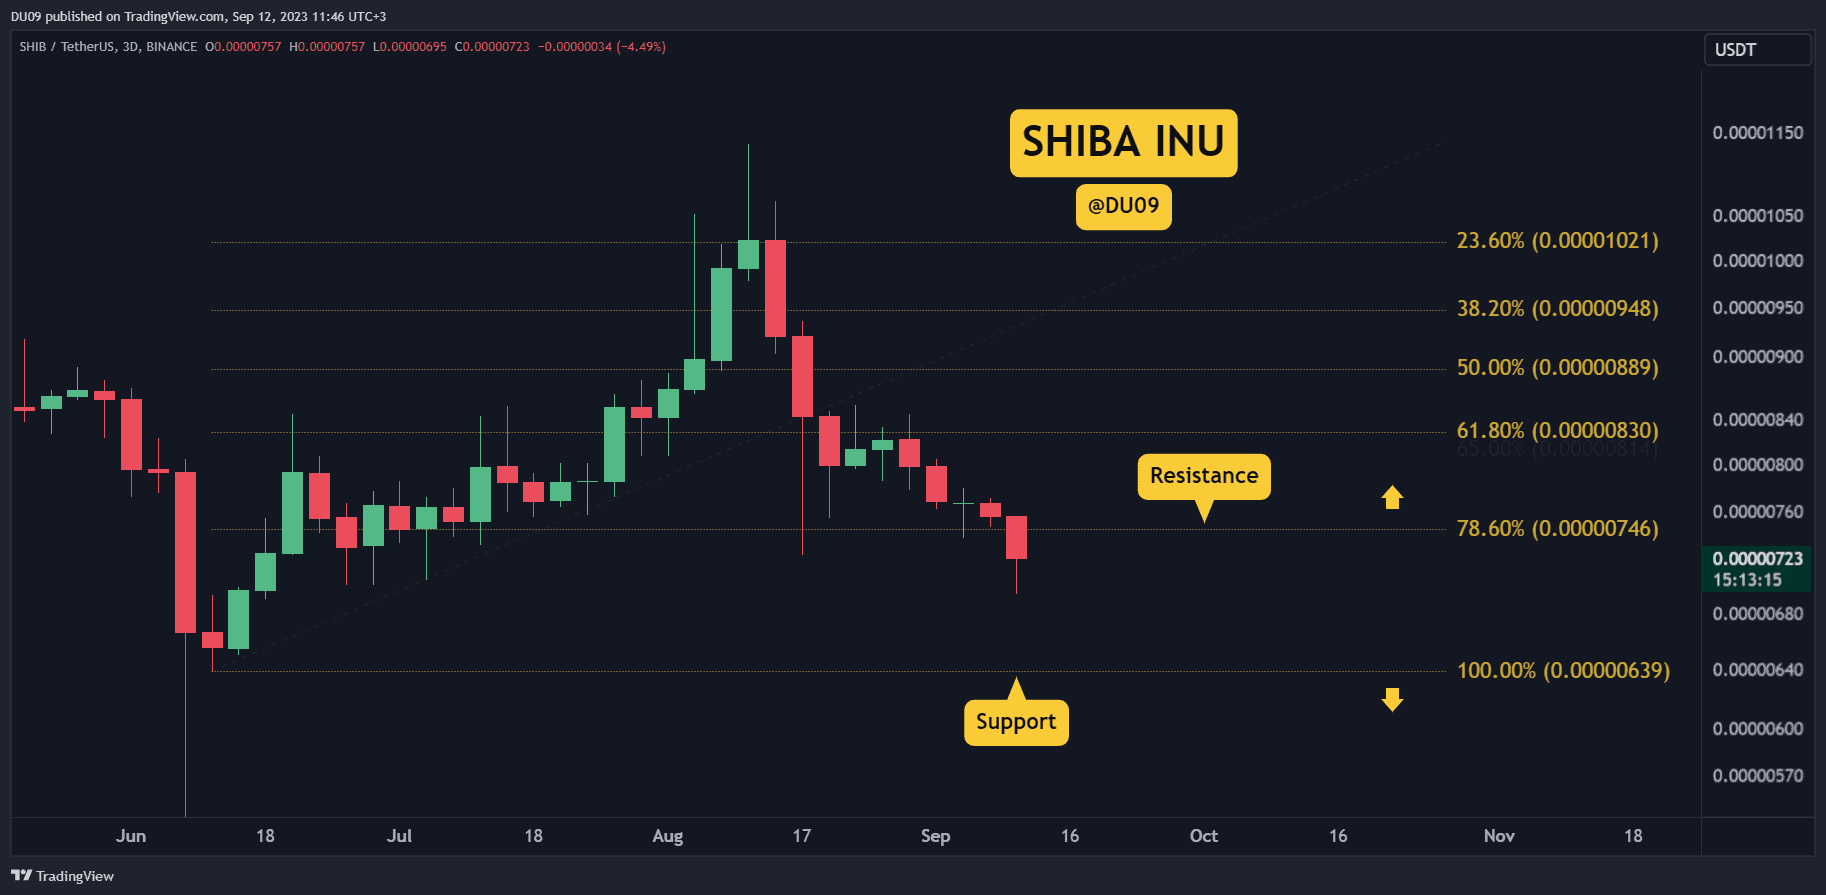
2. Key Support Levels to Watch
The price found some relief on the support at $0.0000070, but considering the bearish momentum, it would be surprising if this level holds. If not, look for a possible reversal of this downtrend at the $0.0000064 support level, which managed to stop sellers back in June.
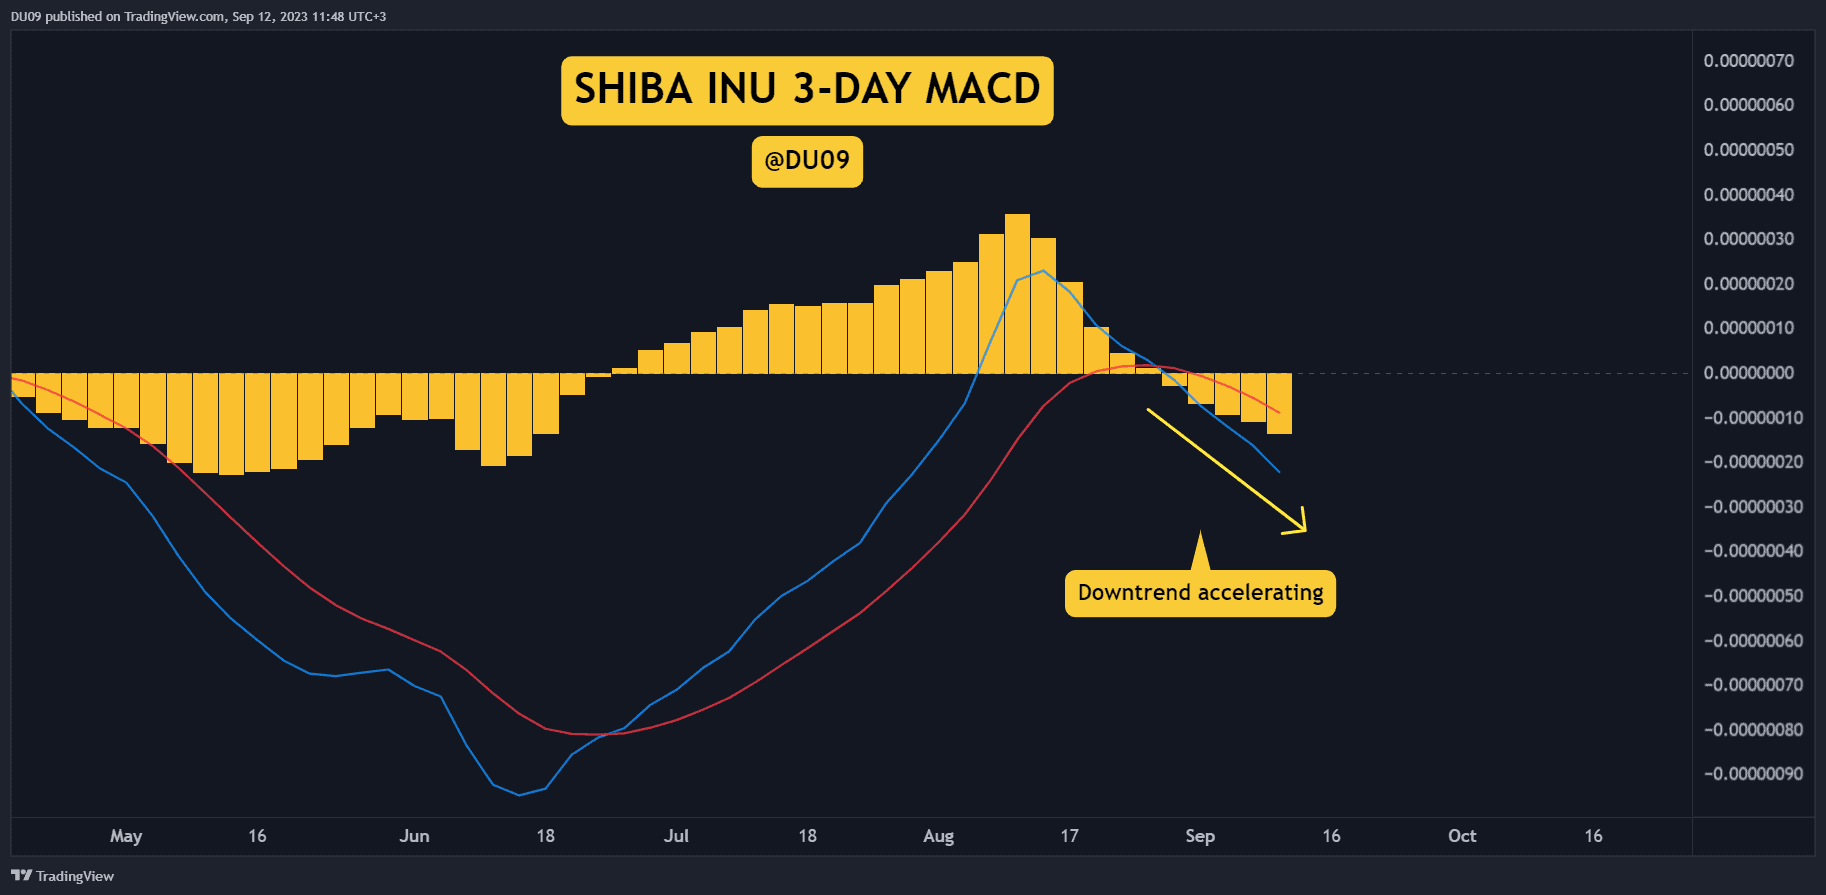
3. Sellers Momentum Increases
While the daily MACD gave hopes of a possible reversal last week, this was quickly erased as soon as SHIB made a new low. Bearing that in mind, the 3-day MACD is now firmly on the bearish side and accelerating down.
Bias
The bias for SHIB is bearish.
Short-Term Prediction for SHIB Price
Watch closely the support levels at $0.0000070 and $0.0000064. They are the most important levels on the chart right now, with the latter support level having the best chance of stopping this downtrend.
The post How Low Can SHIB Go? This Support Has to Hold (Shiba Inu Price Analysis) appeared first on CryptoPotato.