How Is Bitcoin On-Chain Activity Reflecting The Price?
Typically, higher on-chain Bitcoin activity comes with a rising price and vice versa.
The below is from a recent edition of the Deep Dive, Bitcoin Magazine’s premium markets newsletter. To be among the first to receive these insights and other on-chain bitcoin market analysis straight to your inbox, subscribe now.
In today’s Daily Dive, we’re covering the latest state of on-chain activity across transactions, volume, active addresses and entities. Typically higher activity comes with a rising price and vice versa.
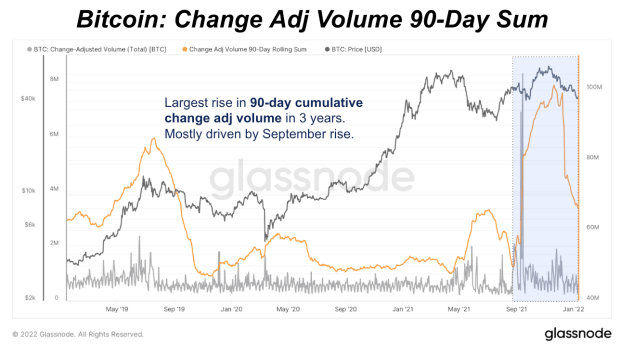
When it comes to analyzing overall transfer volume of the network denominated in BTC, change-adjusted volume is one that we’ll focus on. That’s different from both total transfer volume and entity-adjusted volume estimates, which don’t account for transaction change and filter out volume sent within the same entity. Currently, the network is settling around 593,000 bitcoin per day.
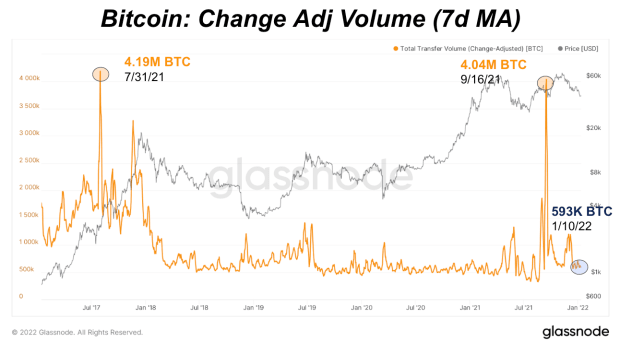
Typically around all-time highs, there’s a rise in BTC-denominated volume. Here we can see the most recent rise over the last three years using a 90-day rolling sum of volume. The latest increase doesn’t show up as a spike in entity-adjusted transfer volume so most of the rise looks to be driven by internal transfers.
Generally, we would expect BTC-denominated transfer volume on-chain to fall over time with rising Lightning Network adoption and rising USD value. More total value can transfer on the network in lower BTC amounts. Currently the median change-adjusted transfer volume is $457.50.
In previous bull markets and at all-time highs, miners were making a much higher percentage of revenue from transaction fees. Now at the latest all-time highs, the percentage of transaction fee revenue remained below 2%.
Some activity indicators to track, which generally move together on the network, are active addresses, active entities and number of transactions. Acceleration in these metrics typically correlate with a rise in price. All were in an accelerating trend since July, peaking in November.