How Does Ethereum’s Economic On-Chain Activity Look Amid Geopolitical Tension?
With the uncertainty at a global scale is hitting critical levels, crypto-markets are splitting between hope and distress as the correlation between traditional markets, and crypto has been particularly high in 2022. By diving into key indicators from a long-term perspective, we can provide a possible bullish scenario for Ethereum.
Regardless of the recent price action, Ethereum holders continue to increase.

Diving into the Growth
Ethereum holders are starting to resemble the behavior of those in Bitcoin.
Ethereum became the first network to surpass 70 million addresses with a balance. While it is true that one person can have multiple addresses, we have to take into account the exchanges that hold multiple users’ funds. This is the closest approximation to measure the number of holders in a crypto asset.
As Ethereum reached 70 million holders, is important to account for how fast is doing that. Just in 2021, with the adoption of DeFi protocols and the explosive growth of NFTs, Ethereum added a total of 18.36 million new addresses with a balance.
This means that network was growing at a pace of 1.53 million new holders per month. And just like 2021, in 2020, we saw a similar increase. 15.95 new addresses with a balance were added to the network.
Compared to Bitcoin
What’s even more interesting is that the number of addresses in a state of profit in Ethereum is bigger than the total number of holders in Bitcoin.

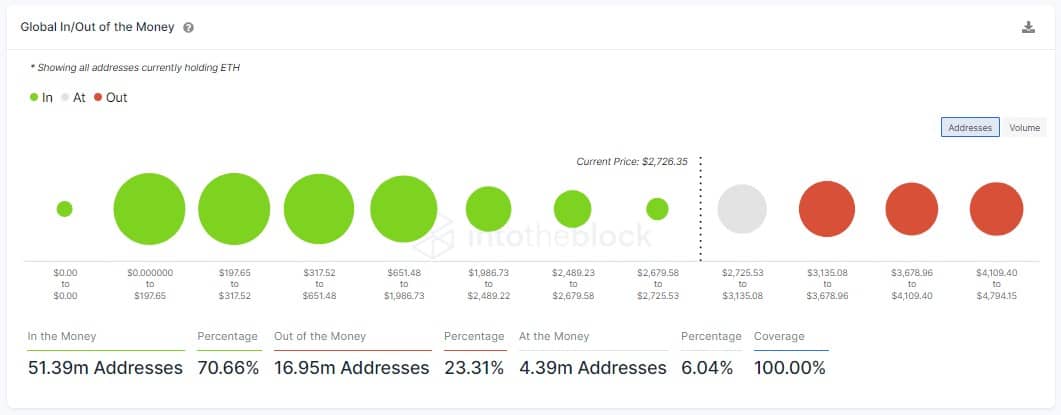
IntoTheBlock’s Global In/Out of the Money (GIOM) classifies addresses based on if they are profitable (in the money), breaking even (at the money), or losing money (out of the money) on their positions at current price.
- At the current price, roughly 70% of the addresses holding ETH (51.39m addresses) are in a state of profit or “in the money.”
- This number is 30% higher than the total number of Holders in Bitcoin (39.49m addresses).
So we established that the Ethereum network has been growing fast and with a strong bottom on holders profitability, even as Baselayer (L1) platforms for decentralized applications (dapps) have recorded outstanding growth in 2021, both in terms of usage of their blockchains and price appreciation of their native tokens.
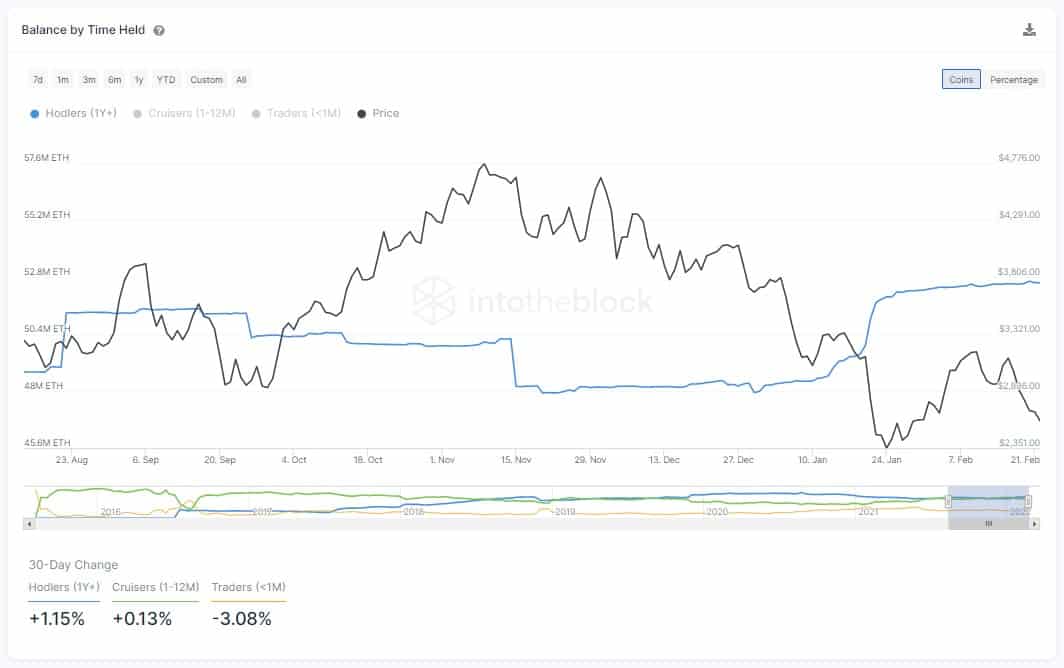
One important factor to take into account is how Ethereum is evolving to a similar pattern to Bitcoin as a “store of value.” Looking at blockchain data, we can observe holders’ activity to examine how they are positioned in light of the recent volatility. Long-term investors (“hodlers”) who have held for over 1 year are still not eager to sell even after the recent lows.

Regardless of the recent price action, long-term investors remain unfazed and are displaying a clear accumulation pattern.
The chart above shows how long-term investors tend to decrease their positions when the price approaches new highs and accumulate when is lower. Since January, the balance held by these holders increase considerably, adding a total of 3 million ETH to their holdings.
The above analysis was compiled for CryptoPotato by IntoTheBlock.


