How Bitcoin Exchange Outflows Rose In January
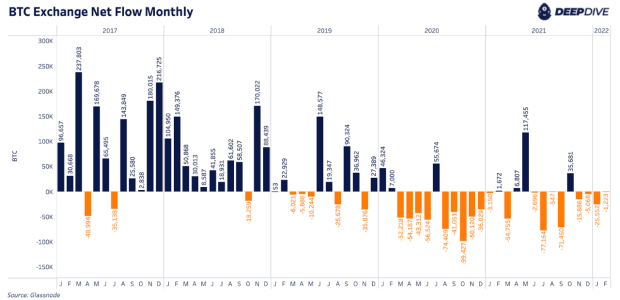
January was the largest month for bitcoin exchange outflows since September 2021.
As we’ve discussed in previous Daily Dives, March 2020 was a significant catalyst and turning point for bitcoin. We can see that in the behavior of exchange balances which have shown consistent net outflow over the last two years.
The two most recent periods of significant inflows were right before both 2021 bitcoin local price tops. These tops in April and November coincided with the previous month showing net exchange inflows of bitcoin in both March and October.
January was the largest outflow month since September 2021. Keeping an eye on exchange flow dynamics can help us track demand sentiment and when that is fundamentally changing for market participants.

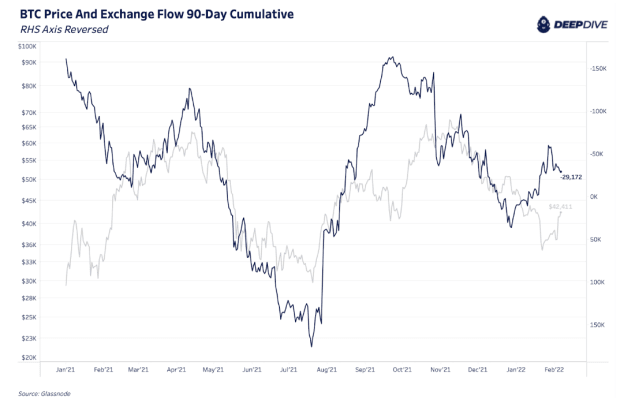
The 90-day cumulative exchange flow has consistently moved with price over the last year. In the chart below, the right-hand side axis is reversed to show how a decreasing net exchange flow correlates with a rising price and vice versa.
What we’ve seen in January is a turning point in the 90-day cumulative netflow with more bitcoin flowing out of exchanges. This signals increased buying demand over the last month and we’ve seen bitcoin price follow suit over the last few days. This is happening while we’re also seeing accumulation trends in long-term holders and whales over the last few weeks.

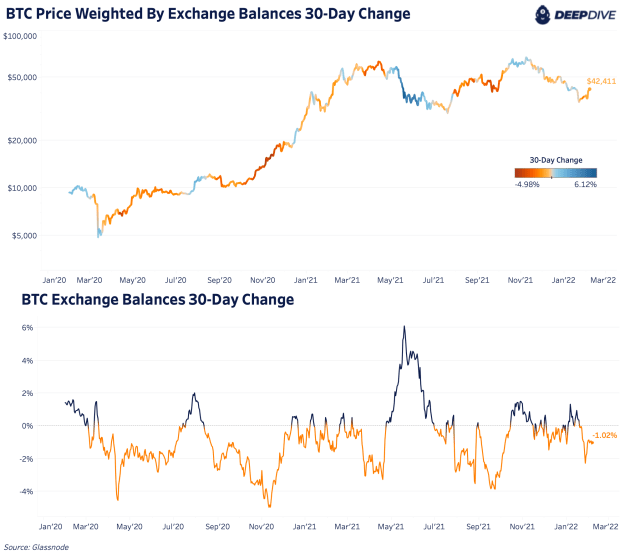
Looking at the 30-day change in exchange balances, we’ve seen a strong deceleration over the last two weeks.

Another way to view exchange volume dynamics is to look at the net exchange flow relative to estimates for adjusted supply. Adjusted supply removes coins that haven’t moved in seven years which is an assumption to account for Satoshi’s coins and lost coins. Current adjusted supply is approximately 15.58 million bitcoin, 82.2% of the circulating supply.


