History Repeats Itself? Two Days Before The 2016 Halving Bitcoin Plunged 11%
With only two days left to the third halving, severe levels of volatility reached the cryptocurrency market, and Bitcoin plunged by 20% in a matter of hours.
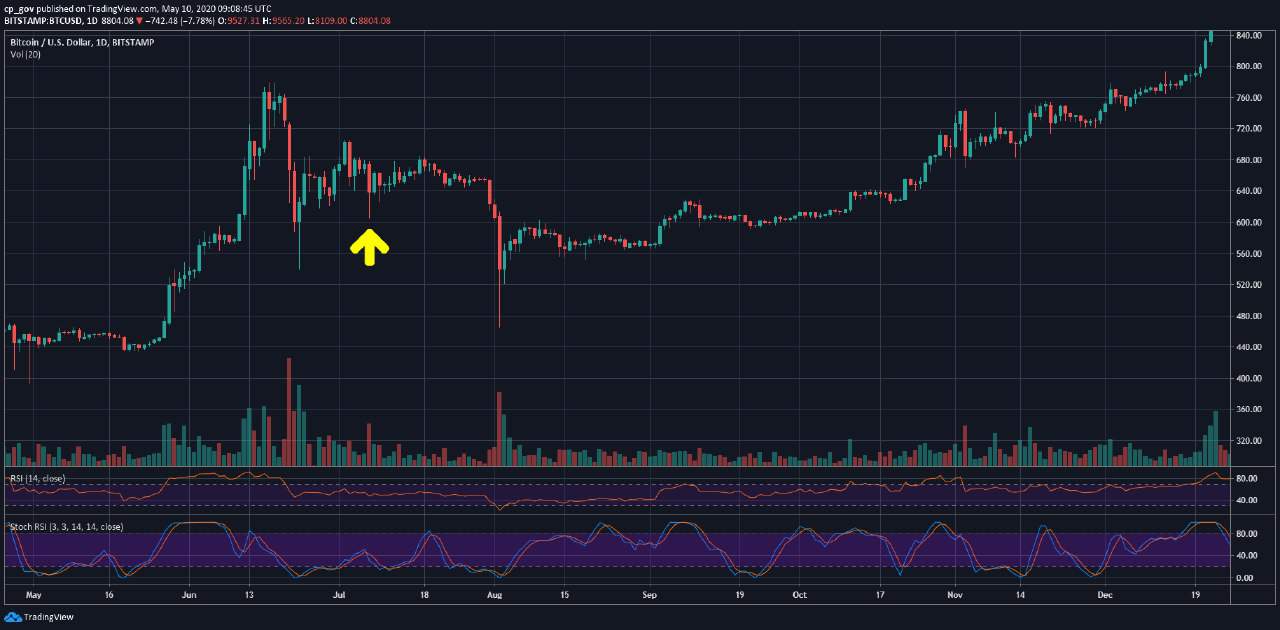
Similar price developments transpired back in July 2016 when, again, two days before the second halving, BTC dropped by 11%.
History On Track In 2016 and 2020
As CryptoPotato reported earlier today, the primary cryptocurrency, and most of the market, nosedived. After the recent impressive surge and touching the psychological level of $10,000, Bitcoin dipped below $8,000 on some exchanges.
Since this notable 20% plunge, however, the price of the asset has recovered slightly and is currently trading at $8,850.
In merely two days, arguably, the most anticipated event in the community this year is scheduled to occur. Aside from cutting in half the rewards miners receive for their efforts to 6.25 BTC per block, the Bitcoin halving typically serves as a catalyst for vigorous price developments as well.
Looking at historical data, the digital asset went through something quite similar nearly four years ago. Initially, BTC surged by over 70% in the weeks prior to the second-ever halving, which took place on July 9th, 2016.
Two days before the event, however, on July 7th, Bitcoin marked an 11% drop. In a violent trading day, the price tanked from $678 to $604, before recovering to $640.

It’s worth noting that on the day of the second halving, the price of BTC dived again from $663 to $625.
Examining The Bigger Picture
Despite the short-term adverse price effects on Bitcoin, the macro data suggests that following the 2016 and, in fact, the 2012 halvings, the primary cryptocurrency surged.
Before the first one, which occurred in November 2012, BTC was trading at about $12. In the next year, though, the asset skyrocketed by 90x to approximately $1,180.
As mentioned above, Bitcoin entered the second halving at around $660. What followed, however, was one of the most impressive bull runs in its existence. BTC firstly jumped to $2,800 in July 2017 before reaching its all-time high at nearly $20,000 in December 2017.
While past data isn’t a valid price indicator for future events, the similarities now are compelling to observe, being so close to the third-ever halving. And, if the price of the asset surged in the months following the previous two, it’s worth raising the question if history could eventually repeat itself.
The post History Repeats Itself? Two Days Before The 2016 Halving Bitcoin Plunged 11% appeared first on CryptoPotato.


