Here’s When XRP Can Surge to $0.6 as Crypto Markets Recover (Ripple Price Analysis)
Ripple has been enduring a consistent downtrend characterized by low volatility and a lack of momentum in its price movement.
However, it has recently found itself at a pivotal support region near the $0.50 mark, potentially poised for a phase of sideways consolidation before its next significant move.
XRP Analysis
By Shayan
The Daily Chart
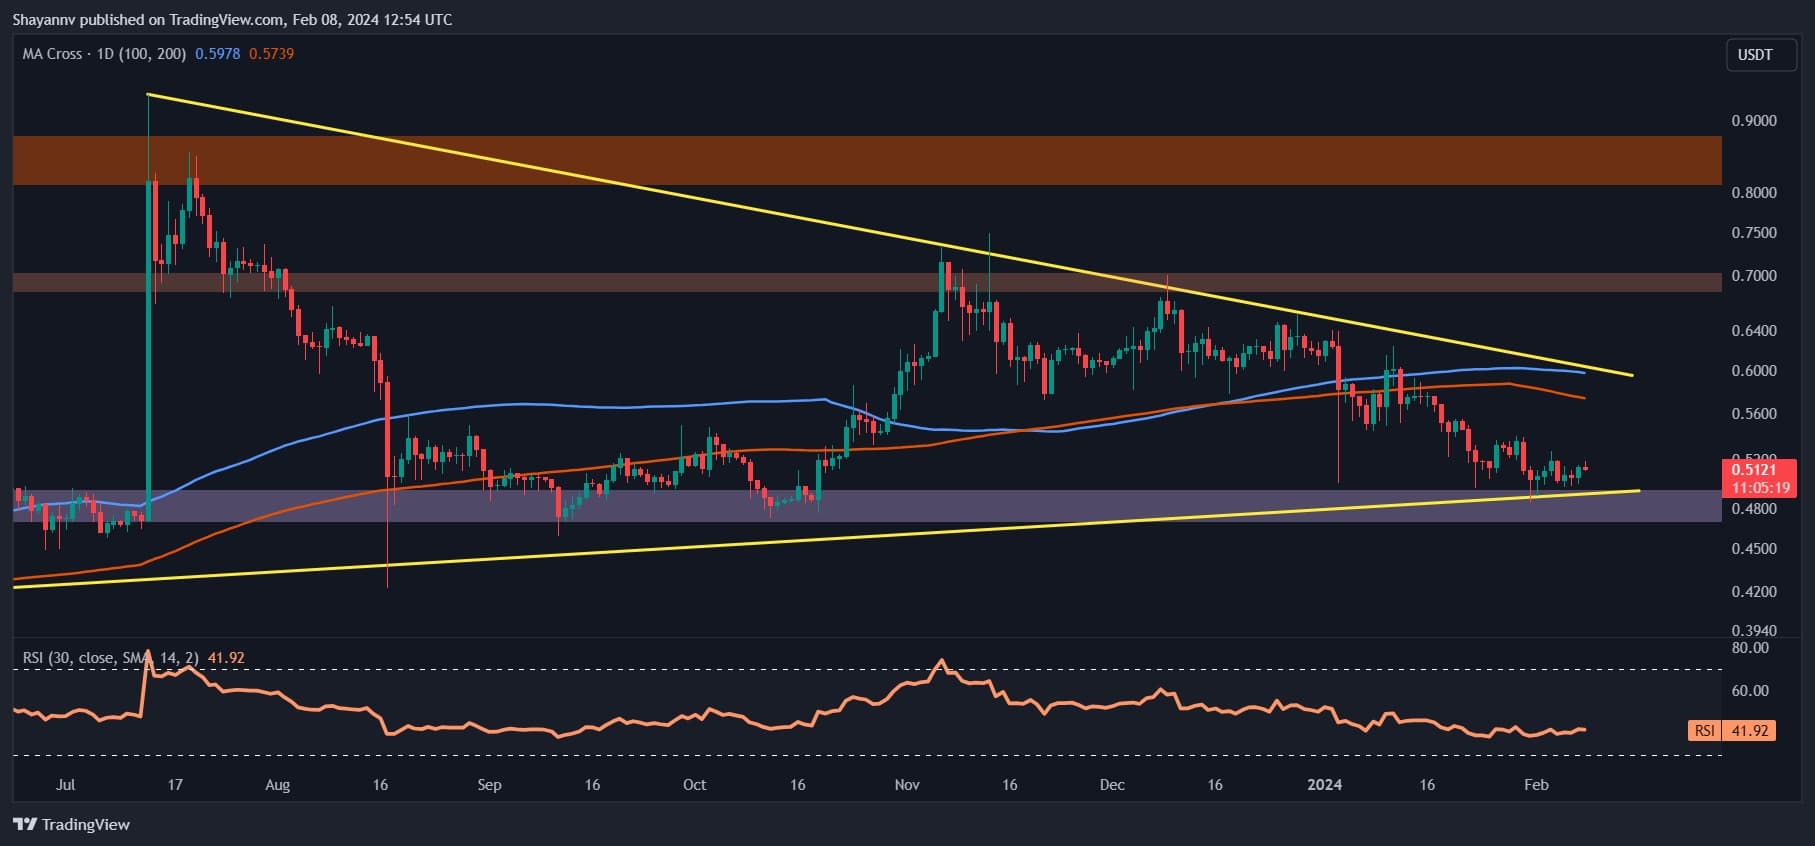
Upon a close examination of the daily chart, Ripple’s price trajectory reveals a gradual decline, resulting in its arrival at a crucial support area.
This support zone encompasses the static level of $0.5 and the lower boundary of a multi-month triangle pattern. Given Ripple’s current low volatility and lack of momentum, the most likely scenario in the short term is a period of sideways consolidation before the next directional move.
However, an eventual bullish rebound is anticipated for XRP, leading to a retracement towards the previously breached 200-day moving average. Consequently, traders should closely monitor Ripple’s price action around these critical levels, as heightened volatility may manifest in the days ahead.
The 4-Hour Chart
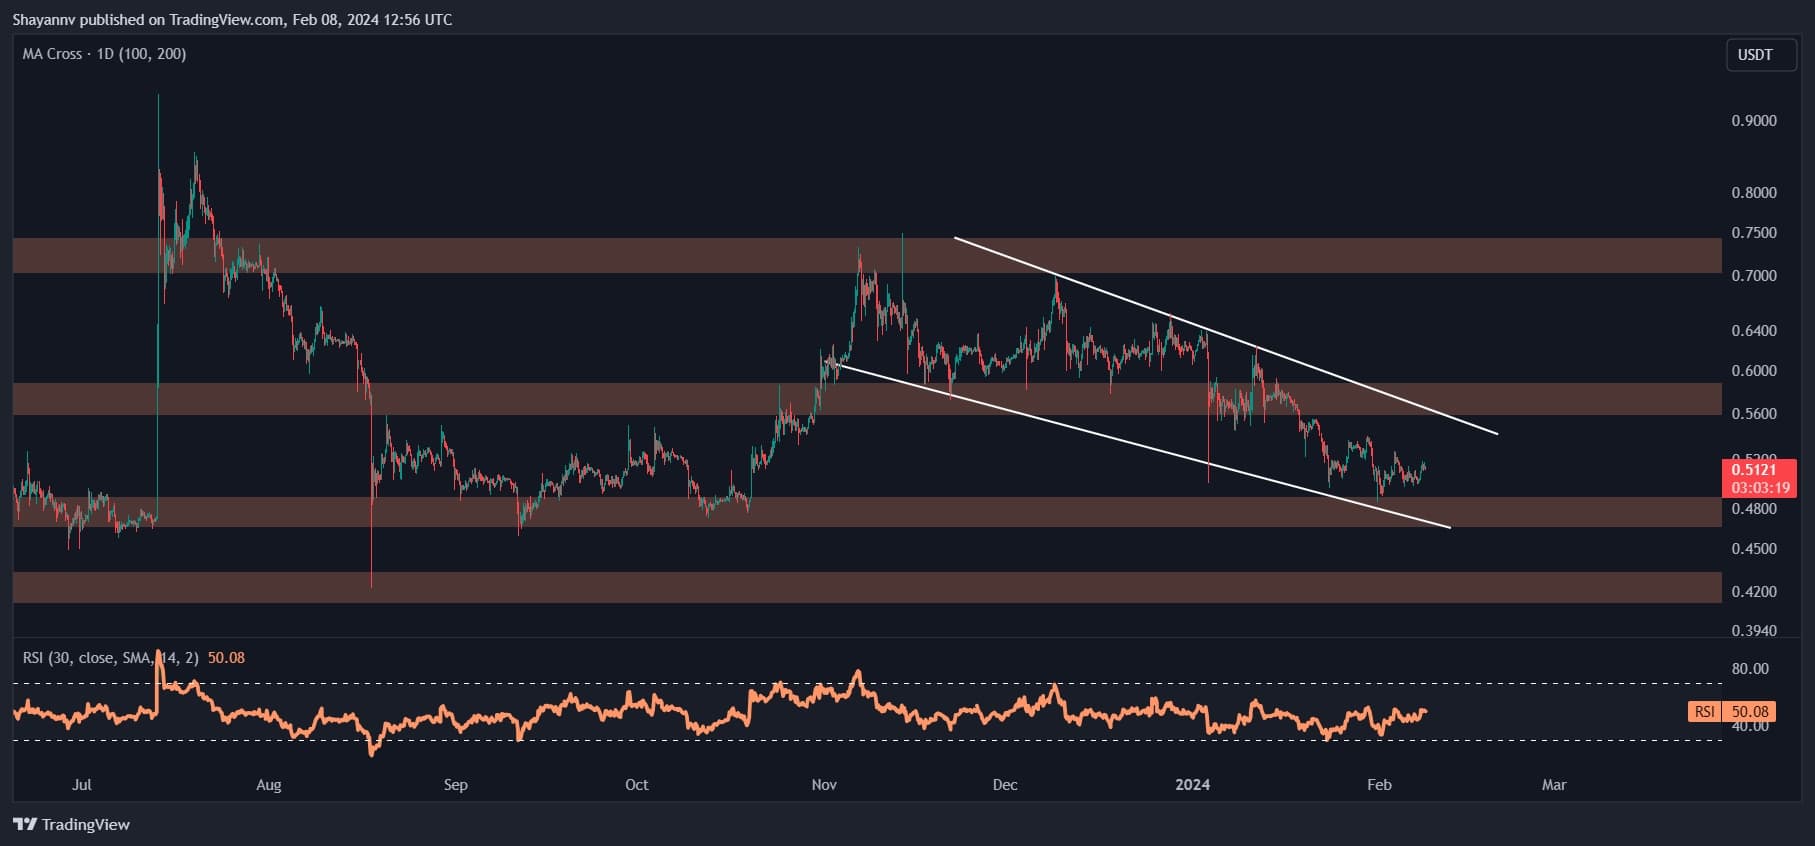
A more focused analysis of the 4-hour chart highlights the prevailing influence of sellers, evident in Ripple’s descent within a descending wedge pattern.
Despite this, the price has reached a significant support region around $0.5, coinciding with the lower boundary of the wedge pattern. Consequently, due to the presence of demand near this crucial threshold, a rebound leading to a bullish retracement is highly probable.
Nevertheless, the XRP price appears to be contained within the range of $0.5 to $0.6, suggesting a likelihood of prolonged fluctuation within this critical area until a breakout occurs. In the event of a successful breakout, the $0.7 resistance and the $0.42 support regions will emerge as the next focal points for Ripple’s price movement.
The post Here’s When XRP Can Surge to $0.6 as Crypto Markets Recover (Ripple Price Analysis) appeared first on CryptoPotato.