Here Are Two Possible Scenarios For XRP in the Coming Days: Ripple Price Analysis
XRP Analysis
By Shayan
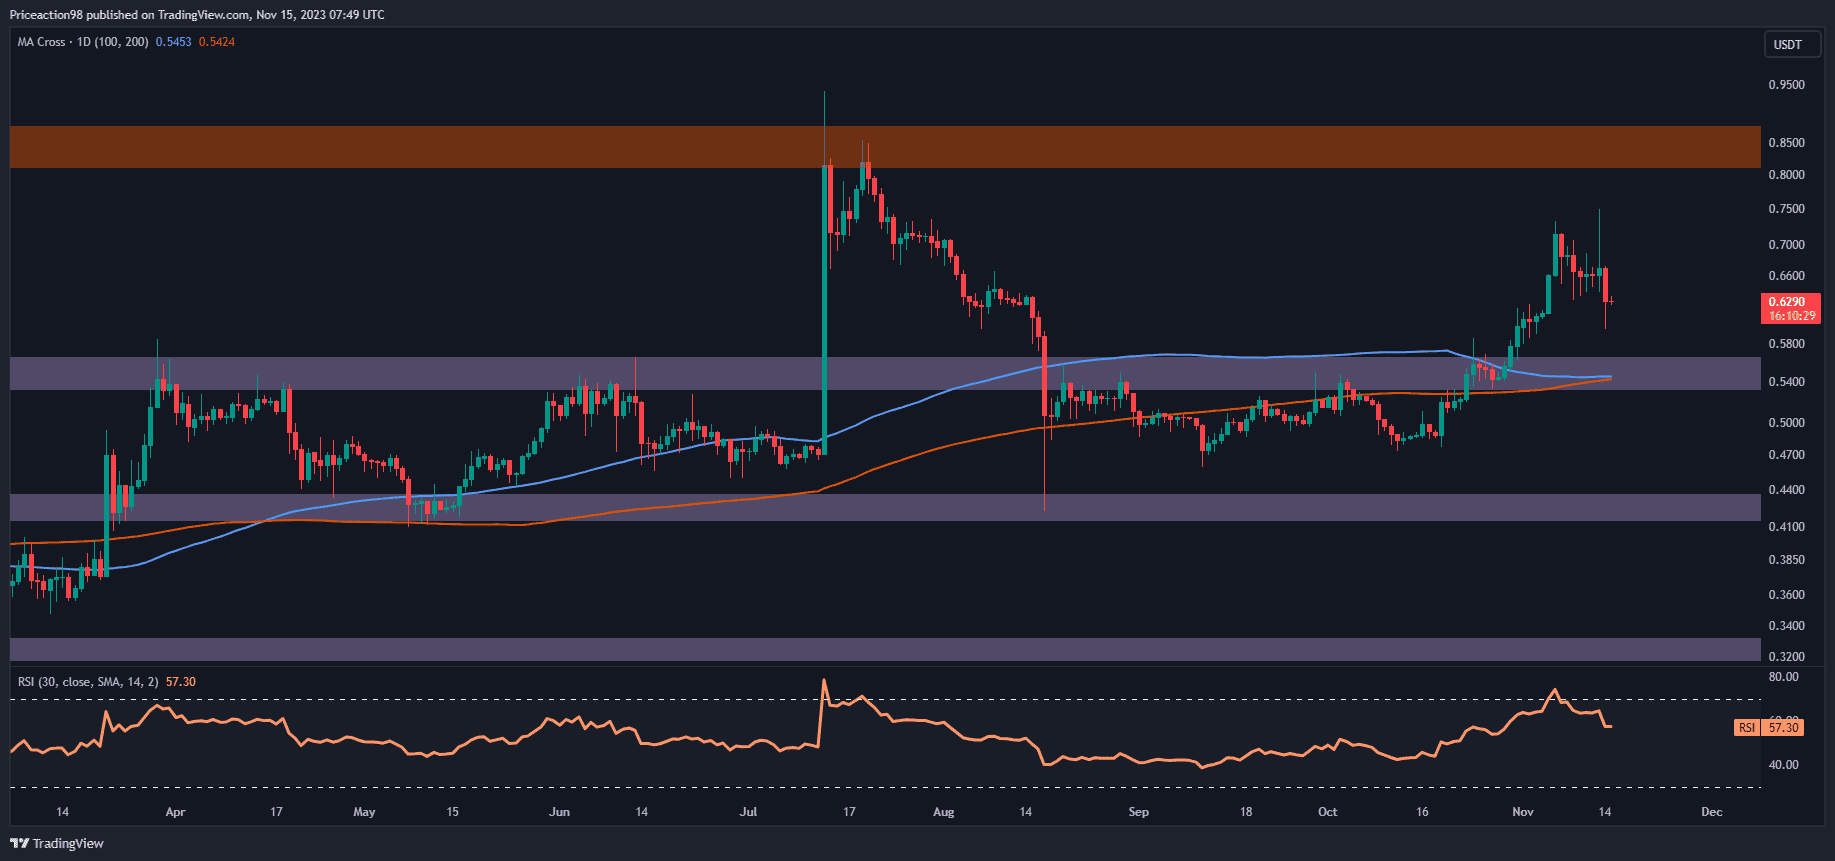
After displaying a robust uptrend that underscored buyer dominance, Ripple set its sights on reclaiming its previous daily swing high at $0.92 but faced resistance and experienced rejection. Given the prevailing market dynamics, there is an anticipation of a retracement towards the broken moving averages, situated around $0.54.
The Daily Chart
A detailed analysis of the daily chart reveals a promising uptrend for Ripple’s price, successfully reclaiming the 100-day and 200-day moving averages around $0.54. Despite the upward trajectory, the attempt to surpass the previous major swing high at $0.92 encountered seller dominance, impeding further upward movement.
Considering recent price action and heightened volatility, there is a high probability of a continuation of the consolidation correction stage, with an expected pullback to the broken levels. In this scenario, the substantial support region, encompassing the 100-day and 200-day moving averages, as well as the static price range of $0.54, becomes the next key level for XRP.
The 4-Hour Chart
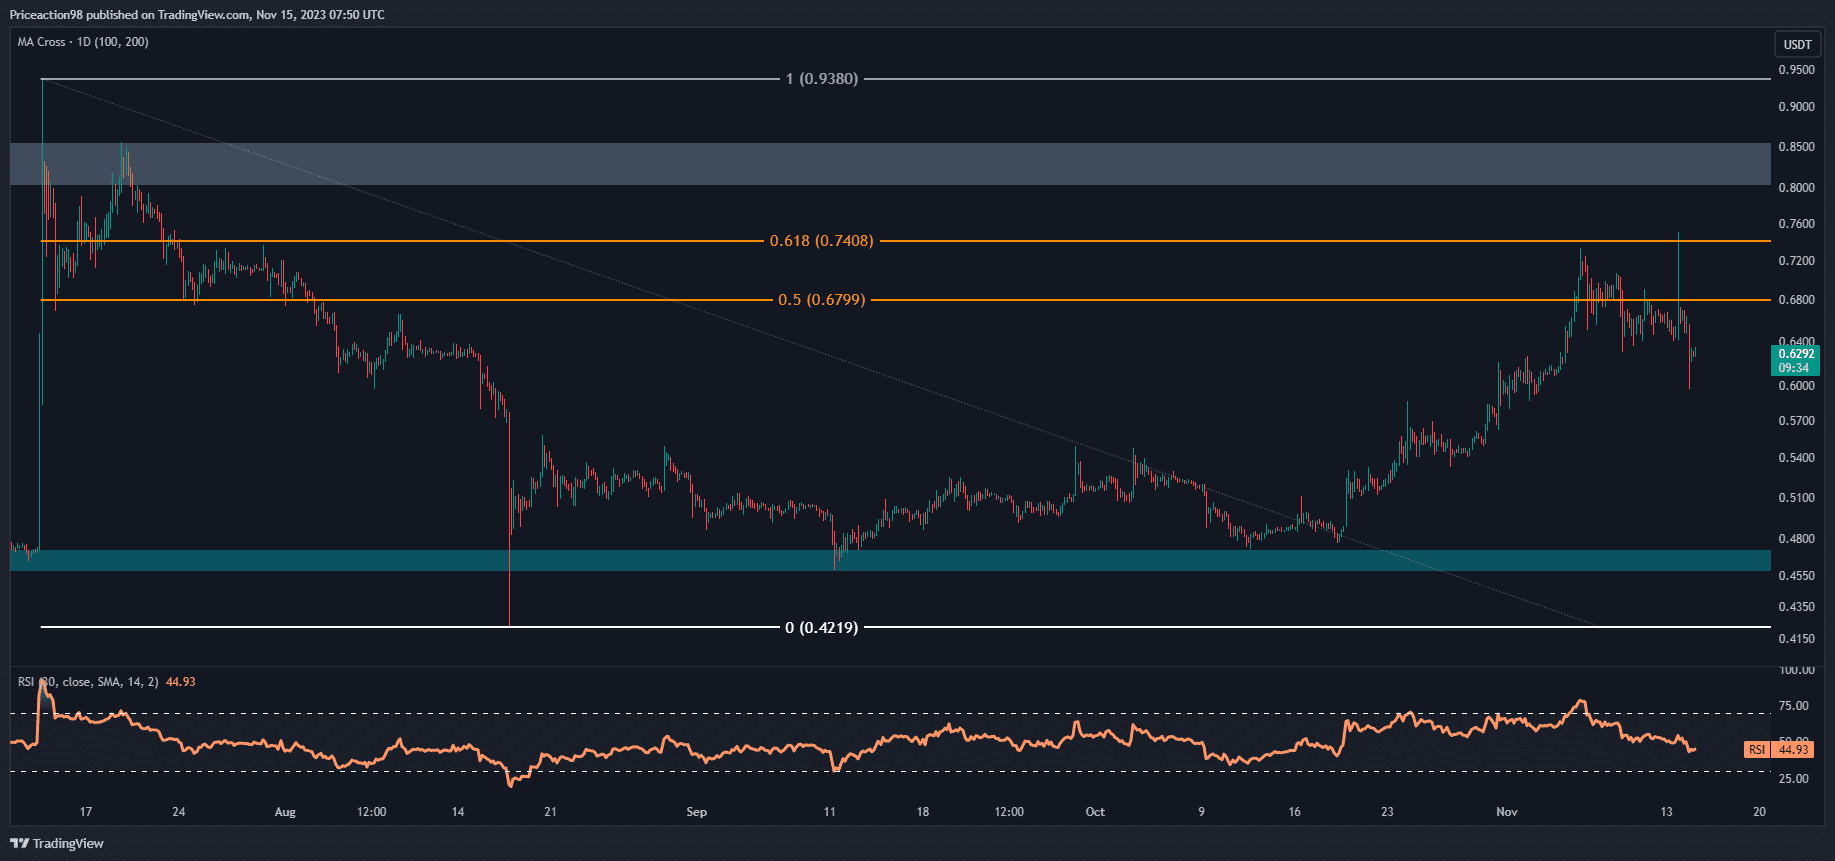
Shifting the focus to the 4-hour chart, the market reached a critical resistance region characterized by the price range between the 0.5 and 0.618 levels of the Fibonacci retracement ($0.6799-$0.7408) following a robust uptrend.
However, the prevailing supply in this pivotal zone halted the upward movement, triggering increased market volatility and potentially hitting a significant number of stop-loss orders.
Nevertheless, the price has encountered notable rejection in this crucial region, resulting in a substantial decline. If this reversal continues, there is a possibility of a consolidation correction, retracing toward the $0.53 support region. However, a successful breach of the 0.618 level of the Fibonacci retracement would invalidate this scenario, potentially signaling further upward movement for Ripple’s price. Traders and investors should closely monitor these developments for strategic decision-making.
The post Here Are Two Possible Scenarios For XRP in the Coming Days: Ripple Price Analysis appeared first on CryptoPotato.


