Here are The Two Possible Outcomes for XRP This Week (Ripple Price Analysis)
Ripple’s price has shown a bullish trend in recent weeks, gradually increasing towards a key resistance level. However, there is a possibility of another crash if the price fails to break above this area.
Technical Analysis
By Edris
The USDT Paired Chart
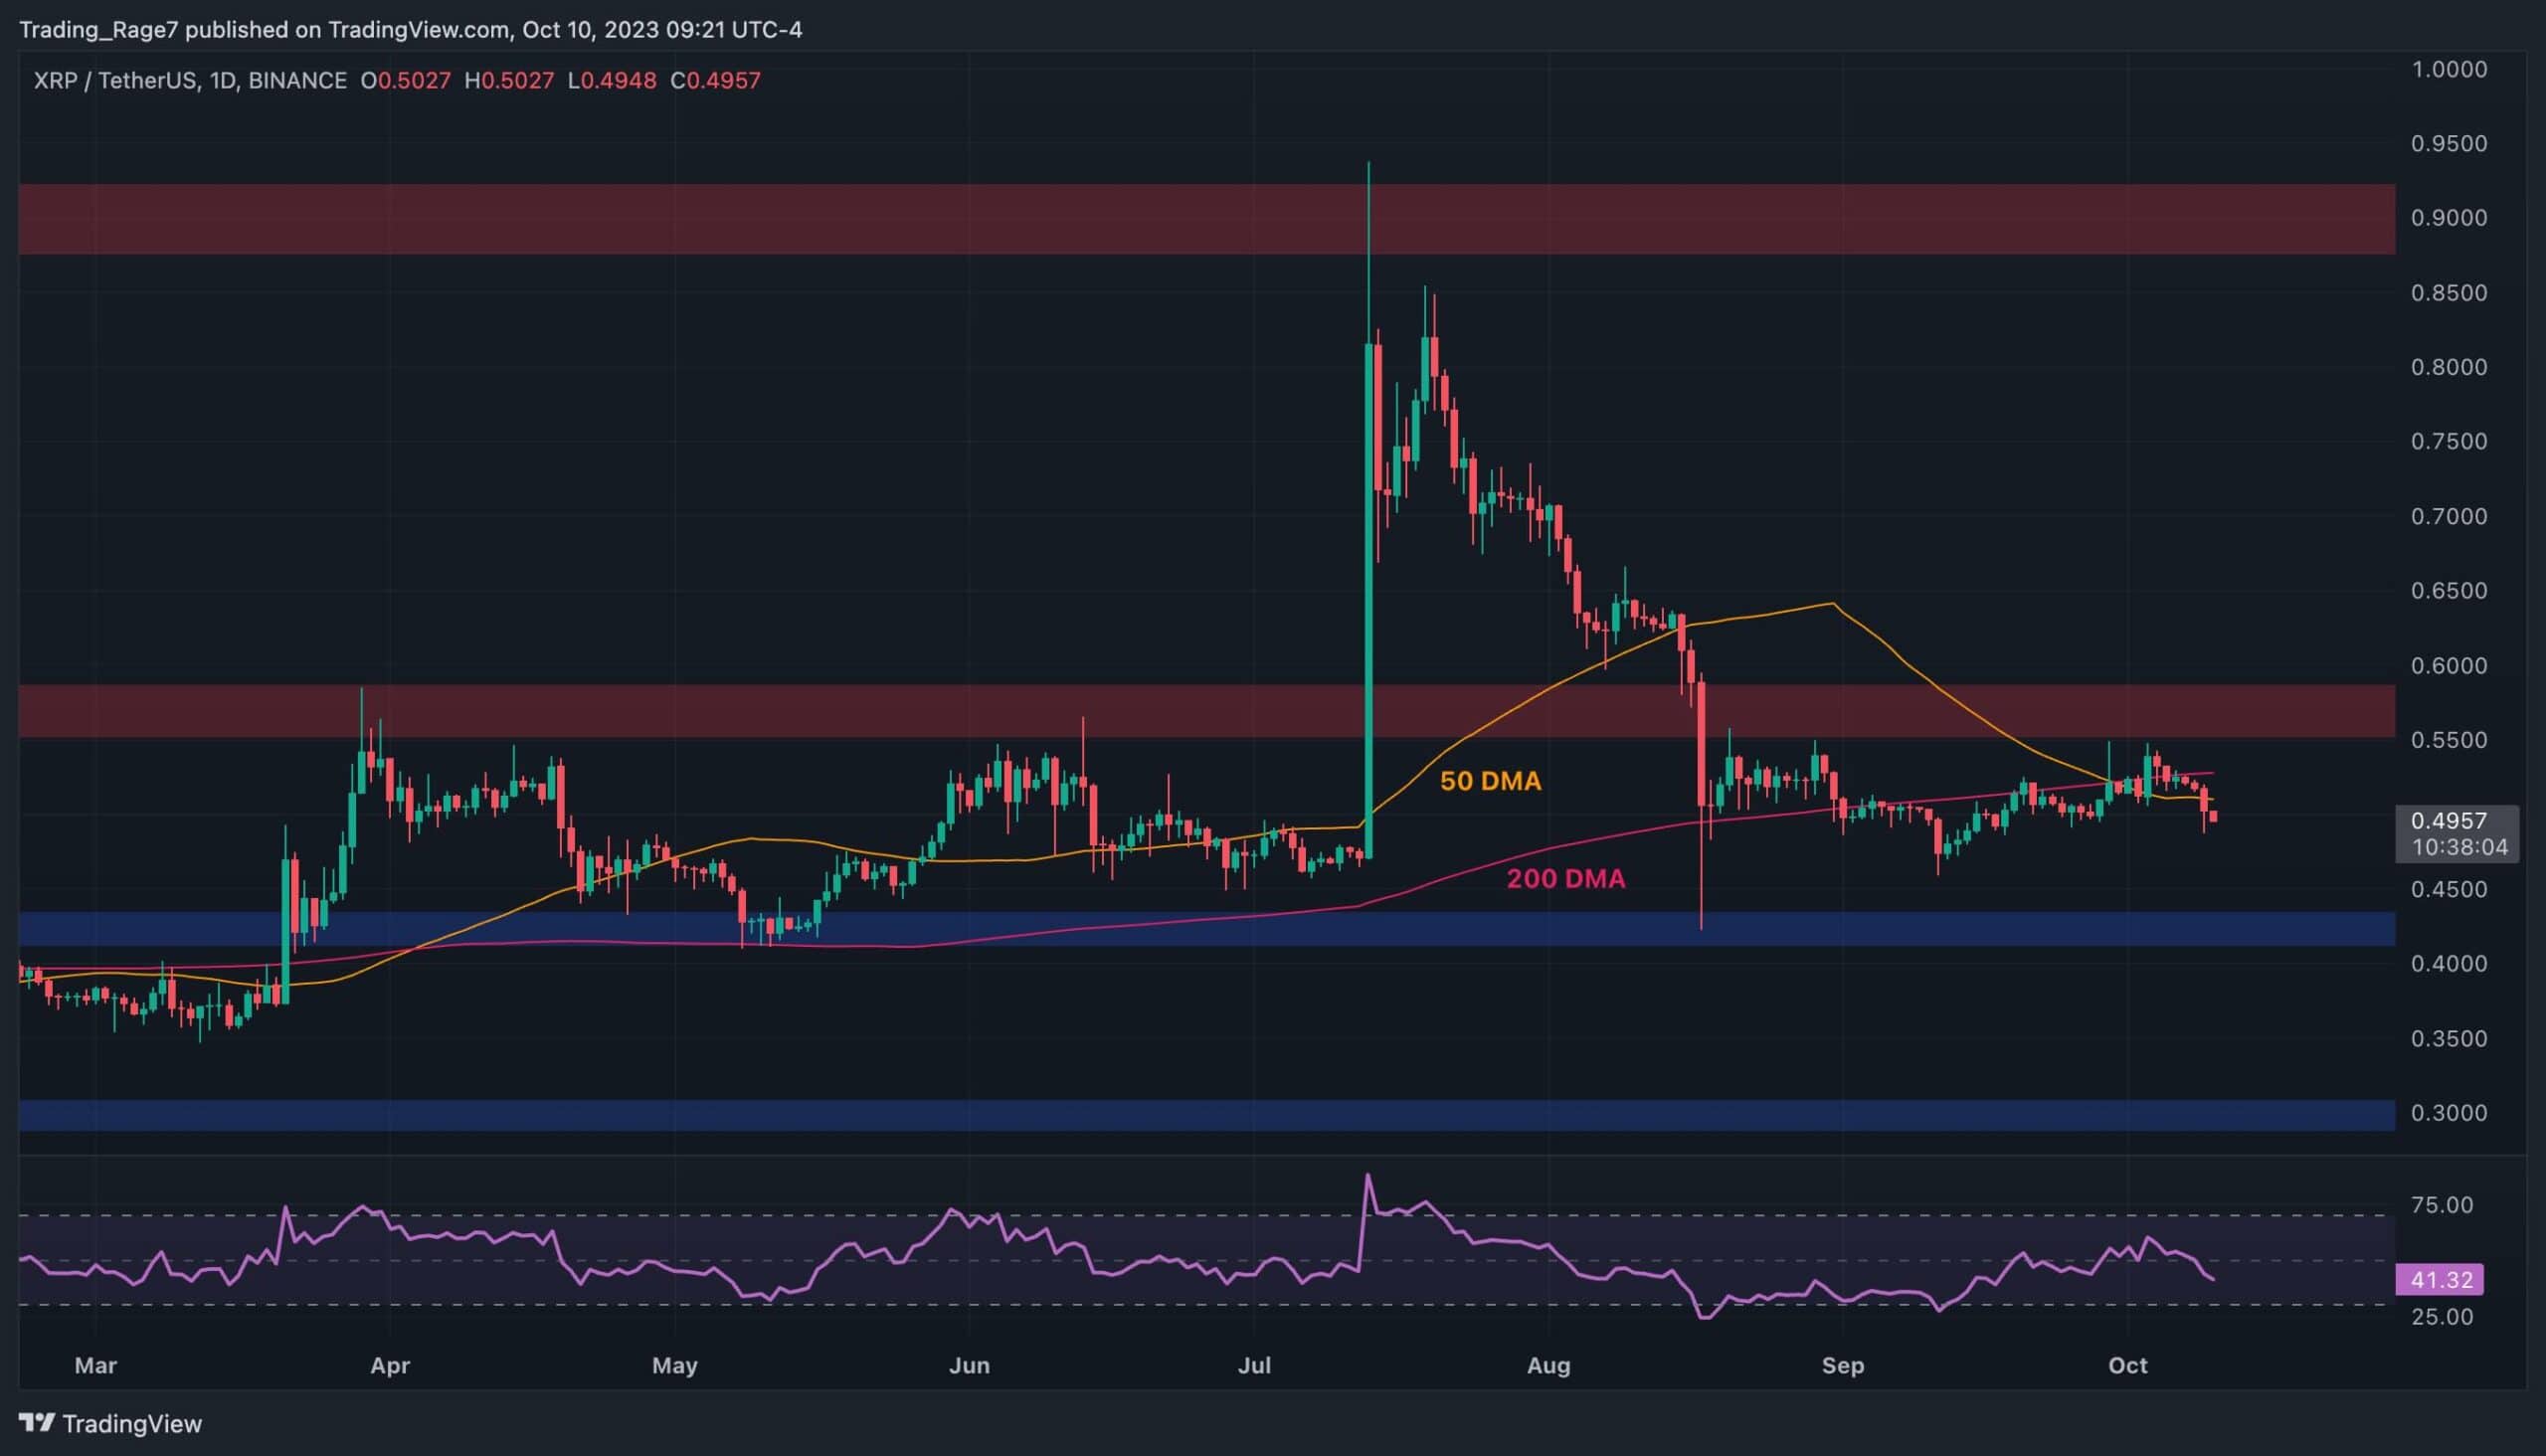
Against USD, XRP has been steadily climbing after a significant crash in August. It is currently trading within a narrow range between the 50-day and 200-day moving averages, around the $0.5 mark. If there is a bullish breakout, the market could reach the crucial $0.55 resistance zone, which will likely determine the mid-term market trend.
A successful break above this area would pave the way for the price to rise towards the $0.9 level once again. On the other hand, a rejection could have severe consequences, potentially causing the market to drop to the $0.4 level or even lower.

The BTC Paired Chart
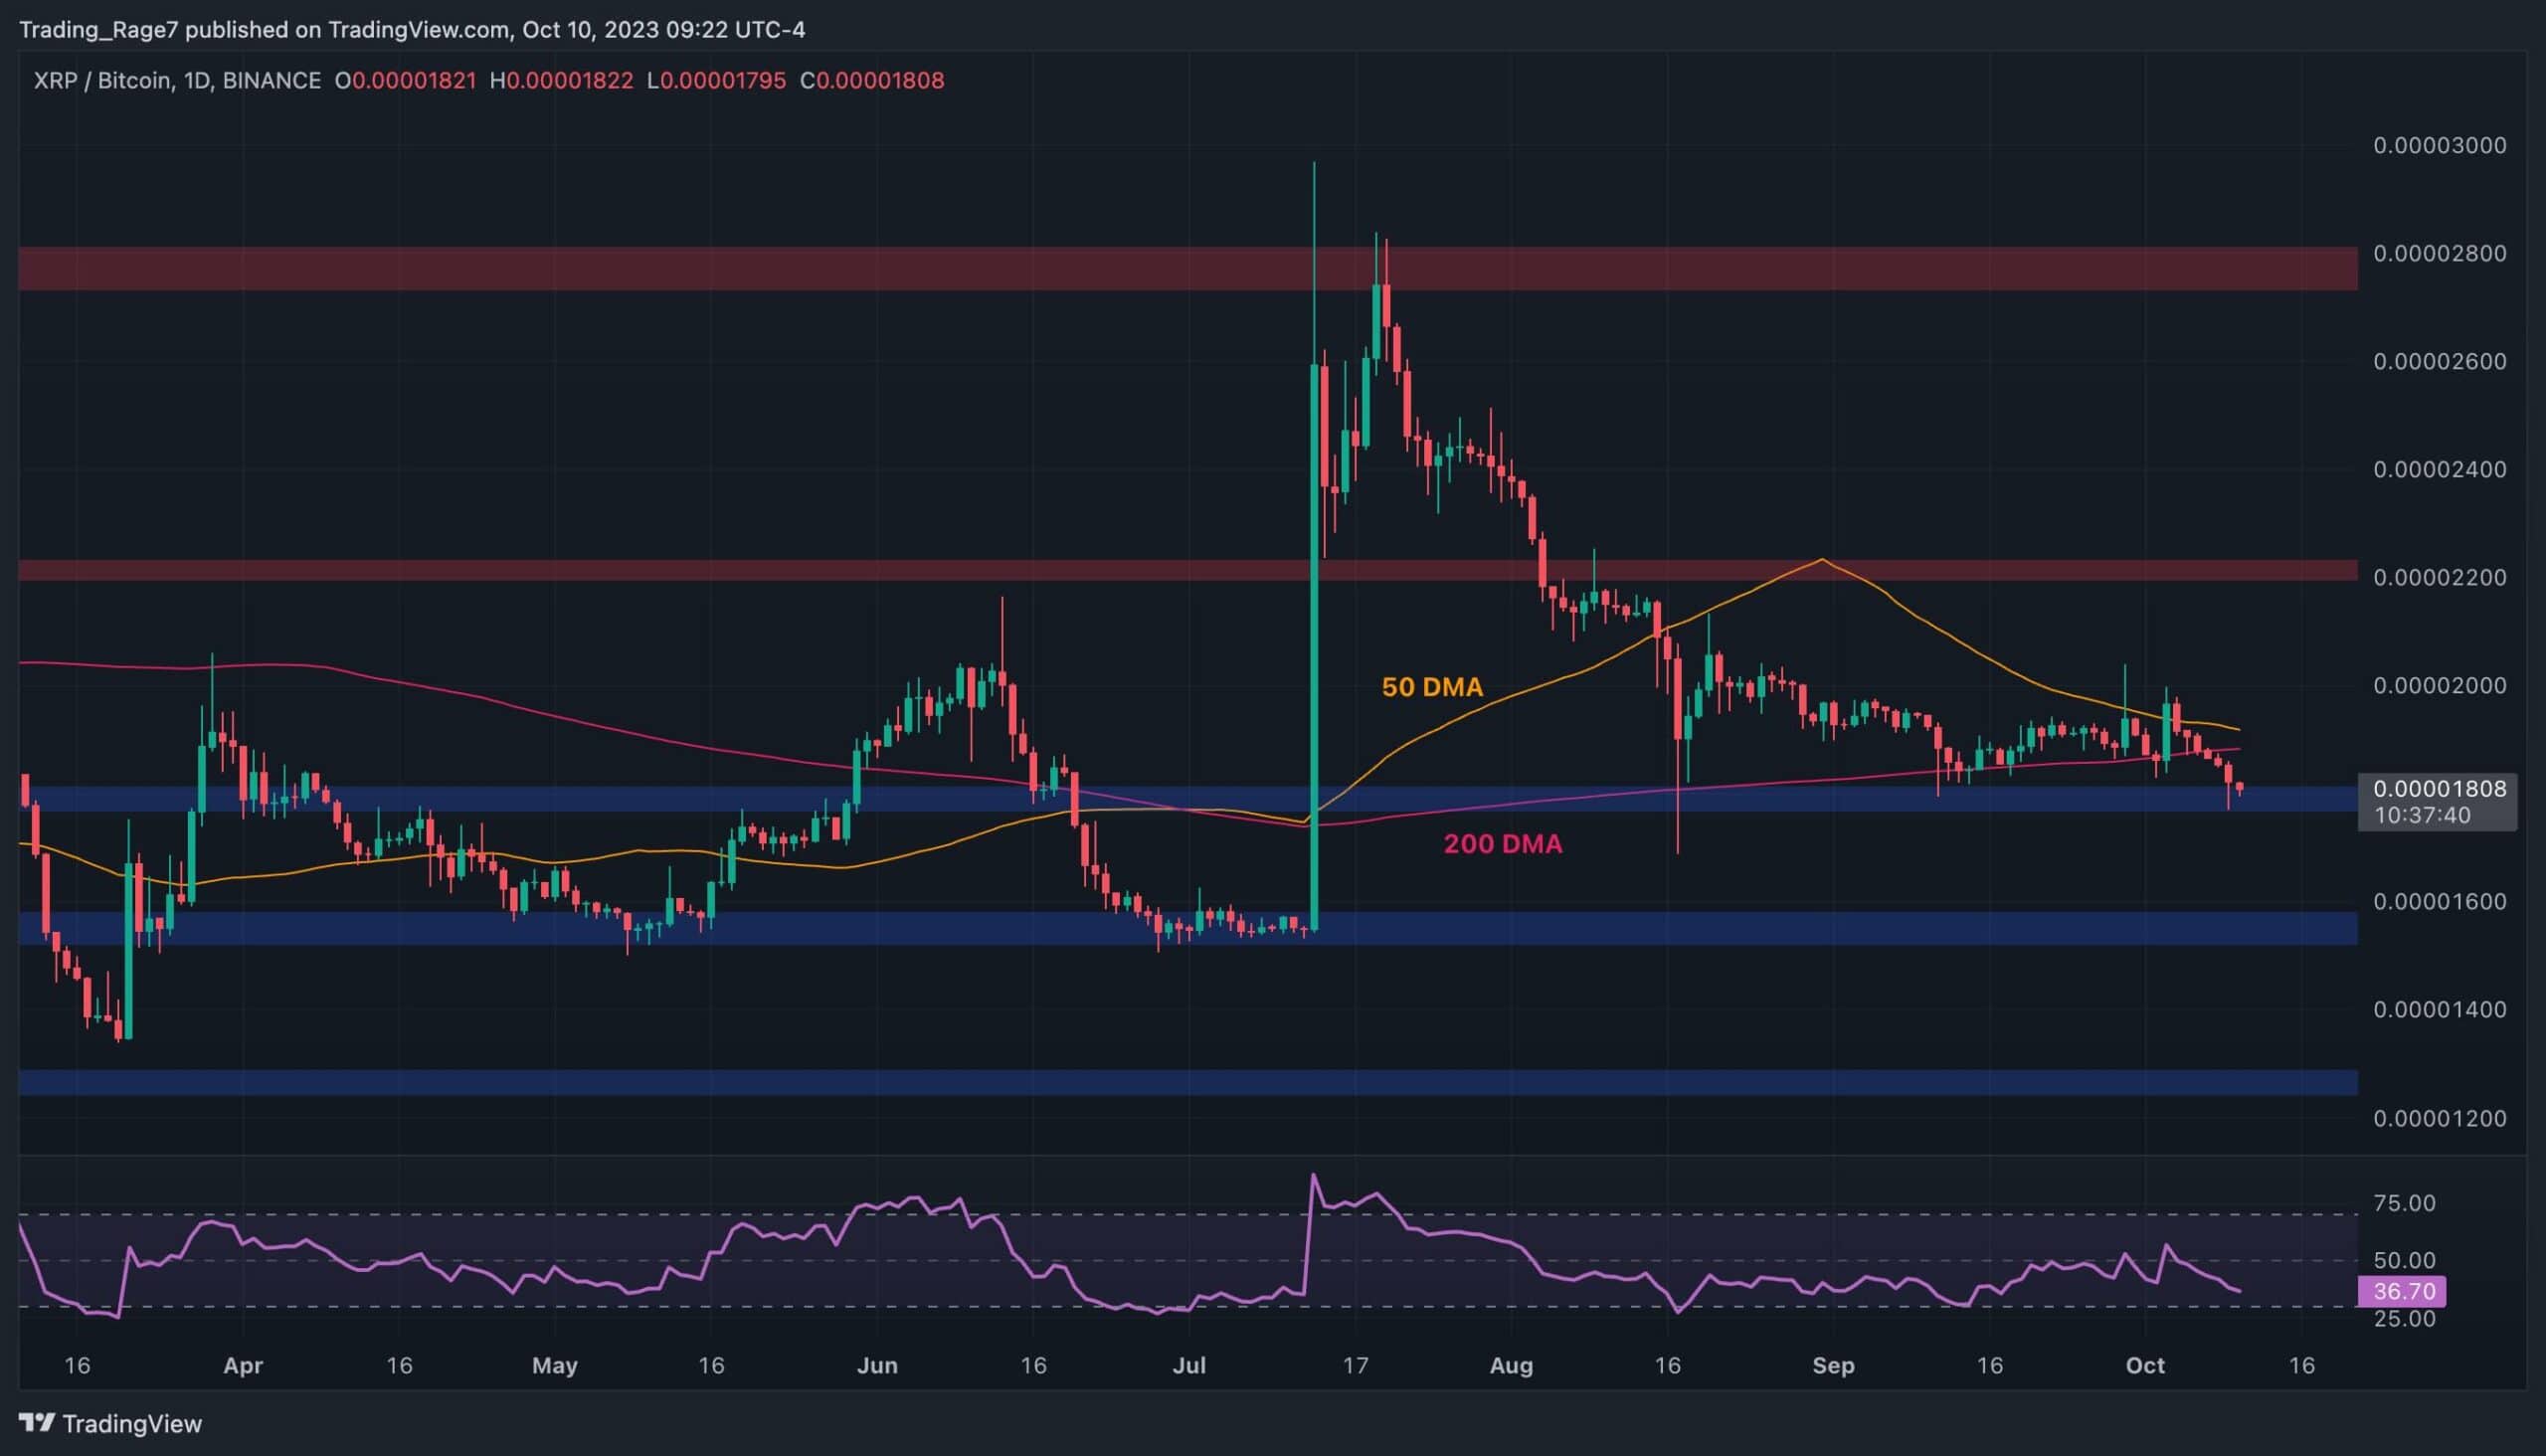
Against BTC, Ripple is painting a different picture. The price of XRP has been moving sideways in recent weeks, trading below both the 50-day and 200-day moving averages, which are located around the 1900 SAT mark.
The RSI indicator has also fallen below the 50% threshold, indicating that the momentum currently favors the sellers. The 1800 SAT support level is the only barrier preventing another crash toward the 1600 SAT zone. Investors should hope that this level holds for XRP to rebound higher.

The post Here are The Two Possible Outcomes for XRP This Week (Ripple Price Analysis) appeared first on CryptoPotato.


