Here Are the Most Probable Scenarios for XRP in the Coming Days (Ripple Price Analysis)
Ripple’s price has been relatively stagnant over the past week, showing little intent to move in either direction. However, analyzing nearby support and resistance levels and evaluating probable scenarios would be beneficial.
Technical Analysis
By Edris
XRP/USDT Price Analysis
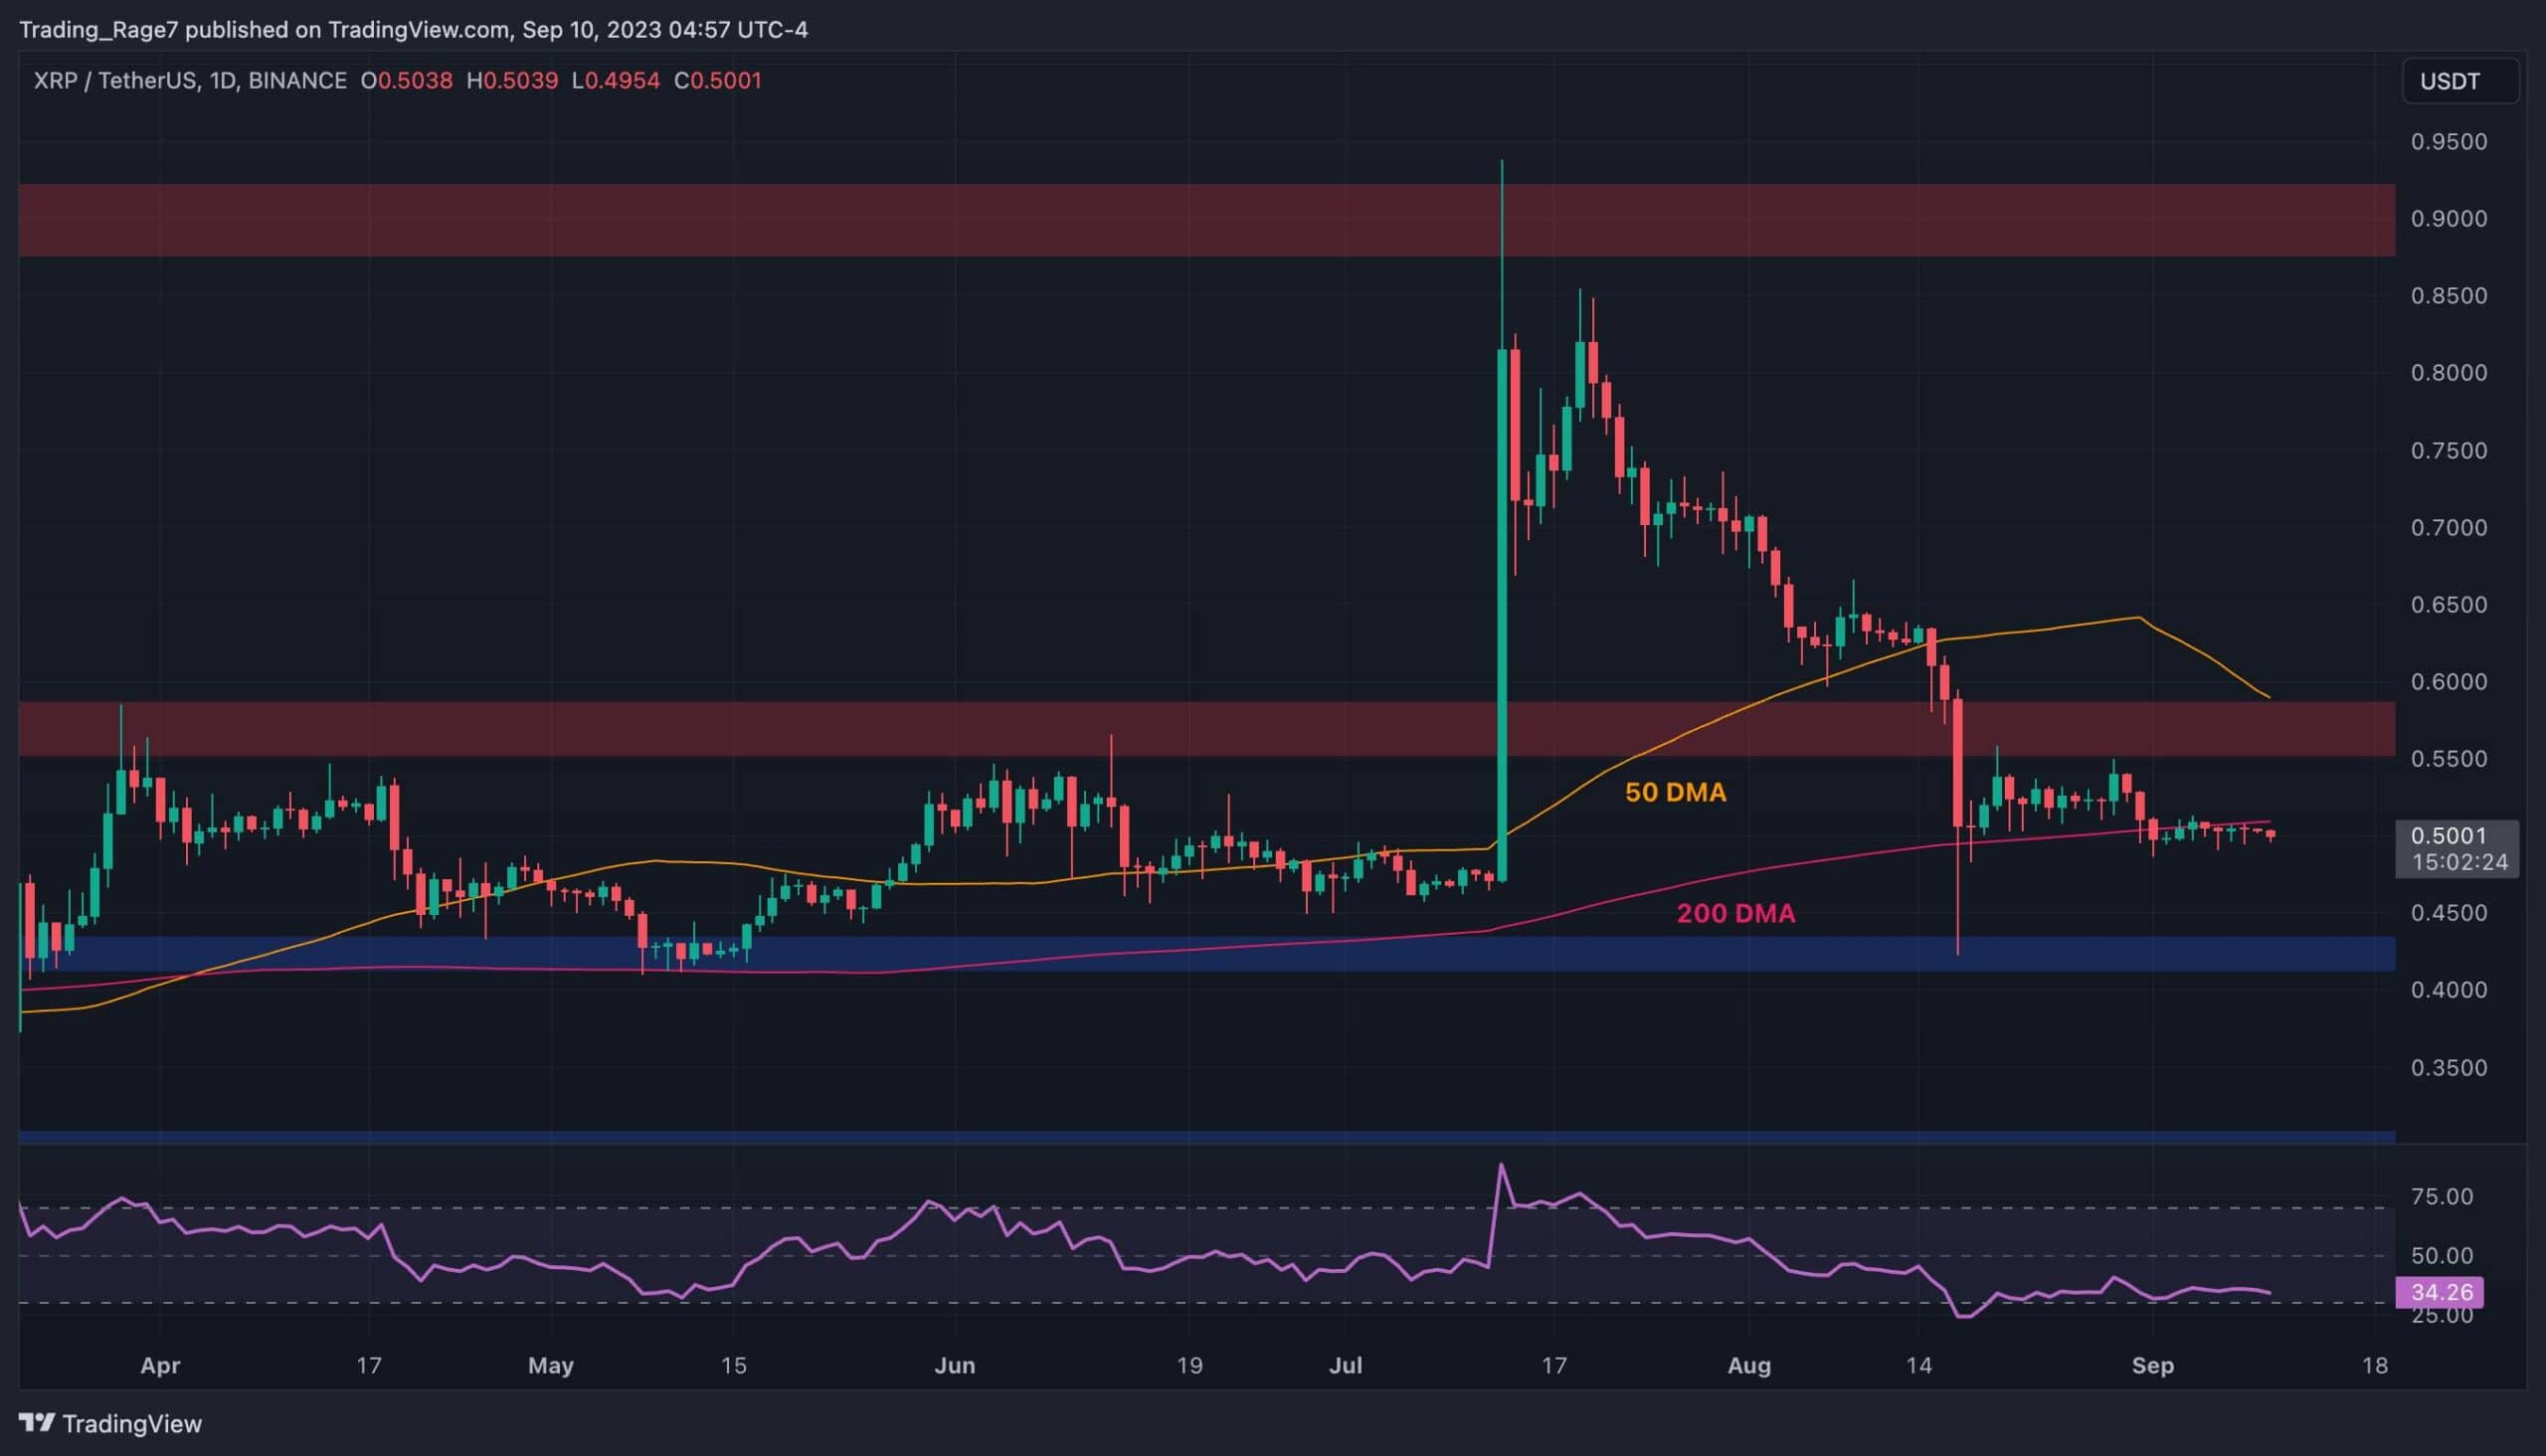
Against USDT, the price has been consolidating below the 200-day moving average, located around the $0.5 mark. It has failed to close above the mentioned moving average in the last few days.
The RSI indicator has been showing values below 50% for a while now, indicating that the momentum is in favor of the sellers. Therefore, at the moment, a bearish continuation towards the $0.43 level or even lower is more probable.
XRP/BTC Price Analysis
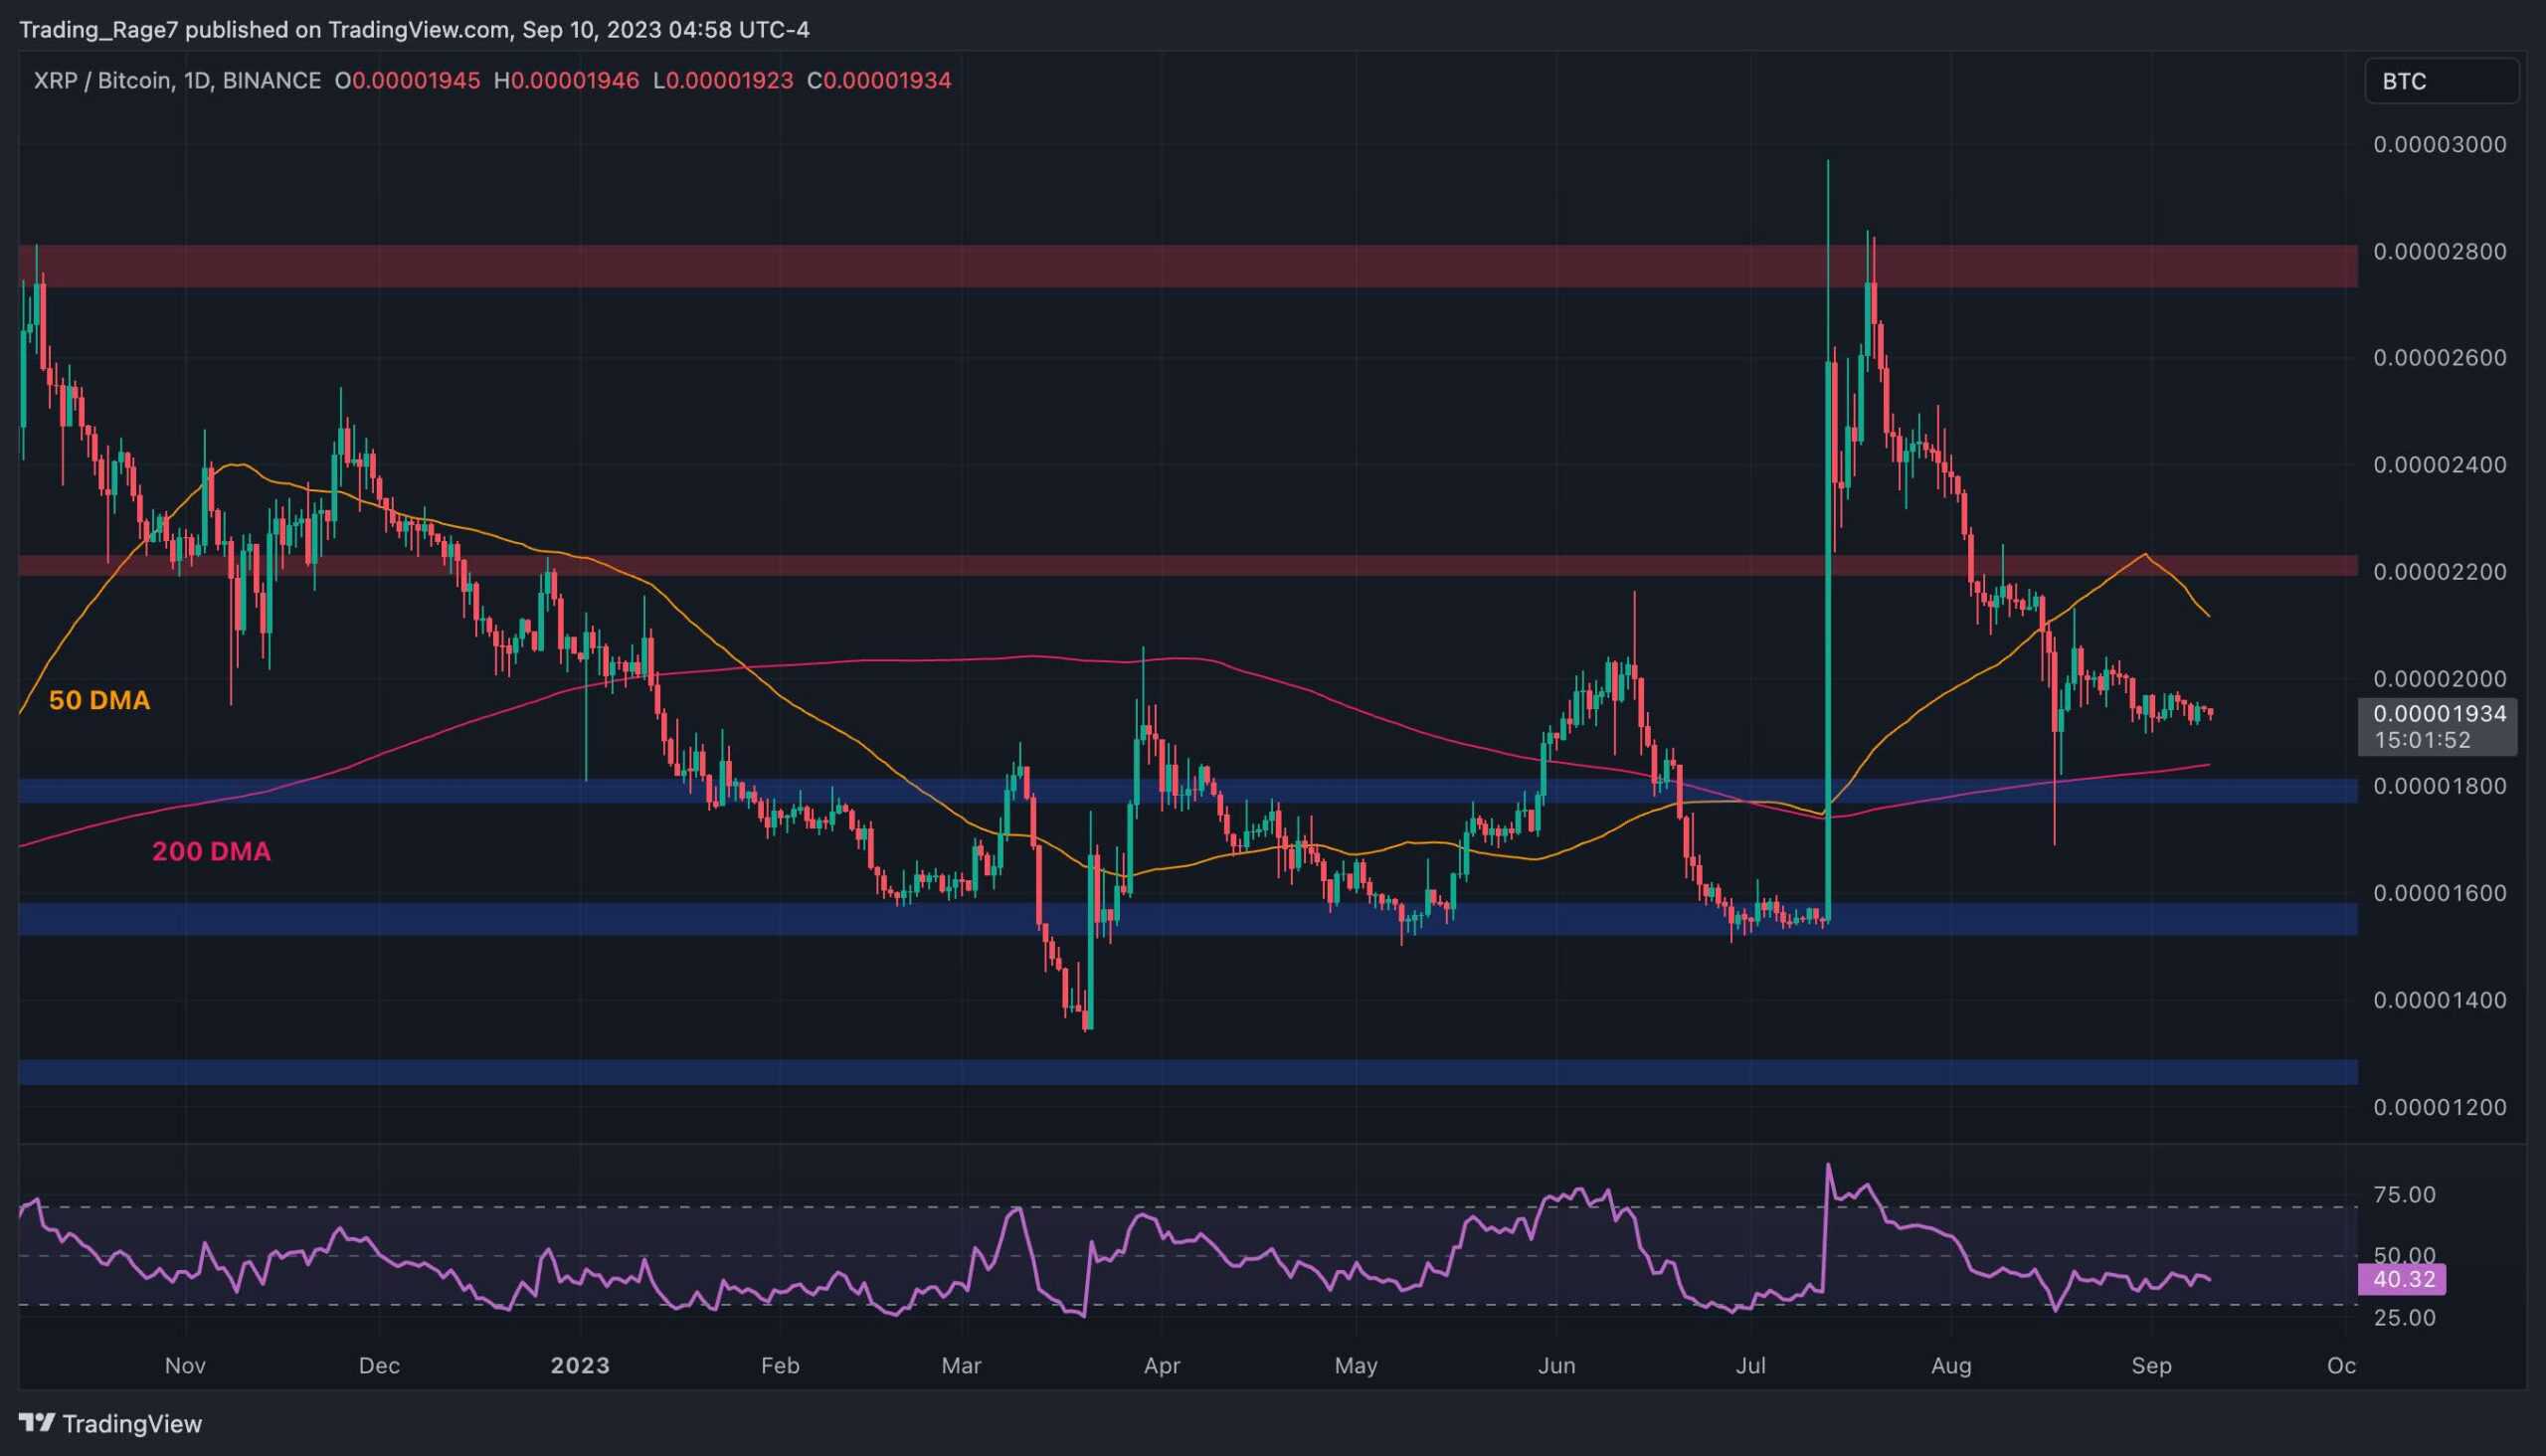
This chart shows that the price has gradually declined over the last few weeks, following a break below the 2200 SAT level and the 50-day moving average.
The RSI is also trending below 50%, and there is a high likelihood for the market to test the 200-day moving average around the 1900 SAT area and the 1800 SAT static support level. However, as long as the price trades above the 200-day moving average, investors can be optimistic as the trend is considered bullish overall.
The post Here Are the Most Probable Scenarios for XRP in the Coming Days (Ripple Price Analysis) appeared first on CryptoPotato.