Following the Crash Towards $26K, What’s Next for Bitcoin? (BTC Technical Analysis)
After a few weeks of consolidation, Bitcoin was unable to increase and eventually broke to the downside. This resulted in a considerable liquidation cascade and a drop below the critical support level of $30K.
Technical Analysis
Technical Analysis Shayan
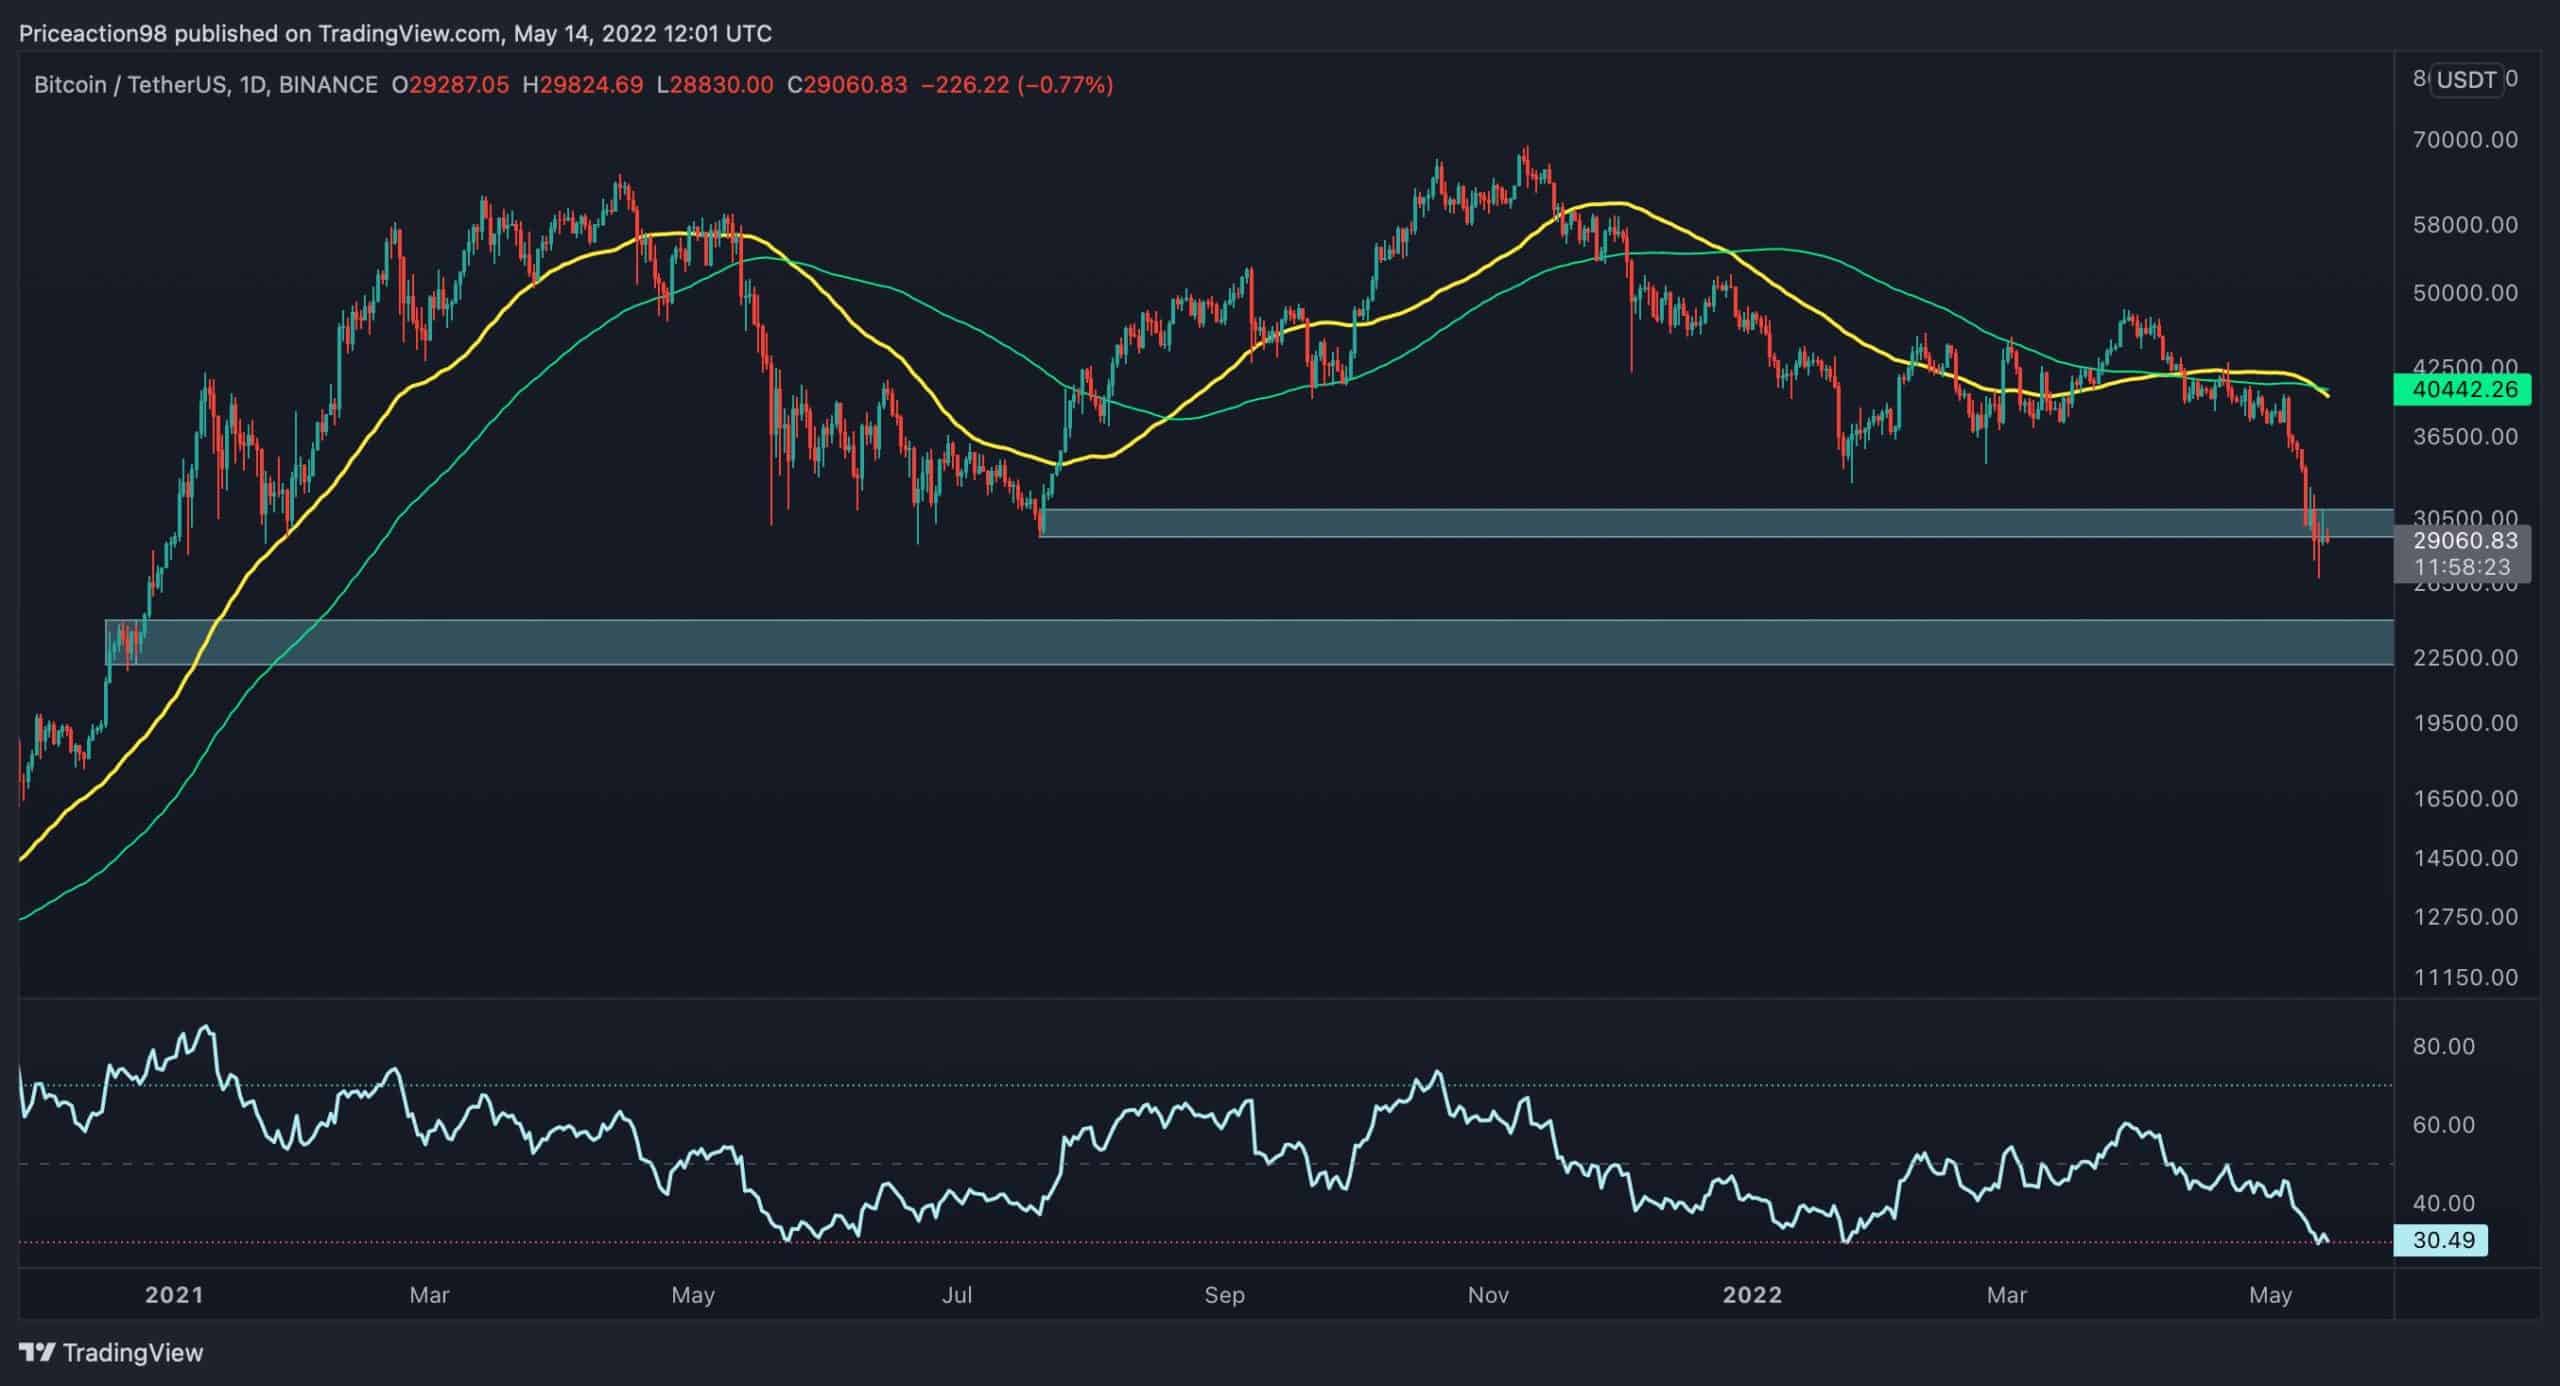
The Daily Chart
The market has now tapped the resting liquidity below the significant demand zone around $30K, but there are no signs of a reversal yet. Furthermore, the next support level for Bitcoin is $24K-$25K.
The RSI indicator, on the other hand, has crossed into the oversold zone and is seeking to break above it. This might signal a short-term reversal to the previously broken $30K-$32K level. The bears, on the other hand, have complete power, and a collapse to the $24K-$25K demand zone remains possible.
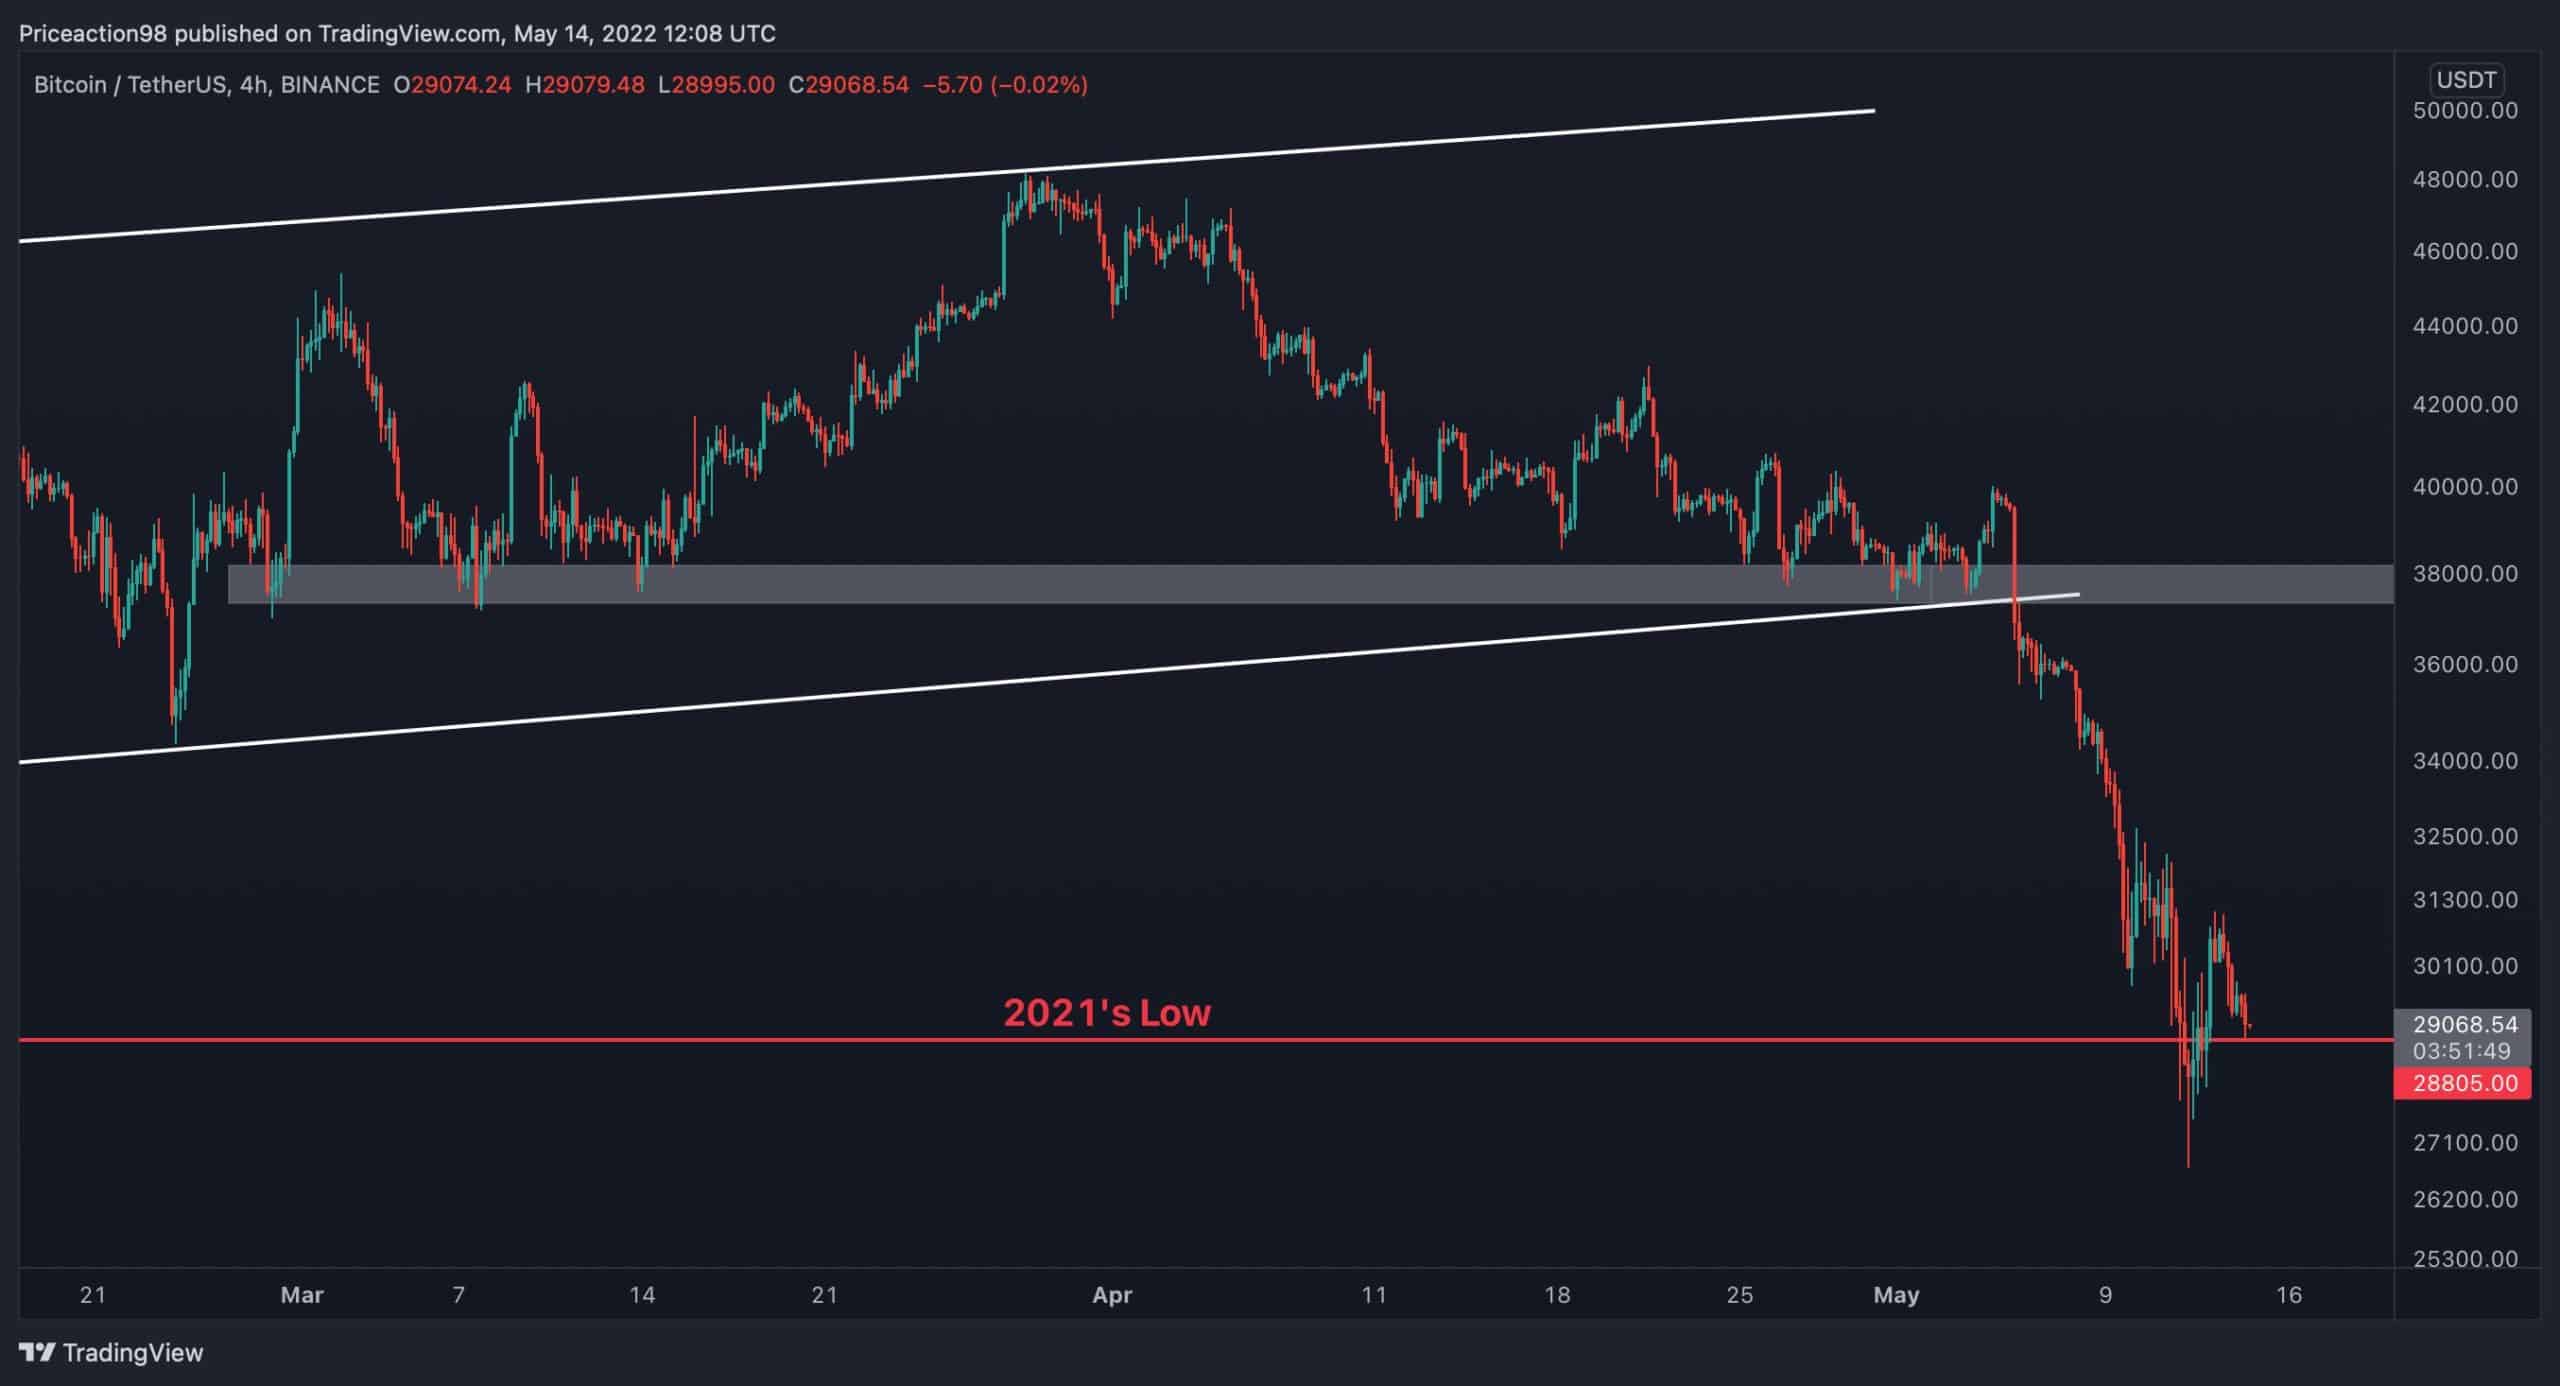
The 4-Hour Chart
Corrections are always present in a sustainable rally. After a massive bearish decline from $69K, Bitcoin has been building a continuation correction flag pattern and has lately broken below the lower trendline resulting in a massive cascade in the market. The price has finally broken the 2021’s low and registered a local bottom at $26K.
The last significant support at $37K has now become a key resistance level for the price, while the next support will be at the $24K-$25K demand region. Short-term consolidation and a range phase followed by choppy price action appear to be more likely in the coming weeks.
On-chain Analysis
By Shayan
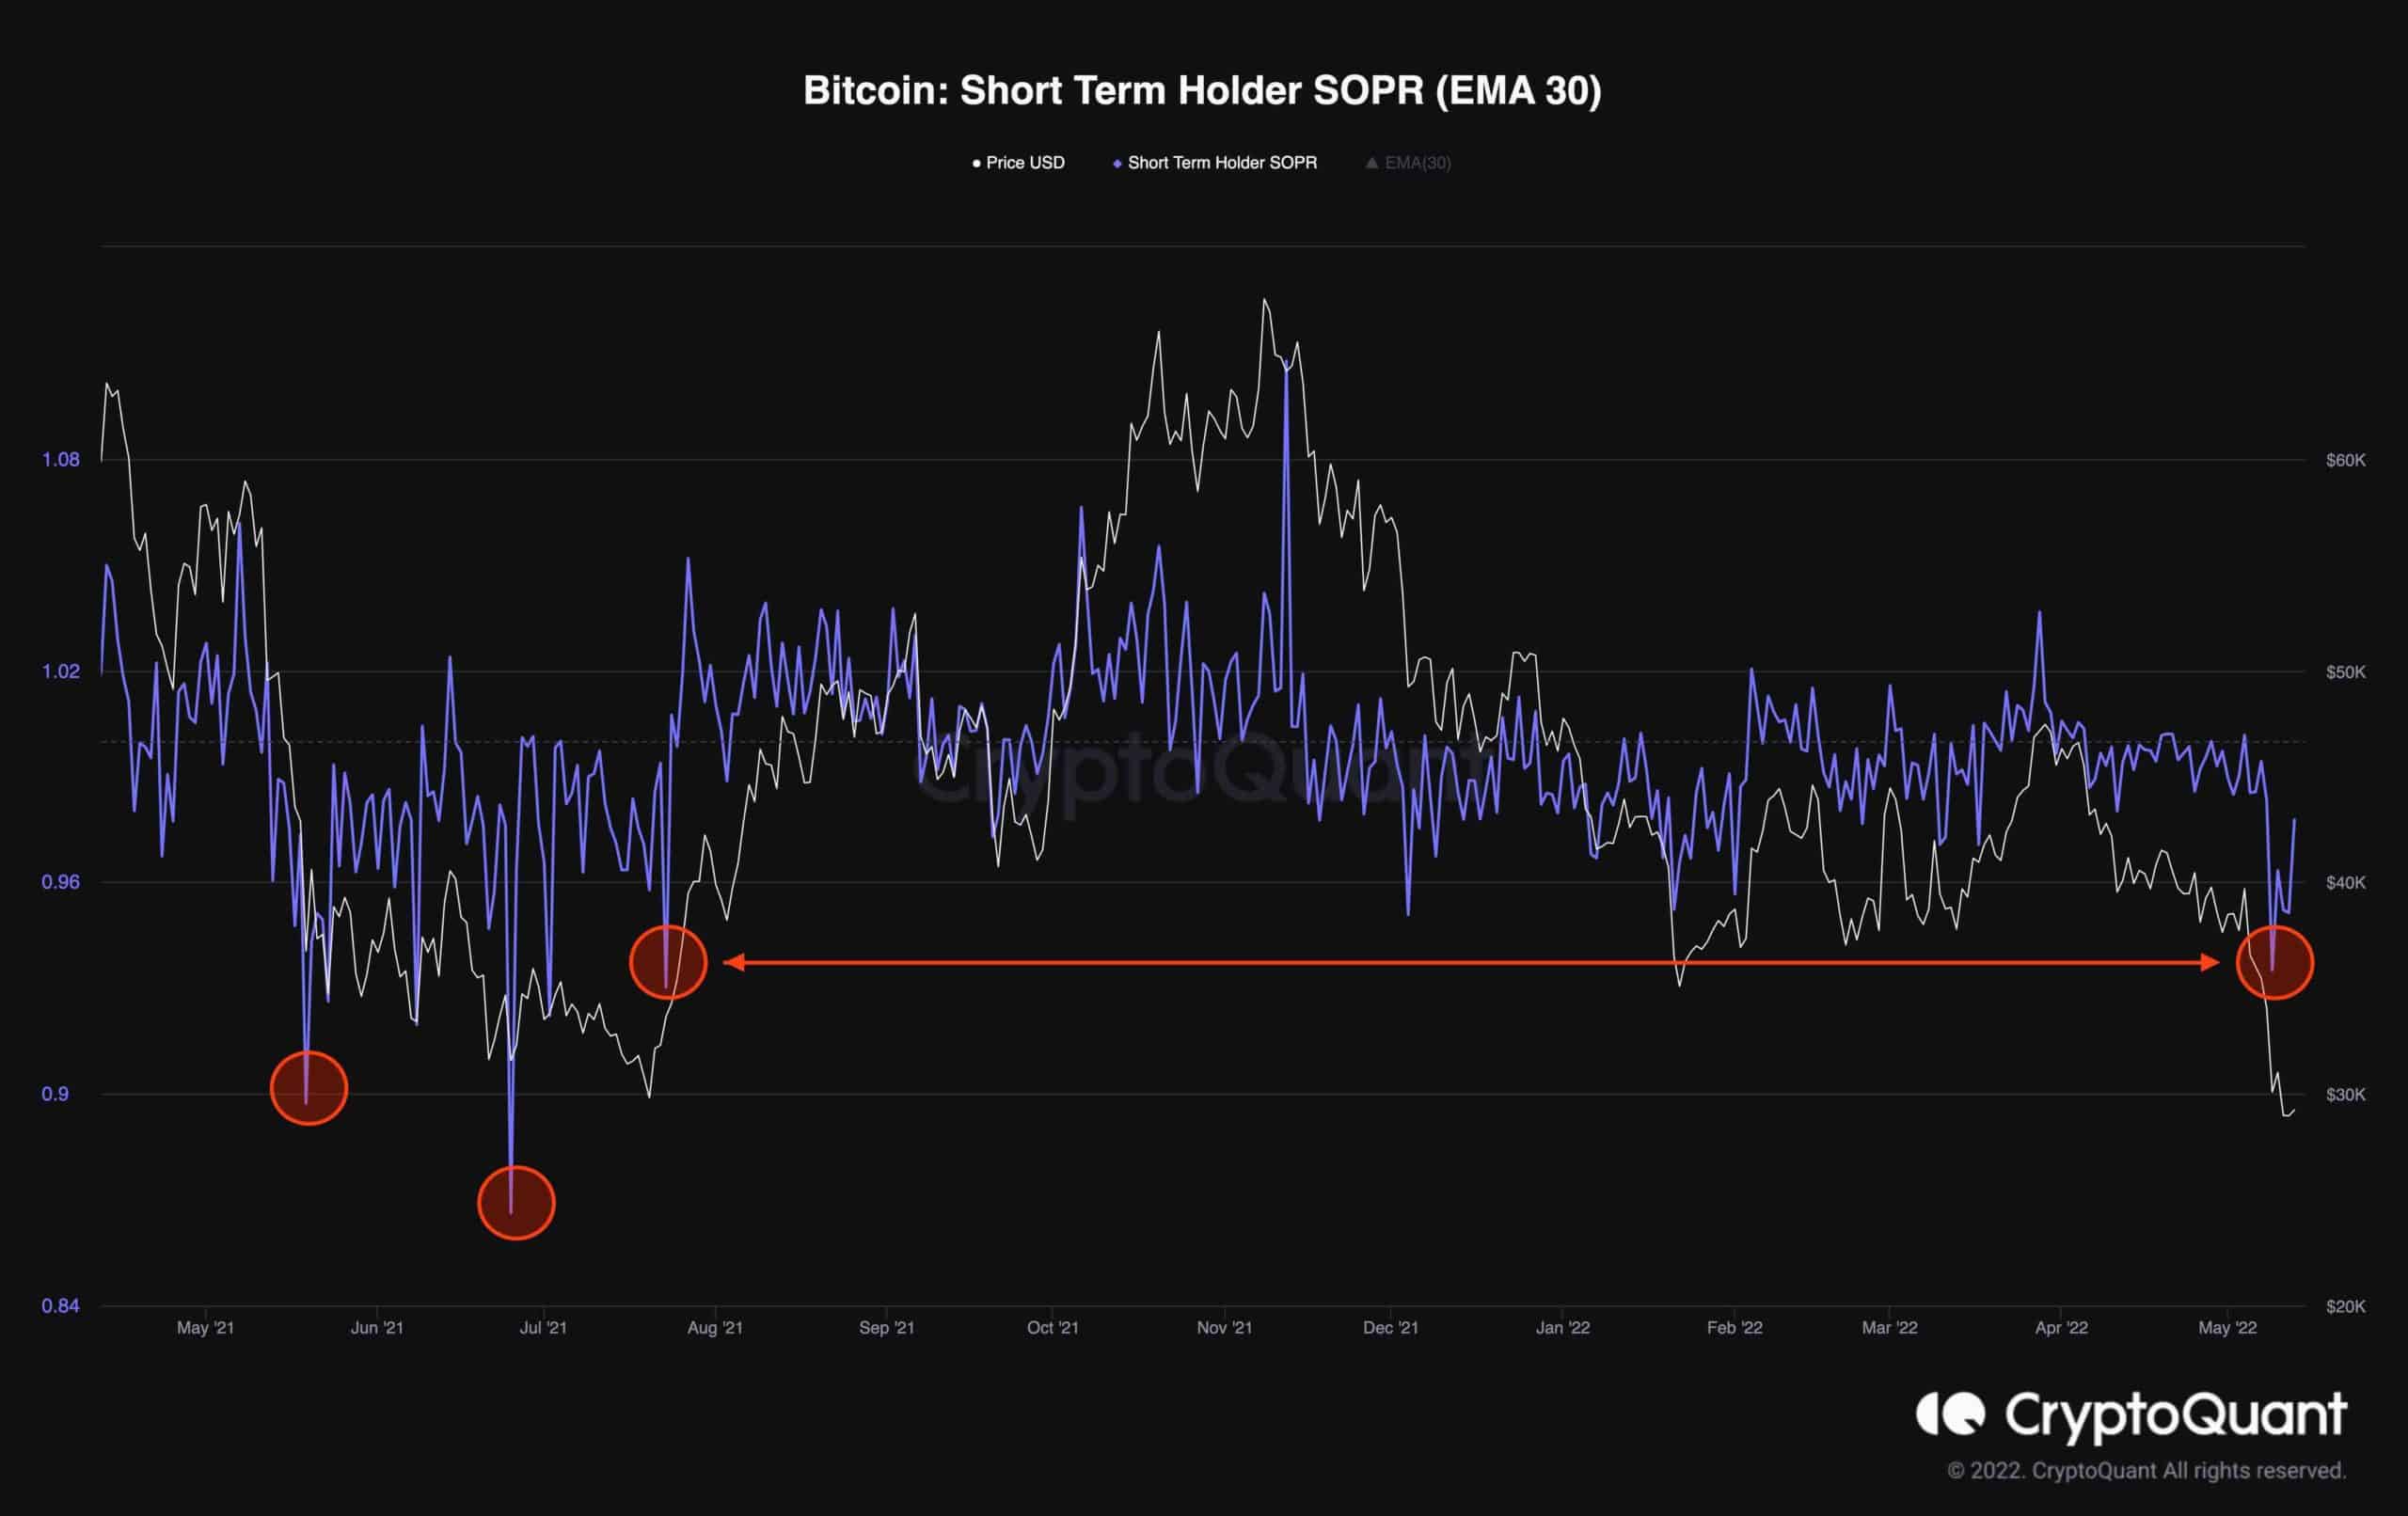
Bitcoin’s price collapsed to $26K recently. The Short-Term Holder SOPR has plummeted to a multi-month low, resulting in a severe crash, as shown in the chart.
The same situation occurred in July 2021, when Bitcoin plummeted to $29K before rebounding to a new high following the final capitulation. The STH-SOPR indicator, on the other hand, showed lower levels during the capitulation phase in May 2021 than it does presently. As a result, the market is in a state of panic and uncertainty, meaning that the pain might not be over yet.