Following the 2-Day Spike to $42K, Is Local Bottom Confirmed? (Bitcoin Price Analysis)
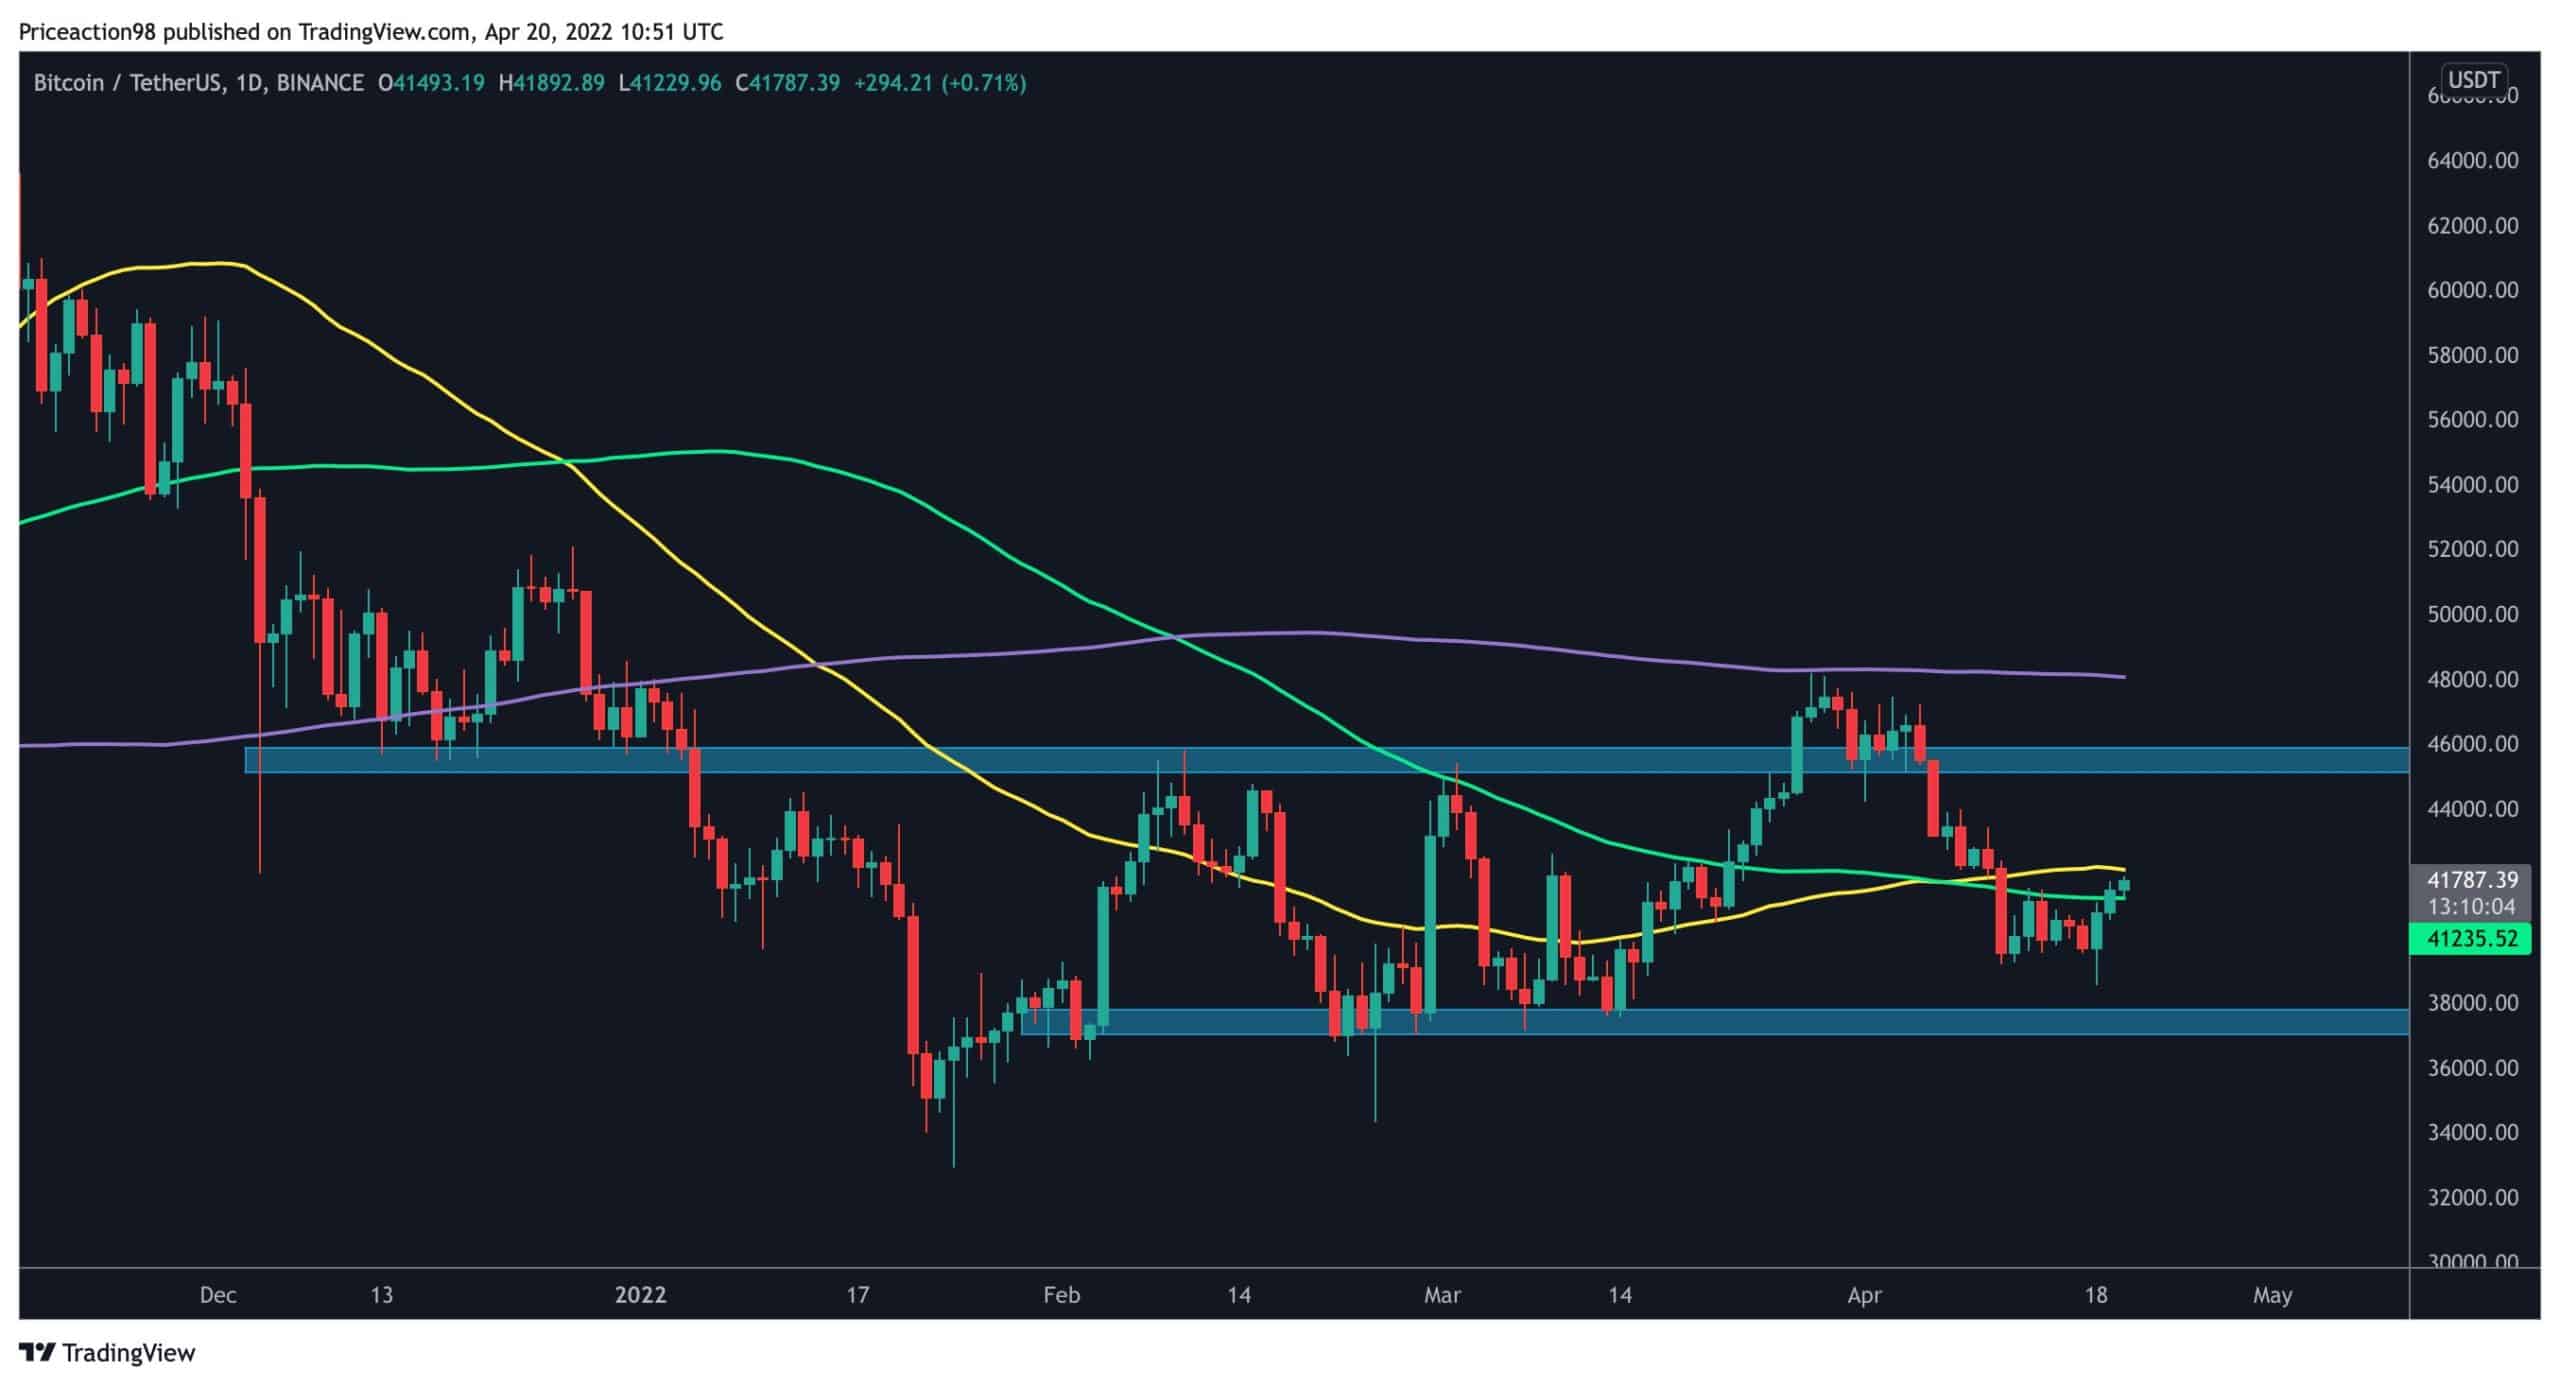
Last week, the 50-day and 100-day moving average lines went through a bullish crossover, but instead of holding the price, Bitcoin sharply dropped to lower levels. The good news is that the price quickly recovered, and even broke above the 100-day moving average, currently facing the crucial 50-day moving average line.
Technical Analysis
Technical Analysis By Shayan
The Daily Chart
Bitcoin is currently aiming to break through the 50-day moving average, which is the next key resistance. If it does, then another bullish run is anticipated. In that case, the next significant resistance level for Bitcoin is around the $45K key level, while – on the other hand – the first major support below $40K is around the $37K demand zone.

The 4-Hour Chart
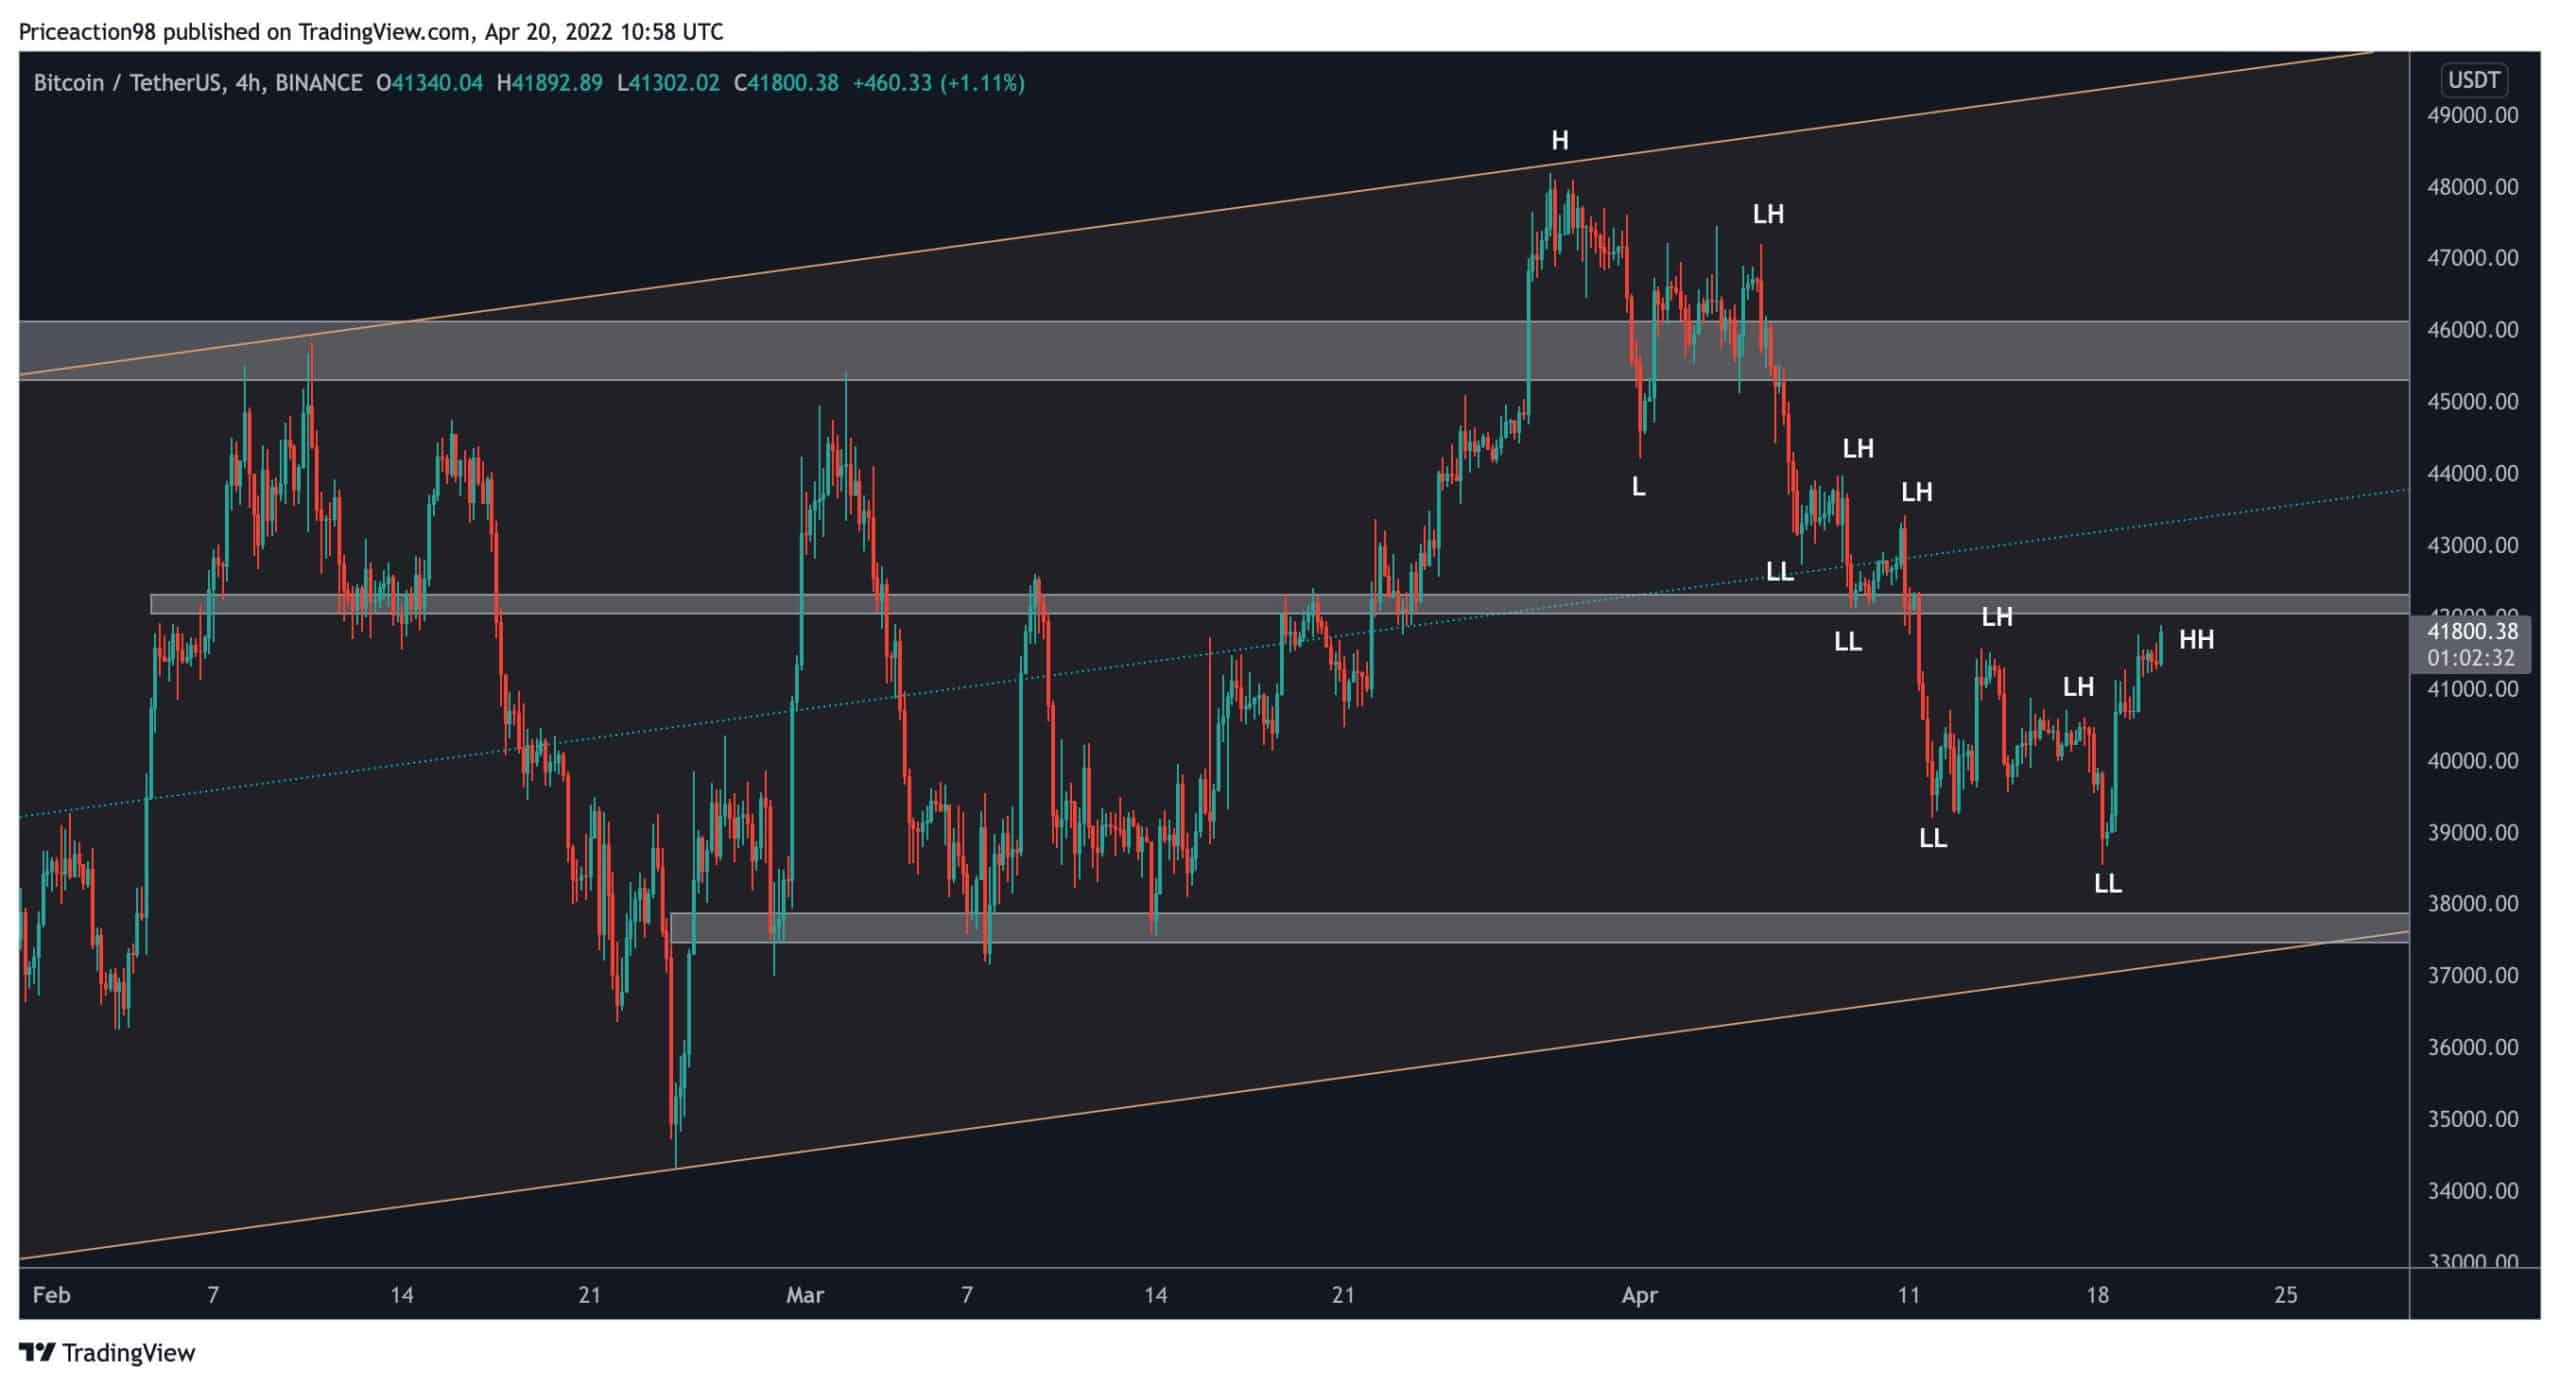
After Bitcoin was rejected by the $49K level on the lower timeframe charts, the price formed lower highs and lower lows pattern, which is a bearish trajectory.
However, the bears failed to push the price below the ascending channel’s lower trendline and the $36-37K support levels, while the bulls took control again and drove the price above the previous high.
Forming a higher high during a bearish leg is essential for a reversal and might indicate the end of the bearish momentum in the short term.
In addition, Bitcoin’s next short-term resistance level lies around $43K, and the price is presently aiming to break through this level and reach higher supply zones.

On-chain Analysis
On-chain Analysis By Edris
Exchange Inflow SOAB
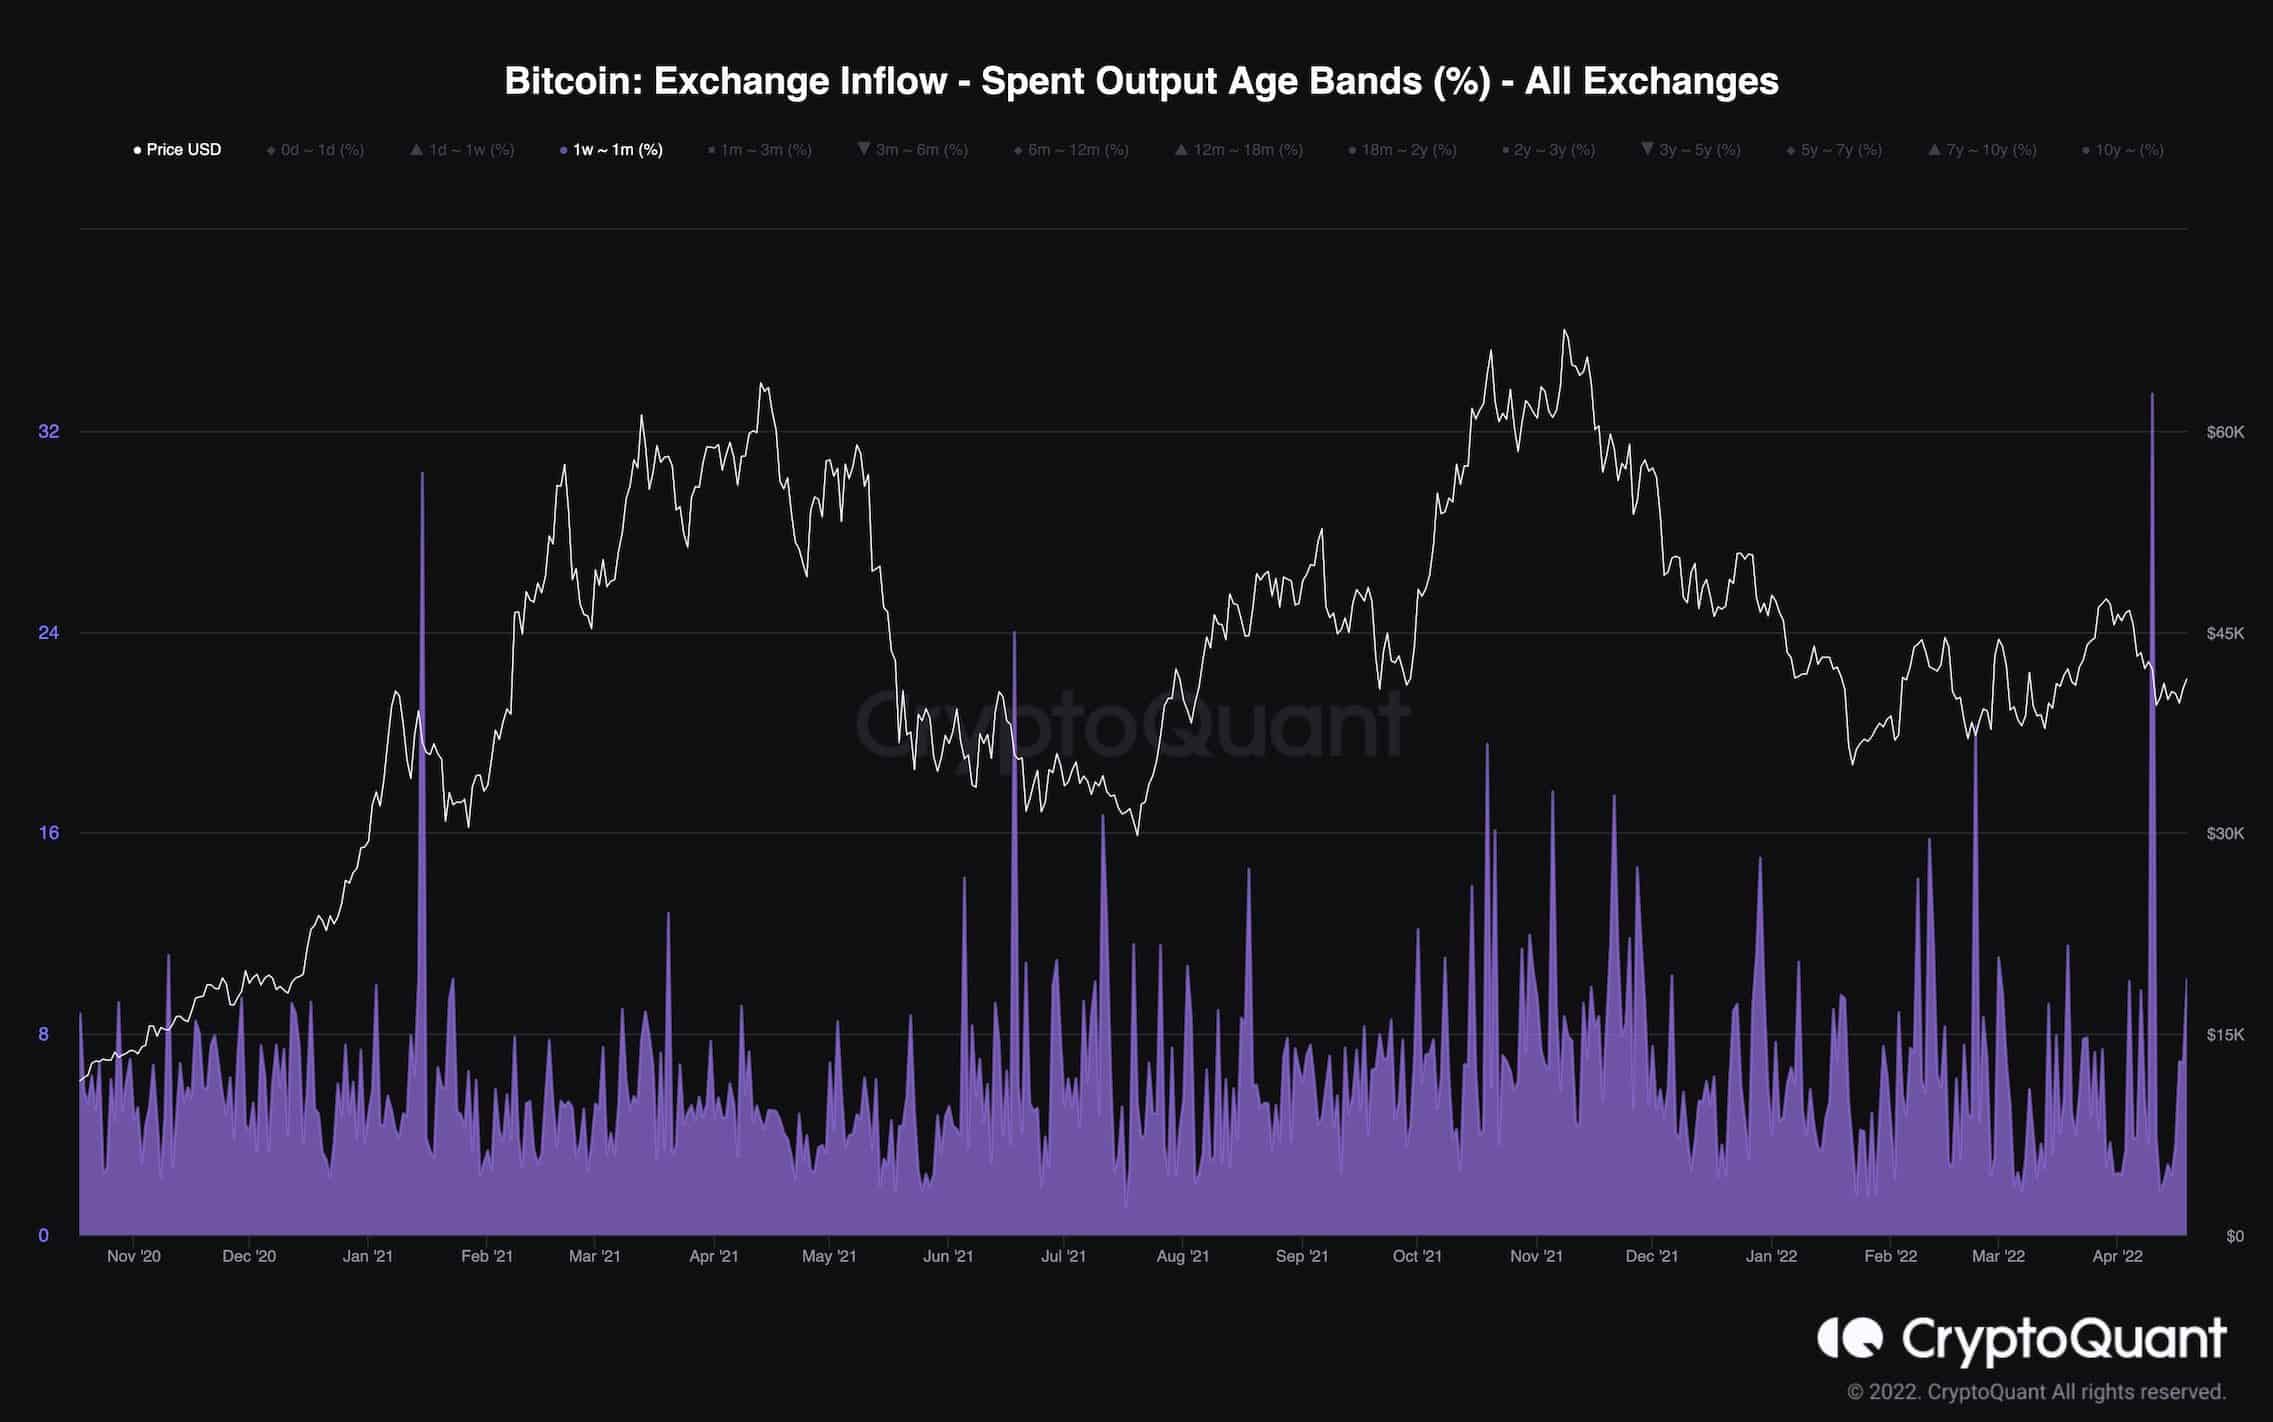
The Exchange Inflow SOAB is a valuable metric to determine which cohorts deposit their coins into the exchanges. These groups are divided by their holding time, and the 1-week to the 1-month group is demonstrated on this chart.
Data shows that these market participants who entered last month had sold a massive amount of their coins when the price broke below the $42K area.
Many retail traders have counted on this level as critical support, and once the price broke below, they had no choice but to capitulate.
Many of these traders bought the $48K local top and sold at a substantial loss. These huge short-term holders’ capitulations could point that a local bottom may be near if the smart money meets this massive supply coming back into circulation with sufficient demand.


