Following an Unusual Stable Week, Bitcoin Has Broken Down To Major Support Area – BTC Price Analysis Mar.4
In our previous price analysis from two days ago we’ve written the following:
“Bitcoin doesn’t like stability. Hence, we are expecting a major move to take place in the next 24 – 48 hours […] The direction of the anticipated move we are expecting is still unknown. However, the momentum is in favor of the bears, as of now.”
As could be seen, this early morning Bitcoin made a $120 drop to a current low of $3687 (Bitstamp). This came across following a week-long of consolidation around $3800.
What does this mean? Is Bitcoin back to being bearish? Time will tell. As of now, some major support levels are holding the coin, preventing a further drop.
Total Market Cap: $127 Billion
BTC Dominance: 52.4%
Looking at the 1-day & 4-hour charts
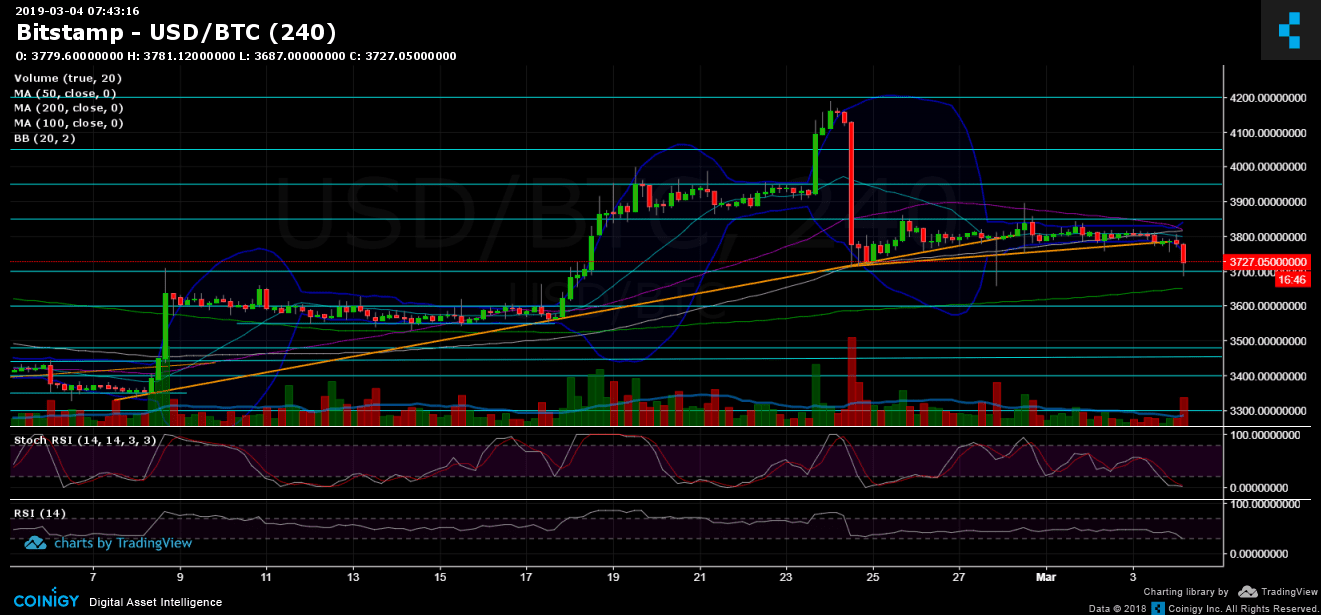
– As mentioned before, the week-long consolidation of Bitcoin had formed a bear flag. As can be seen on the 4-hour chart, the flag had broken down around the $3800 area, which triggered the $120 bearish move.
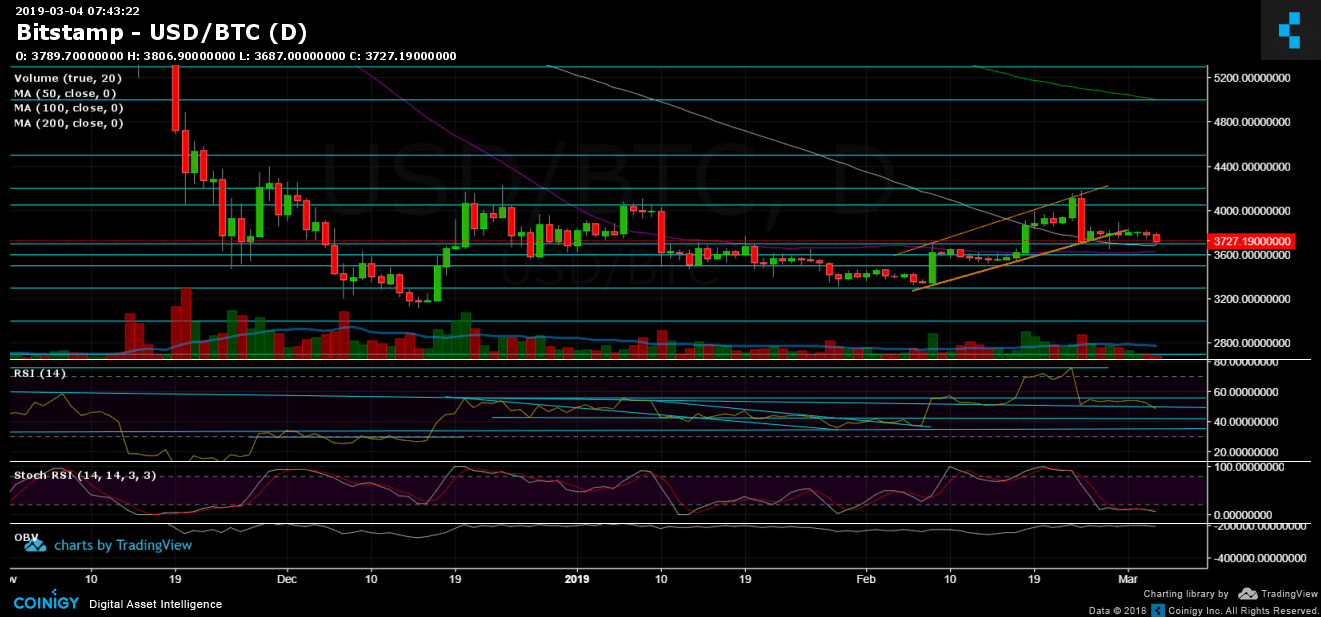
– Support/Resistance: Following the breakdown of the $3800 range, Bitcoin had found support upon the daily 100-days moving average line (marked in white), along with the $3700 support level. The next significant support lies around the $3600 mark (along with the 1-day’s chart significant 50-days moving average, marked in purple) and the famous $3480 – $3500 support area.
From the bull side, support-turned-resistance levels lie at $3800 and $3850. Further above lies the $3900 and $4050 resistance areas. As we could see throughout the past week, the $3850 resistance is a tough one for Bitcoin.
– The daily chart’s RSI level: Following our previous analysis, the Stochastic RSI Oscillator hadn’t crossed over yet, but still in the oversold area. The daily RSI indicator is reaching support of the descending trend-line. Holding up this area could be crucial for BTC for staying above $3700.
– The daily trading volume: Over the past week, the volume is decreasing from day to day. However, the recent hours brought some selling power into the market.
– BitFinex open short positions: There are now 17.9K BTC of open short positions. The shorts number is still between the tight range of 19K BTC resistance from above and the 17K support line (the lowest point since August 2018) from below. This is a fragile and dangerous spot.
BTC/USD BitStamp 4-Hour chart
BTC/USD BitStamp 1-Day chart
The post Following an Unusual Stable Week, Bitcoin Has Broken Down To Major Support Area – BTC Price Analysis Mar.4 appeared first on CryptoPotato.