Ethereum Tumbles 5% Weekly, Here’s the Imminent Support to Watch (ETH Price Chart)
Ethereum’s price has been oscillating in a tight range below the $2,000 psychological resistance level, failing to break higher. Yet, several support zones are available for investors to feel confident that the market will not crash.
Technical Analysis
By: Edris
The Daily Chart:
On the daily chart, the price has been going through choppy action, following the breakout above the $1,800 level and the 50-day moving average around the $1,850 mark.
The aforementioned moving average is currently providing support for the market. However, in case of a breakdown, the $1,800 level and the 200-day moving average trending around the $1,700 mark are potential support elements for the price to rebound.
Moreover, the RSI indicator provides little insight into this timeframe, as it has been running flat around the 50% threshold, indicating momentum equilibrium.

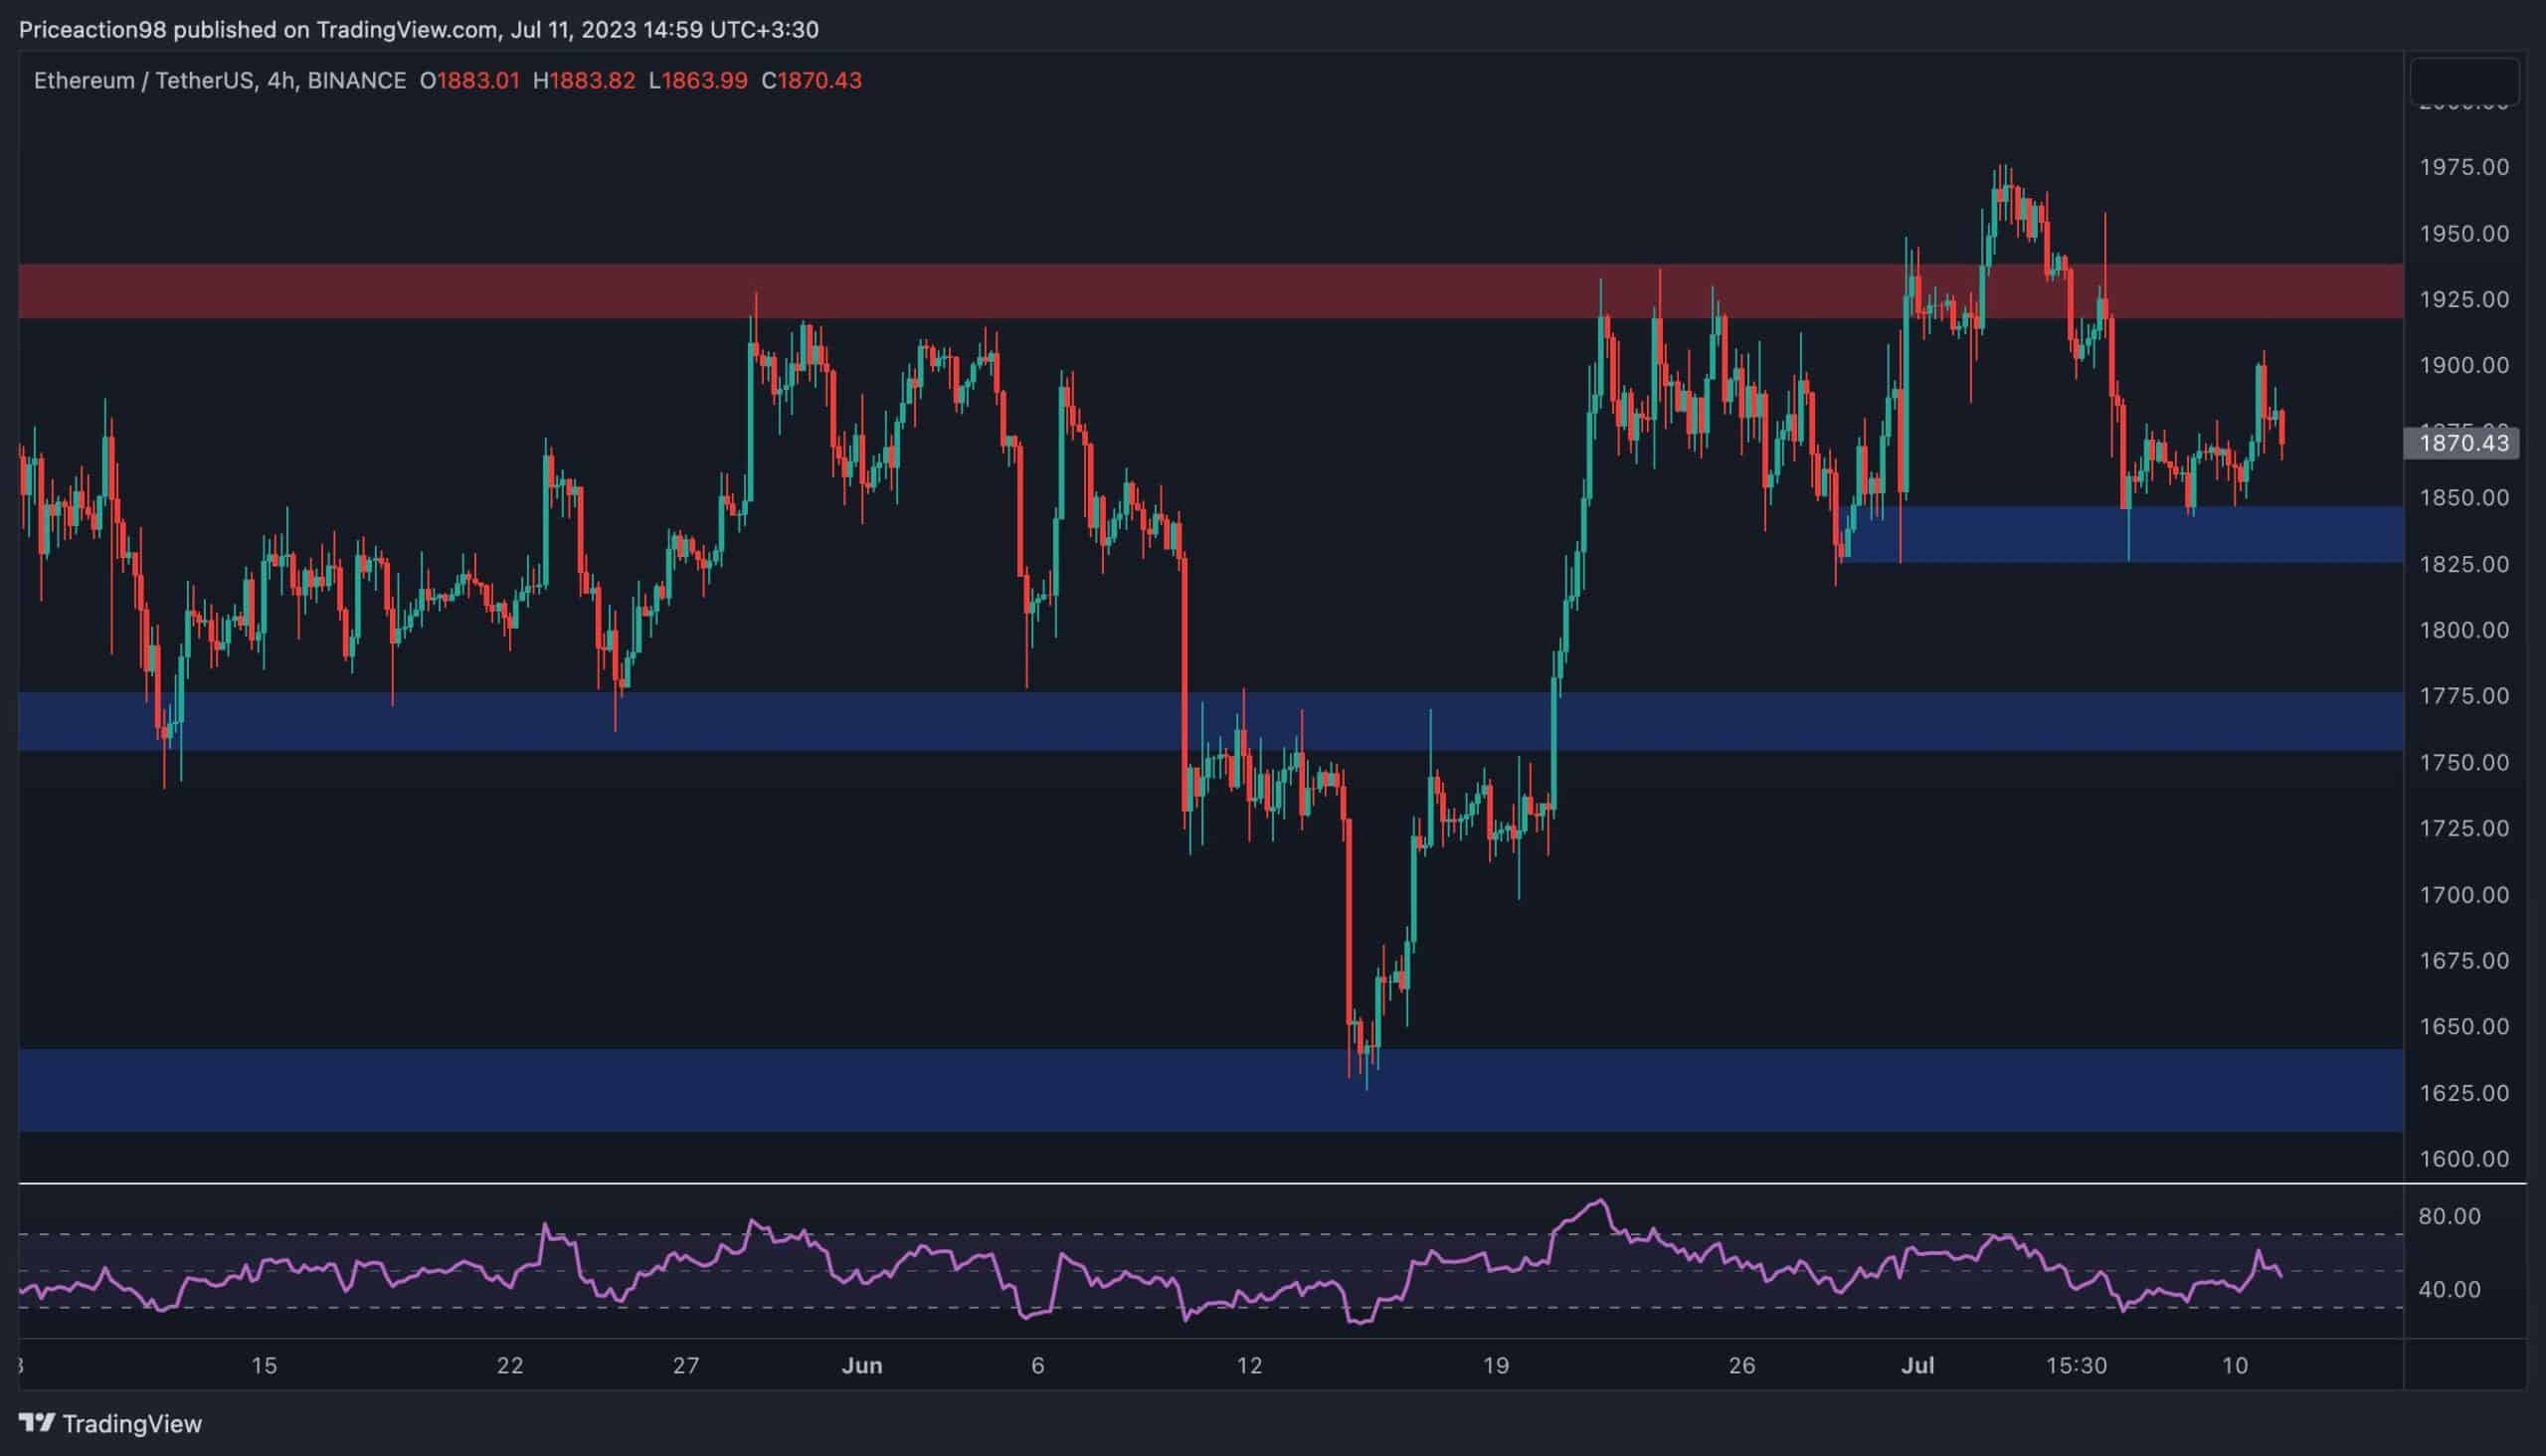
The 4-Hour Chart:
Things look a bit clearer on the 4-hour chart, as the price has been rejected from the $1,920 resistance level recently. The short-term support level at the $1,840 mark is currently being tested, holding ETH from dropping further.
However, there is a high probability for the mentioned level to break down, resulting in a sharp decline toward the $1,760 support zone. On the other hand, if ETH breaks above the $1,920 area, the market will likely enter a bullish phase once more, with the price surging toward the $2,000 level and even higher in the coming weeks.
Sentiment Analysis
By: Edris
Ethereum Taker Buy Sell Ratio
Ethereum has been consolidating lately, failing to break above the key $2,000 level. While the spot market seems strong, the derivatives market is seemingly responsible for the price’s failure to rally higher.
This chart represents the taker buy-sell ratio (with a 100-day exponential moving average applied), which is a useful metric in evaluating the futures market sentiment. Values above 1 indicate aggressive buying pressure; values below 1 are associated with dominant selling pressure.
Analyzing the chart, it is evident that the metric has once again failed to rise above 1 and is currently on a steep decline. This signal indicates that futures traders are aggressively shorting ETH, as they do not expect the market to break above the $2,000 level.
The resulting selling pressure is currently preventing the market from continuing its uptrend. However, in case the spot market demand prevails against the futures market supply, a bullish breakout higher would be imminent.

The post Ethereum Tumbles 5% Weekly, Here’s the Imminent Support to Watch (ETH Price Chart) appeared first on CryptoPotato.