Ethereum Remains Trapped Against Bitcoin As It Attempts To Break $200. What’s Next? ETH Price Analysis
- Ethereum saw a small 1% price increase today, but the coin is facing strong resistance at $198.
- ETH has increased by almost 15% over the past week after rebounding from support at $170.
- Against Bitcoin, Ethereum has been trapped between a range of 0.026 BTC and 0.025 BTC for the past 10-days.
Key Support & Resistance Levels
ETH/USD:
Support: $188, $180, $175.
Resistance: $198, $200, $211.
ETH/BTC:
Support: 0.025 BTC, 0.0247 BTC, 0.024 BTC.
Resistance: 0.026 BTC, 0.0263 BTC, 0.027 BTC.
ETH/USD: Ethereum Struggling At $198 Resistance.
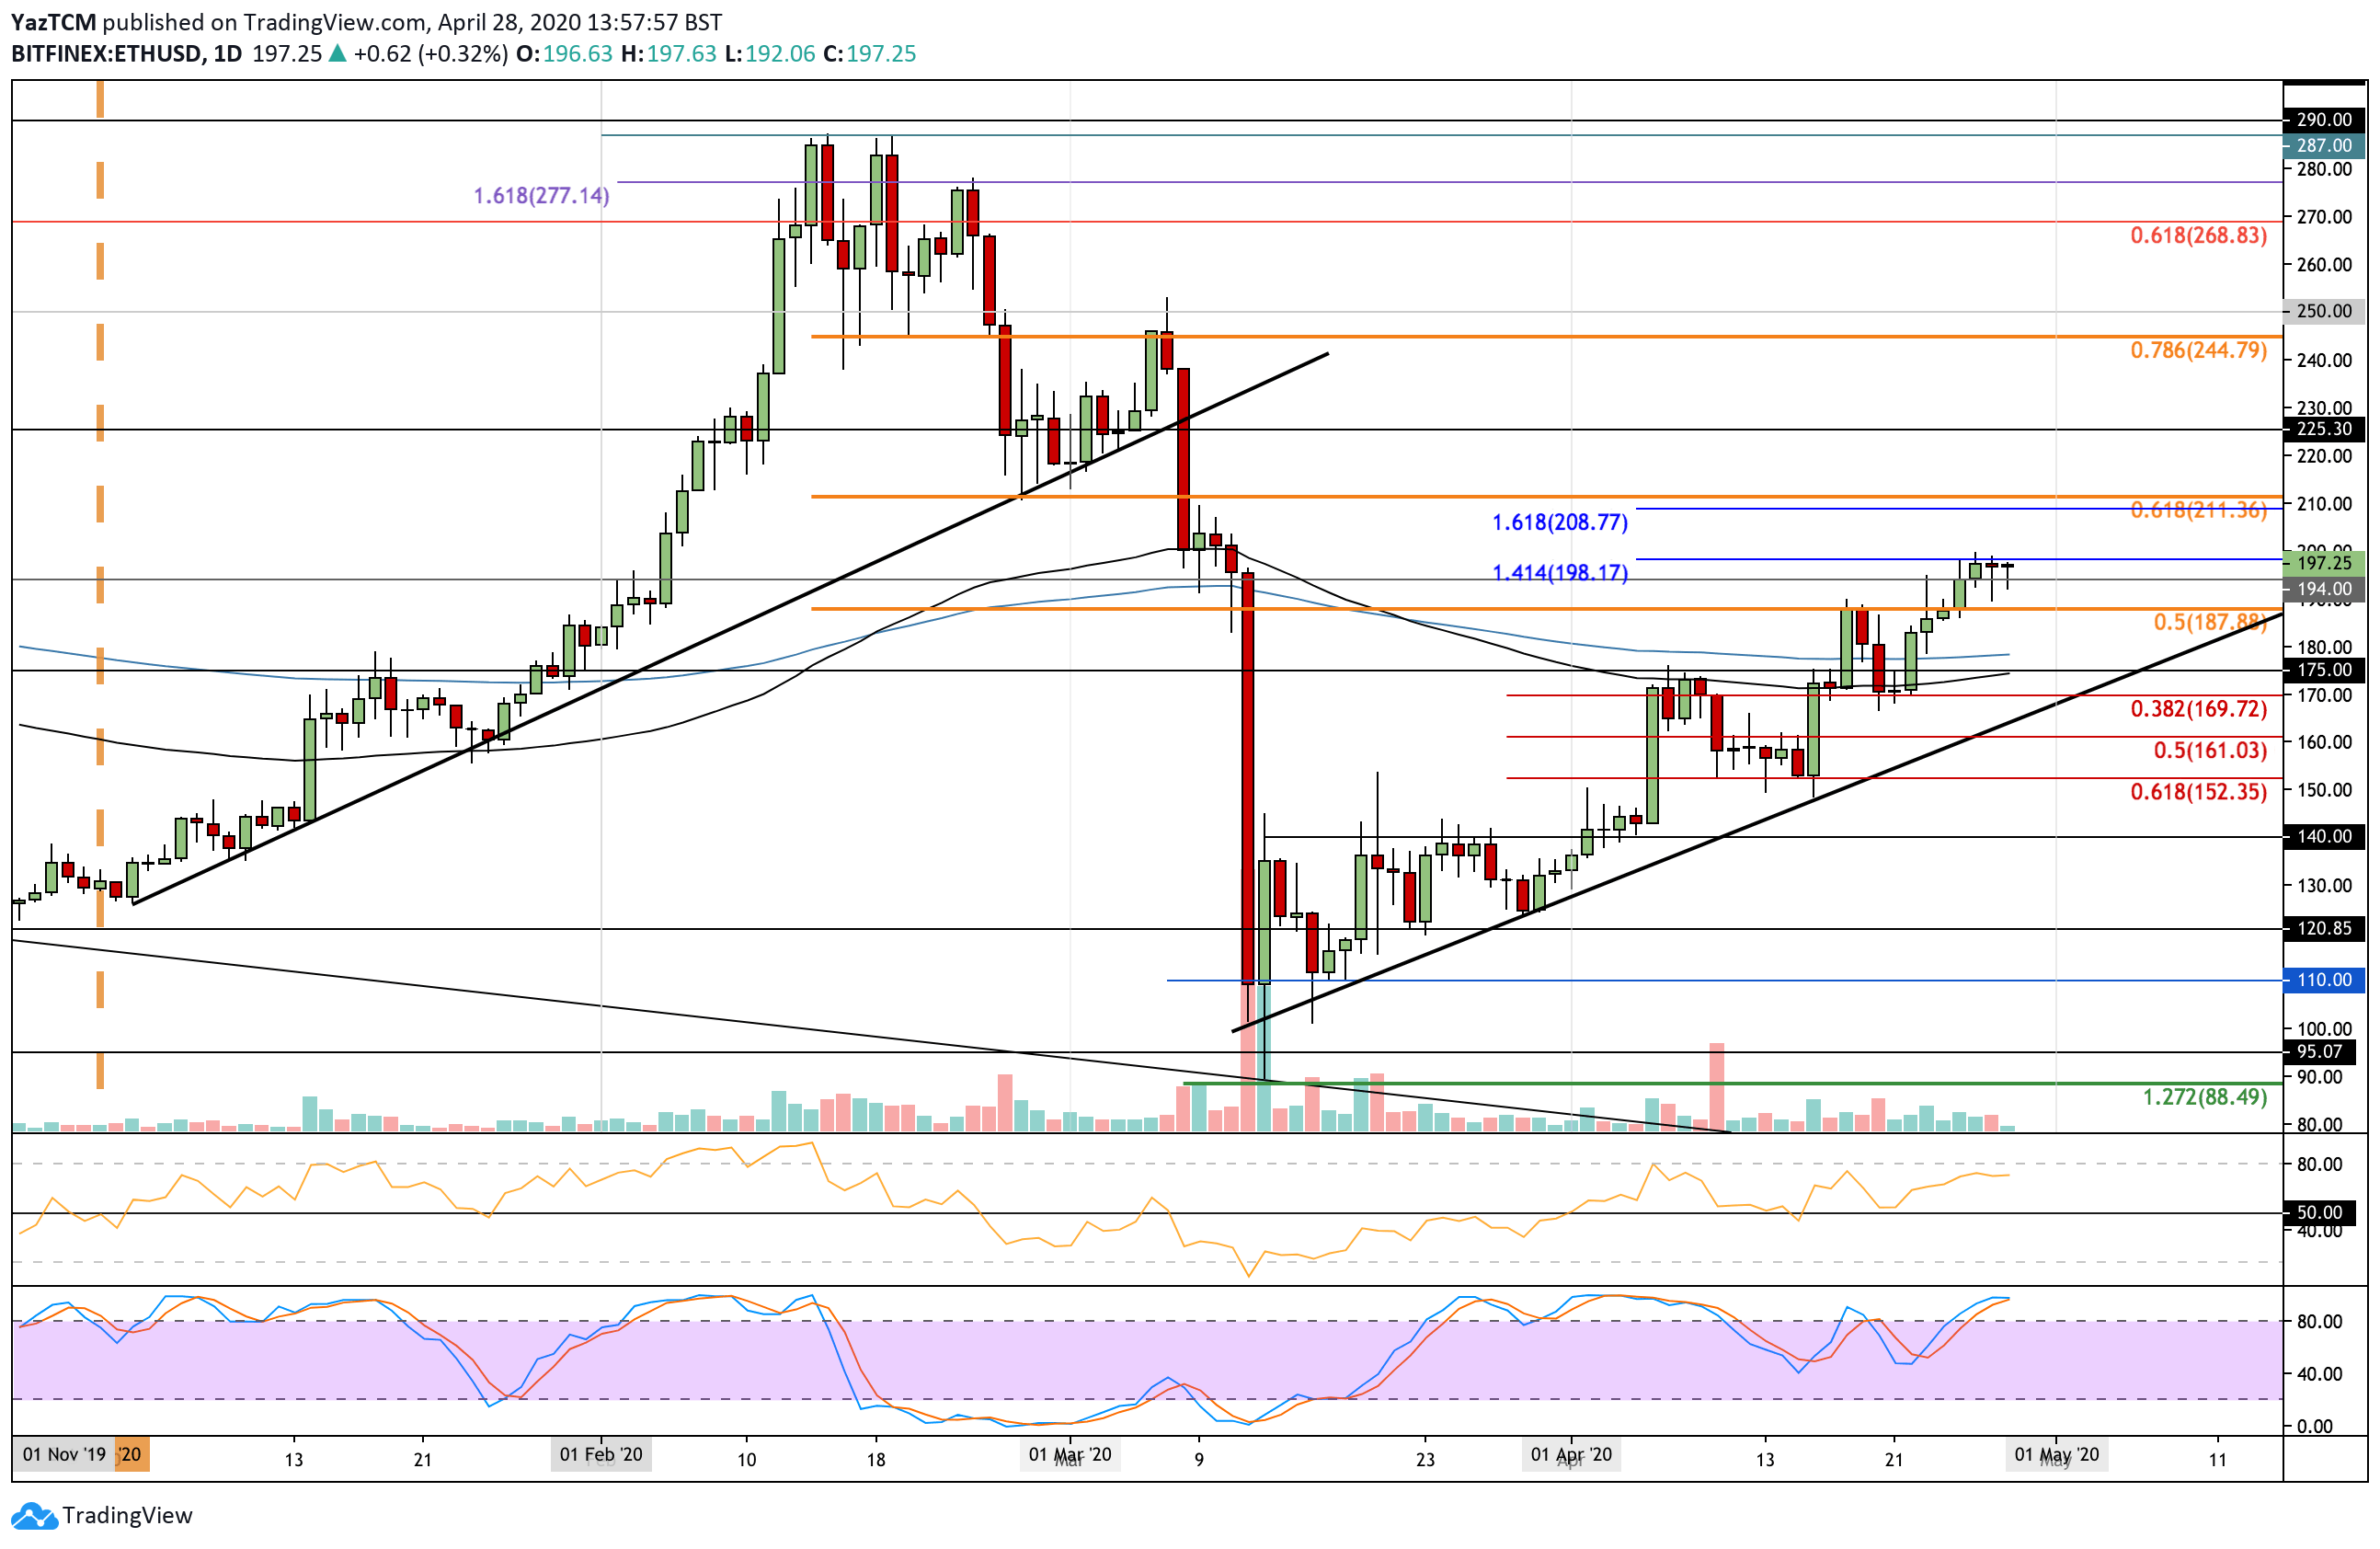
Ethereum rebounded from the $170 support level last week as it pushed higher to break the previous resistance at $187 (bearish .5 Fib Retracement). It continued to climb as it reached the current resistance at $198, provided by a 1.414 Fib Extension level.
The cryptocurrency is now battling with this level as it struggled to break above it over the past 3-days of trading. A break above $198 would certainly allow ETH to penetrate $200 and push higher.

ETH/USD Short Term Price Prediction
Once the buyers break $198 and $200, resistance is located at $211 (bearish .618 Fib Retracement). Above this, resistance is expected at $225 and $245 (bearish .786 Fib Retracement level).
On the other hand, if the sellers push lower, the first level of support lies at $188. Beneath this, support is expected at $180 (200-day EMA), $175 (100-day EMA), and $170 (.382 Fib Retracement).
The RSI is above 50 as the buyers dominate the market momentum. However, it is starting to flatten out, which shows the buying momentum is not increasing. Additionally, the Stochastic RSI is primed for a bearish crossover signal that would send the market lower.
ETH/BTC: ETH Trapped Within Narrow Range
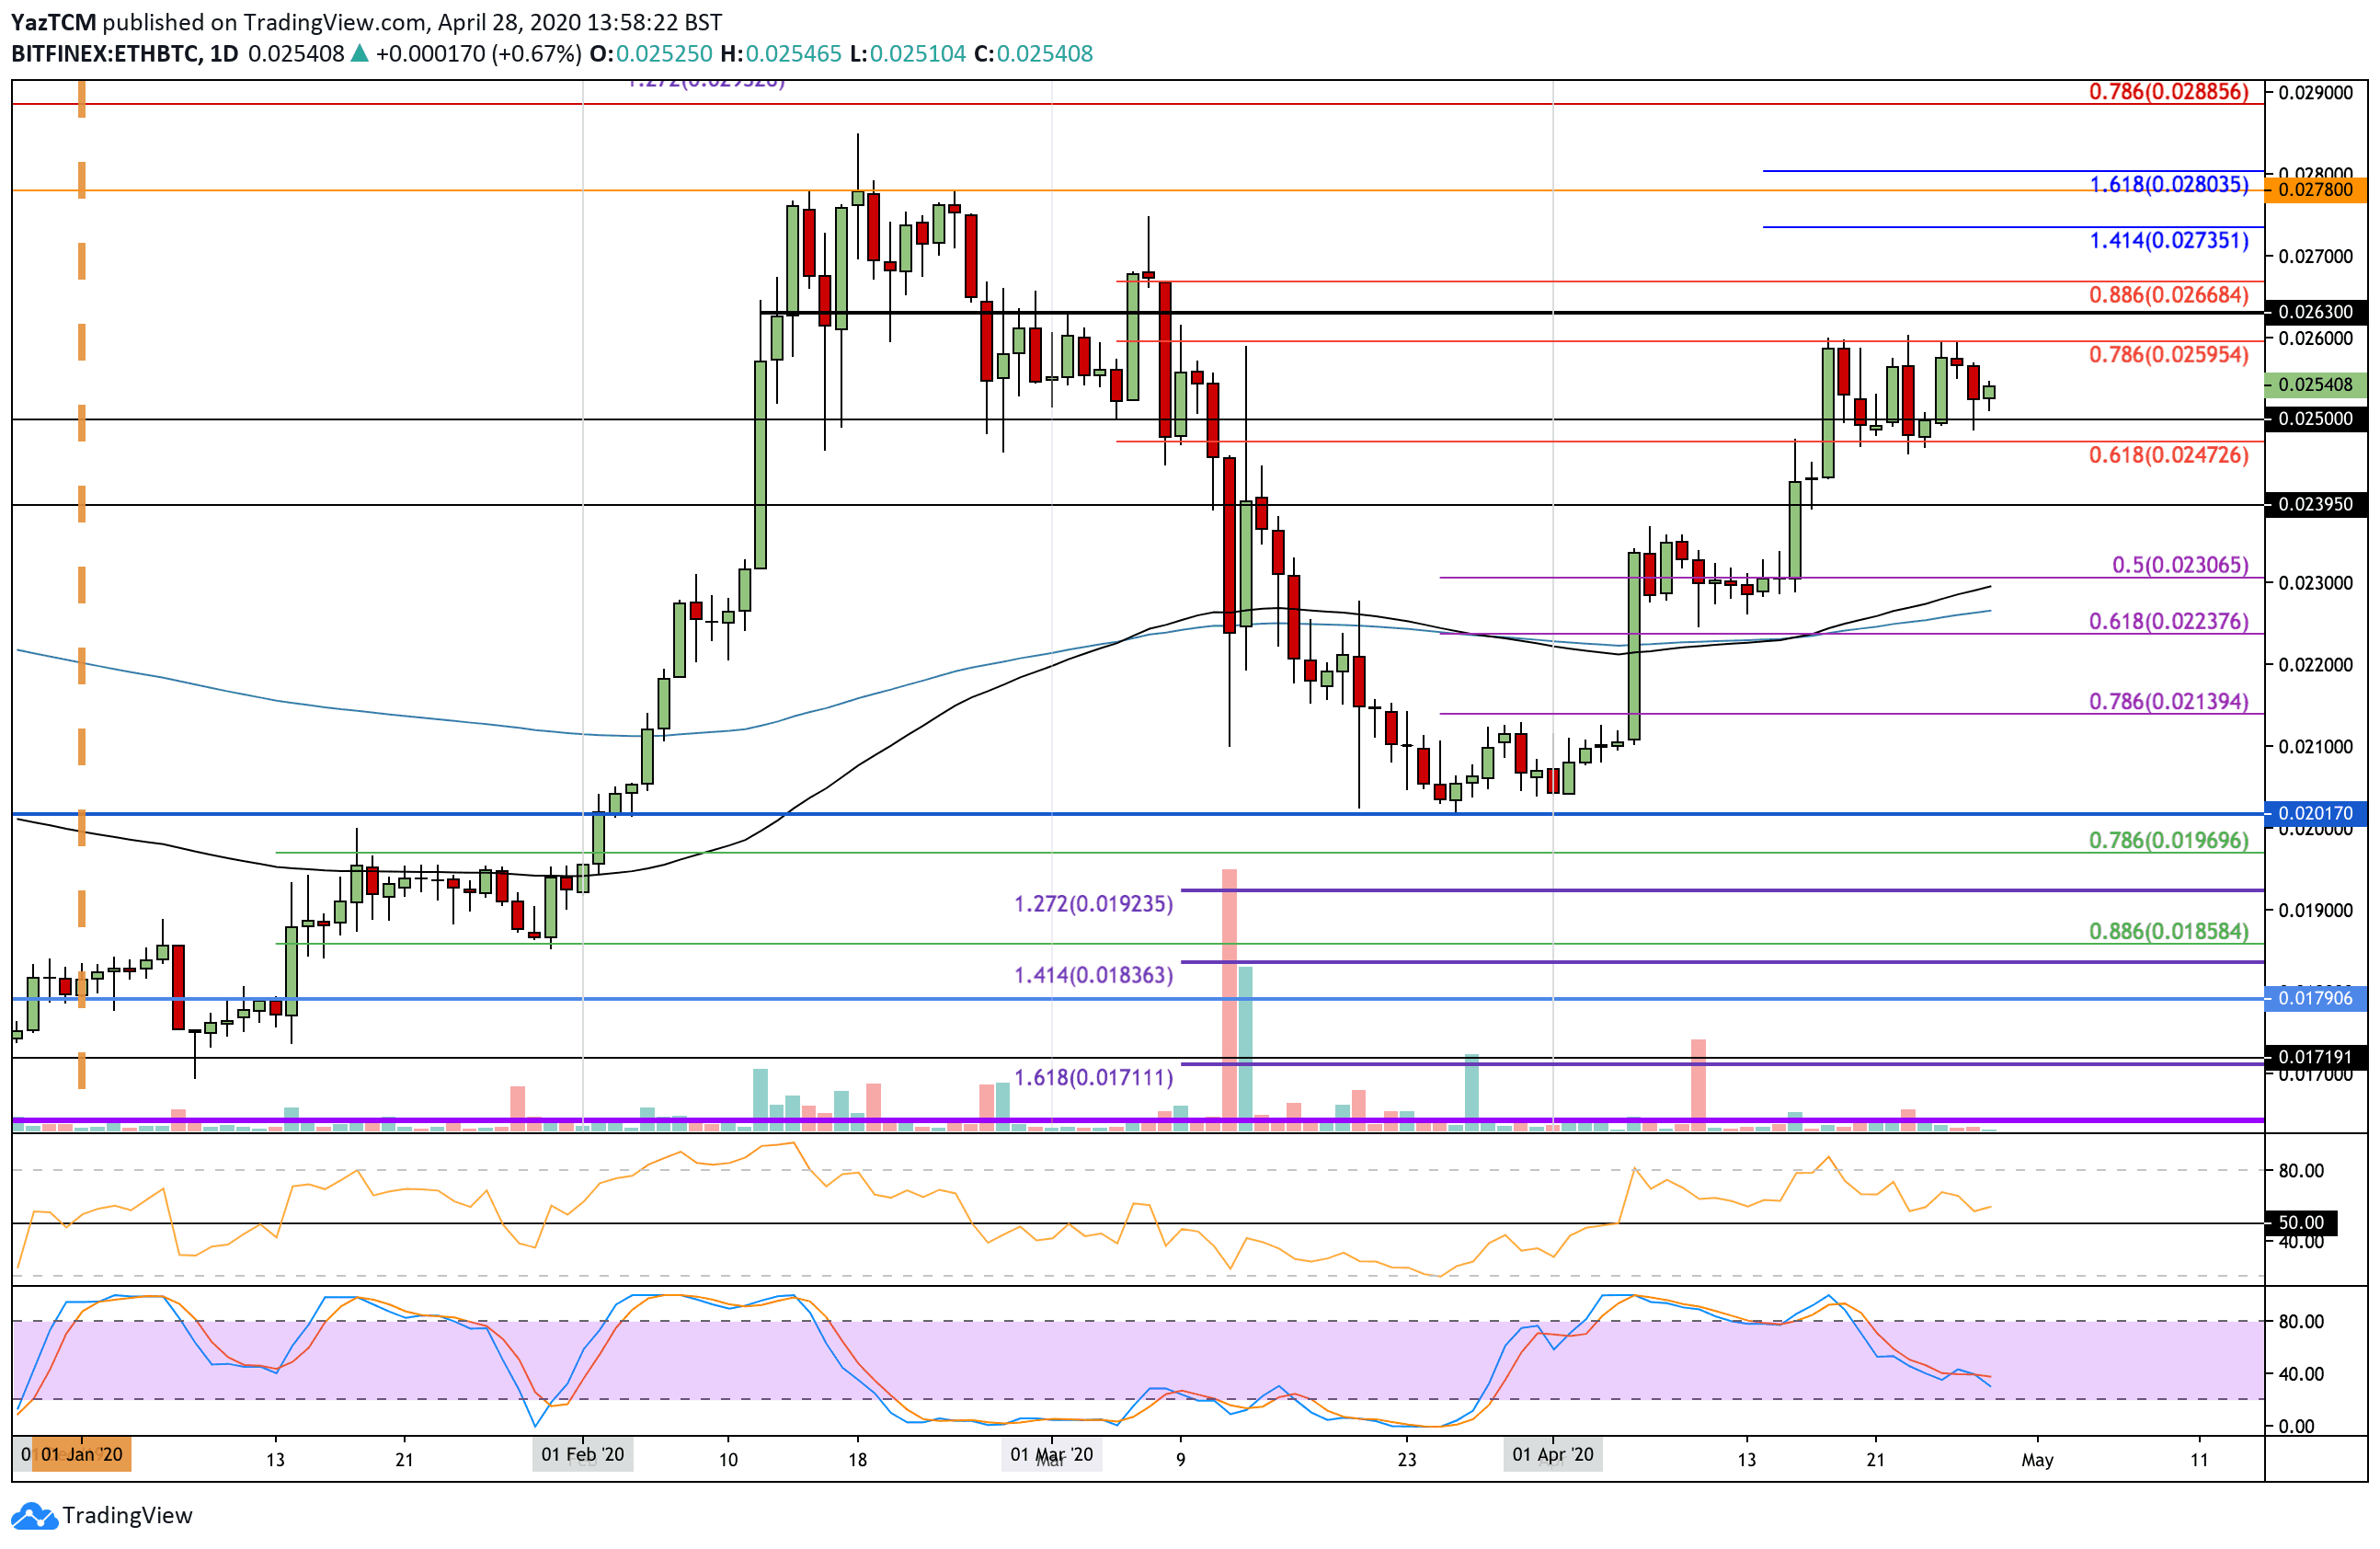
Against Bitcoin, Ethereum has been trapped within a range between 0.026 BTC (bearish .786 Fib Retracement) and 0.0247 BTC over the past 10-days of trading. Each time the coin reaches the upper boundary, it is turned away. Likewise, for the lower boundary.
Ethereum must now break this range for the market to gain a clear direction on where it would like to head toward next.

ETH/BTC Short Term Price Prediction
If the bulls can break 0.026 BTC, resistance is located at 0.0263 BTC and 0.0266 BTC (bearish .886 Fib Retracement). Above this, added resistance lies at 0.027 BTC and 0.0273 BTC (1.414 Fib Extension).
On the other side, if the sellers break the support at 0.025 BTC and push beneath the lower boundary at 0.0247 BTC, added support lies at 0.0239 BTC and 0.023 BTC (.5 Fib Retracement).
The RSI has been falling over the last few days to show falling bullish momentum. If it can remain above the 50 line, this will be a good sign for the bulls.
The post Ethereum Remains Trapped Against Bitcoin As It Attempts To Break $200. What’s Next? ETH Price Analysis appeared first on CryptoPotato.


