Ethereum Price Analysis: Will ETH’s Sideways Action End Soon Above $2000?
ETH/USD – Bulls Struggle At $1850 Resistance With Bearish Divergence Still Present
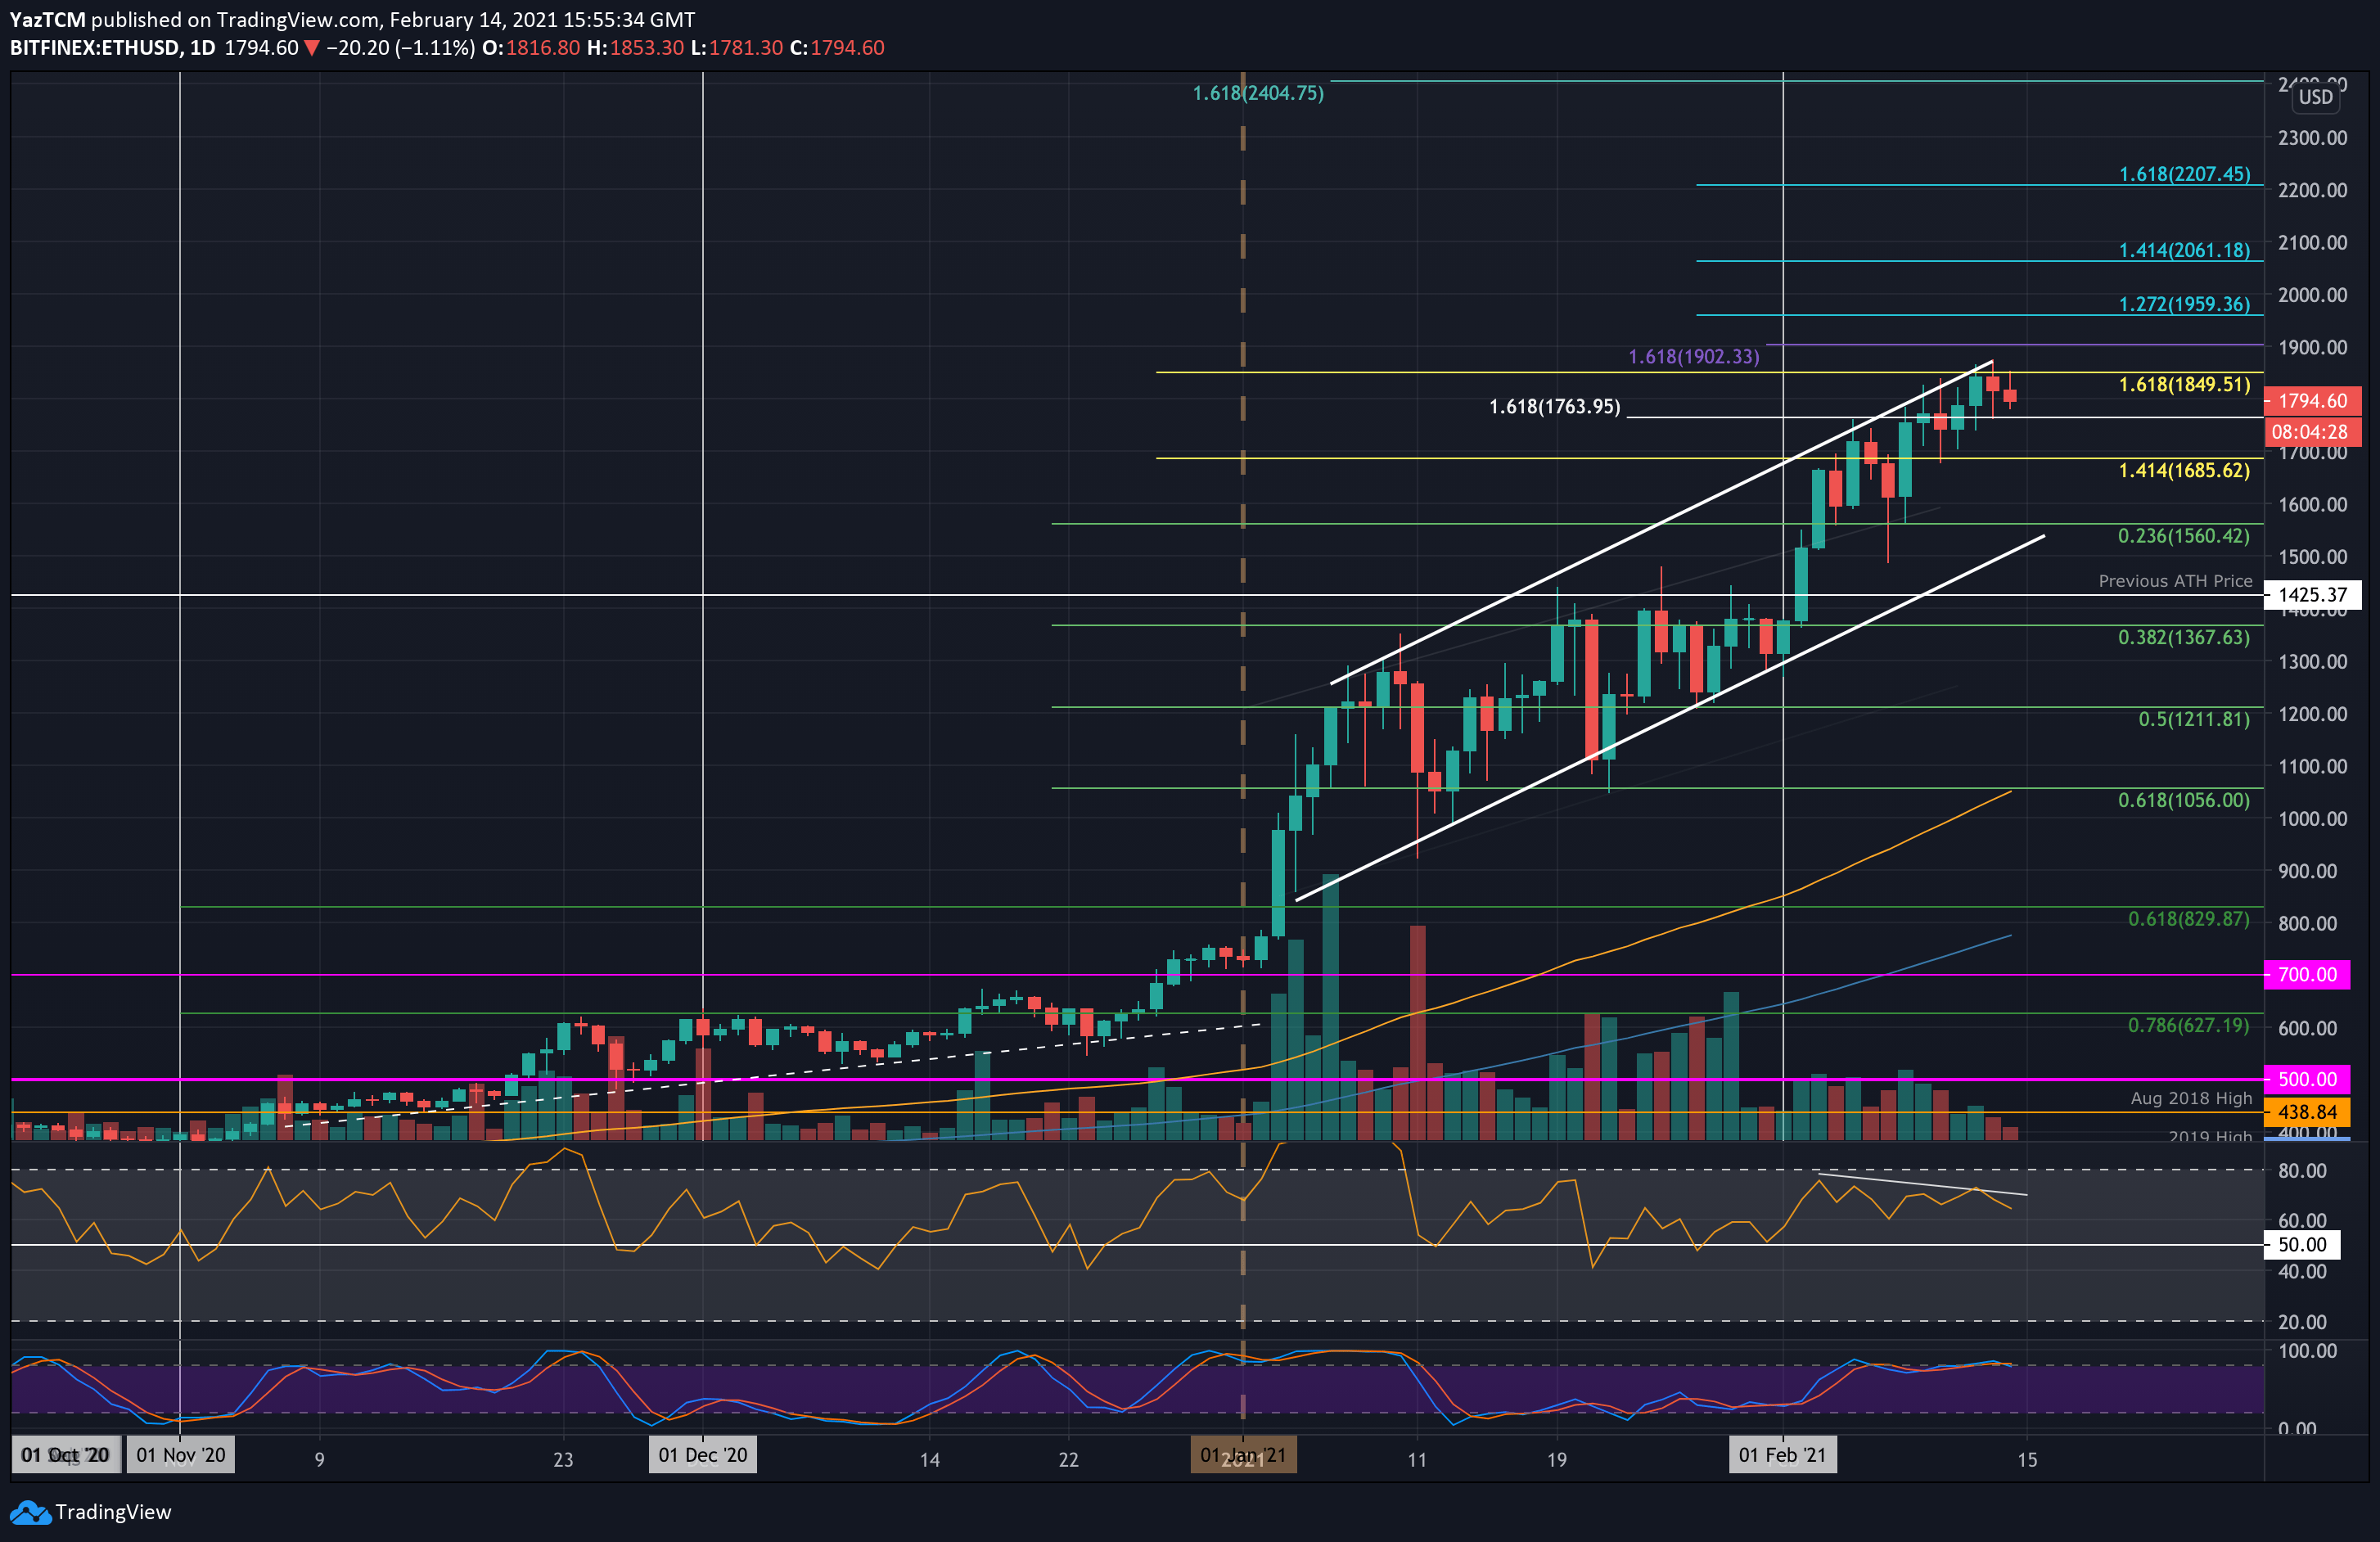
Key Support Levels: $1765, $1700, $1685.
Key Resistance Levels:$1850, $1900, $1960.
So far this weekend, Ethereum has dropped almost 3% after reaching the resistance at $1850 (1.618 Fib Extension). The coin was struggling to break $1800 throughout the past week but penetrated above it on Friday to reach $1850.
It had also failed at the resistance at the upper boundary of an ascending price channel and has dropped to $1800 today.
ETH-USD Short Term Price Prediction
Looking ahead, the first resistance lies at $1850. This is followed by $1900, $1960 (1.272 Fib Extension), $2000, and $2061 (1.414 Fib extension). Additional resistance lies at $2200.
On the other side, the first support lies at $1765. This is followed by $1700, $1685, and $1560 (.236 Fib & lower boundary of the price channel).
The RSI is showing bearish divergence in February as it makes lower highs while the price action has made higher highs. If this plays out, ETH could be heading toward the lower boundary of the price channel.
ETH/BTC – Bears Testing .5 Fib Support
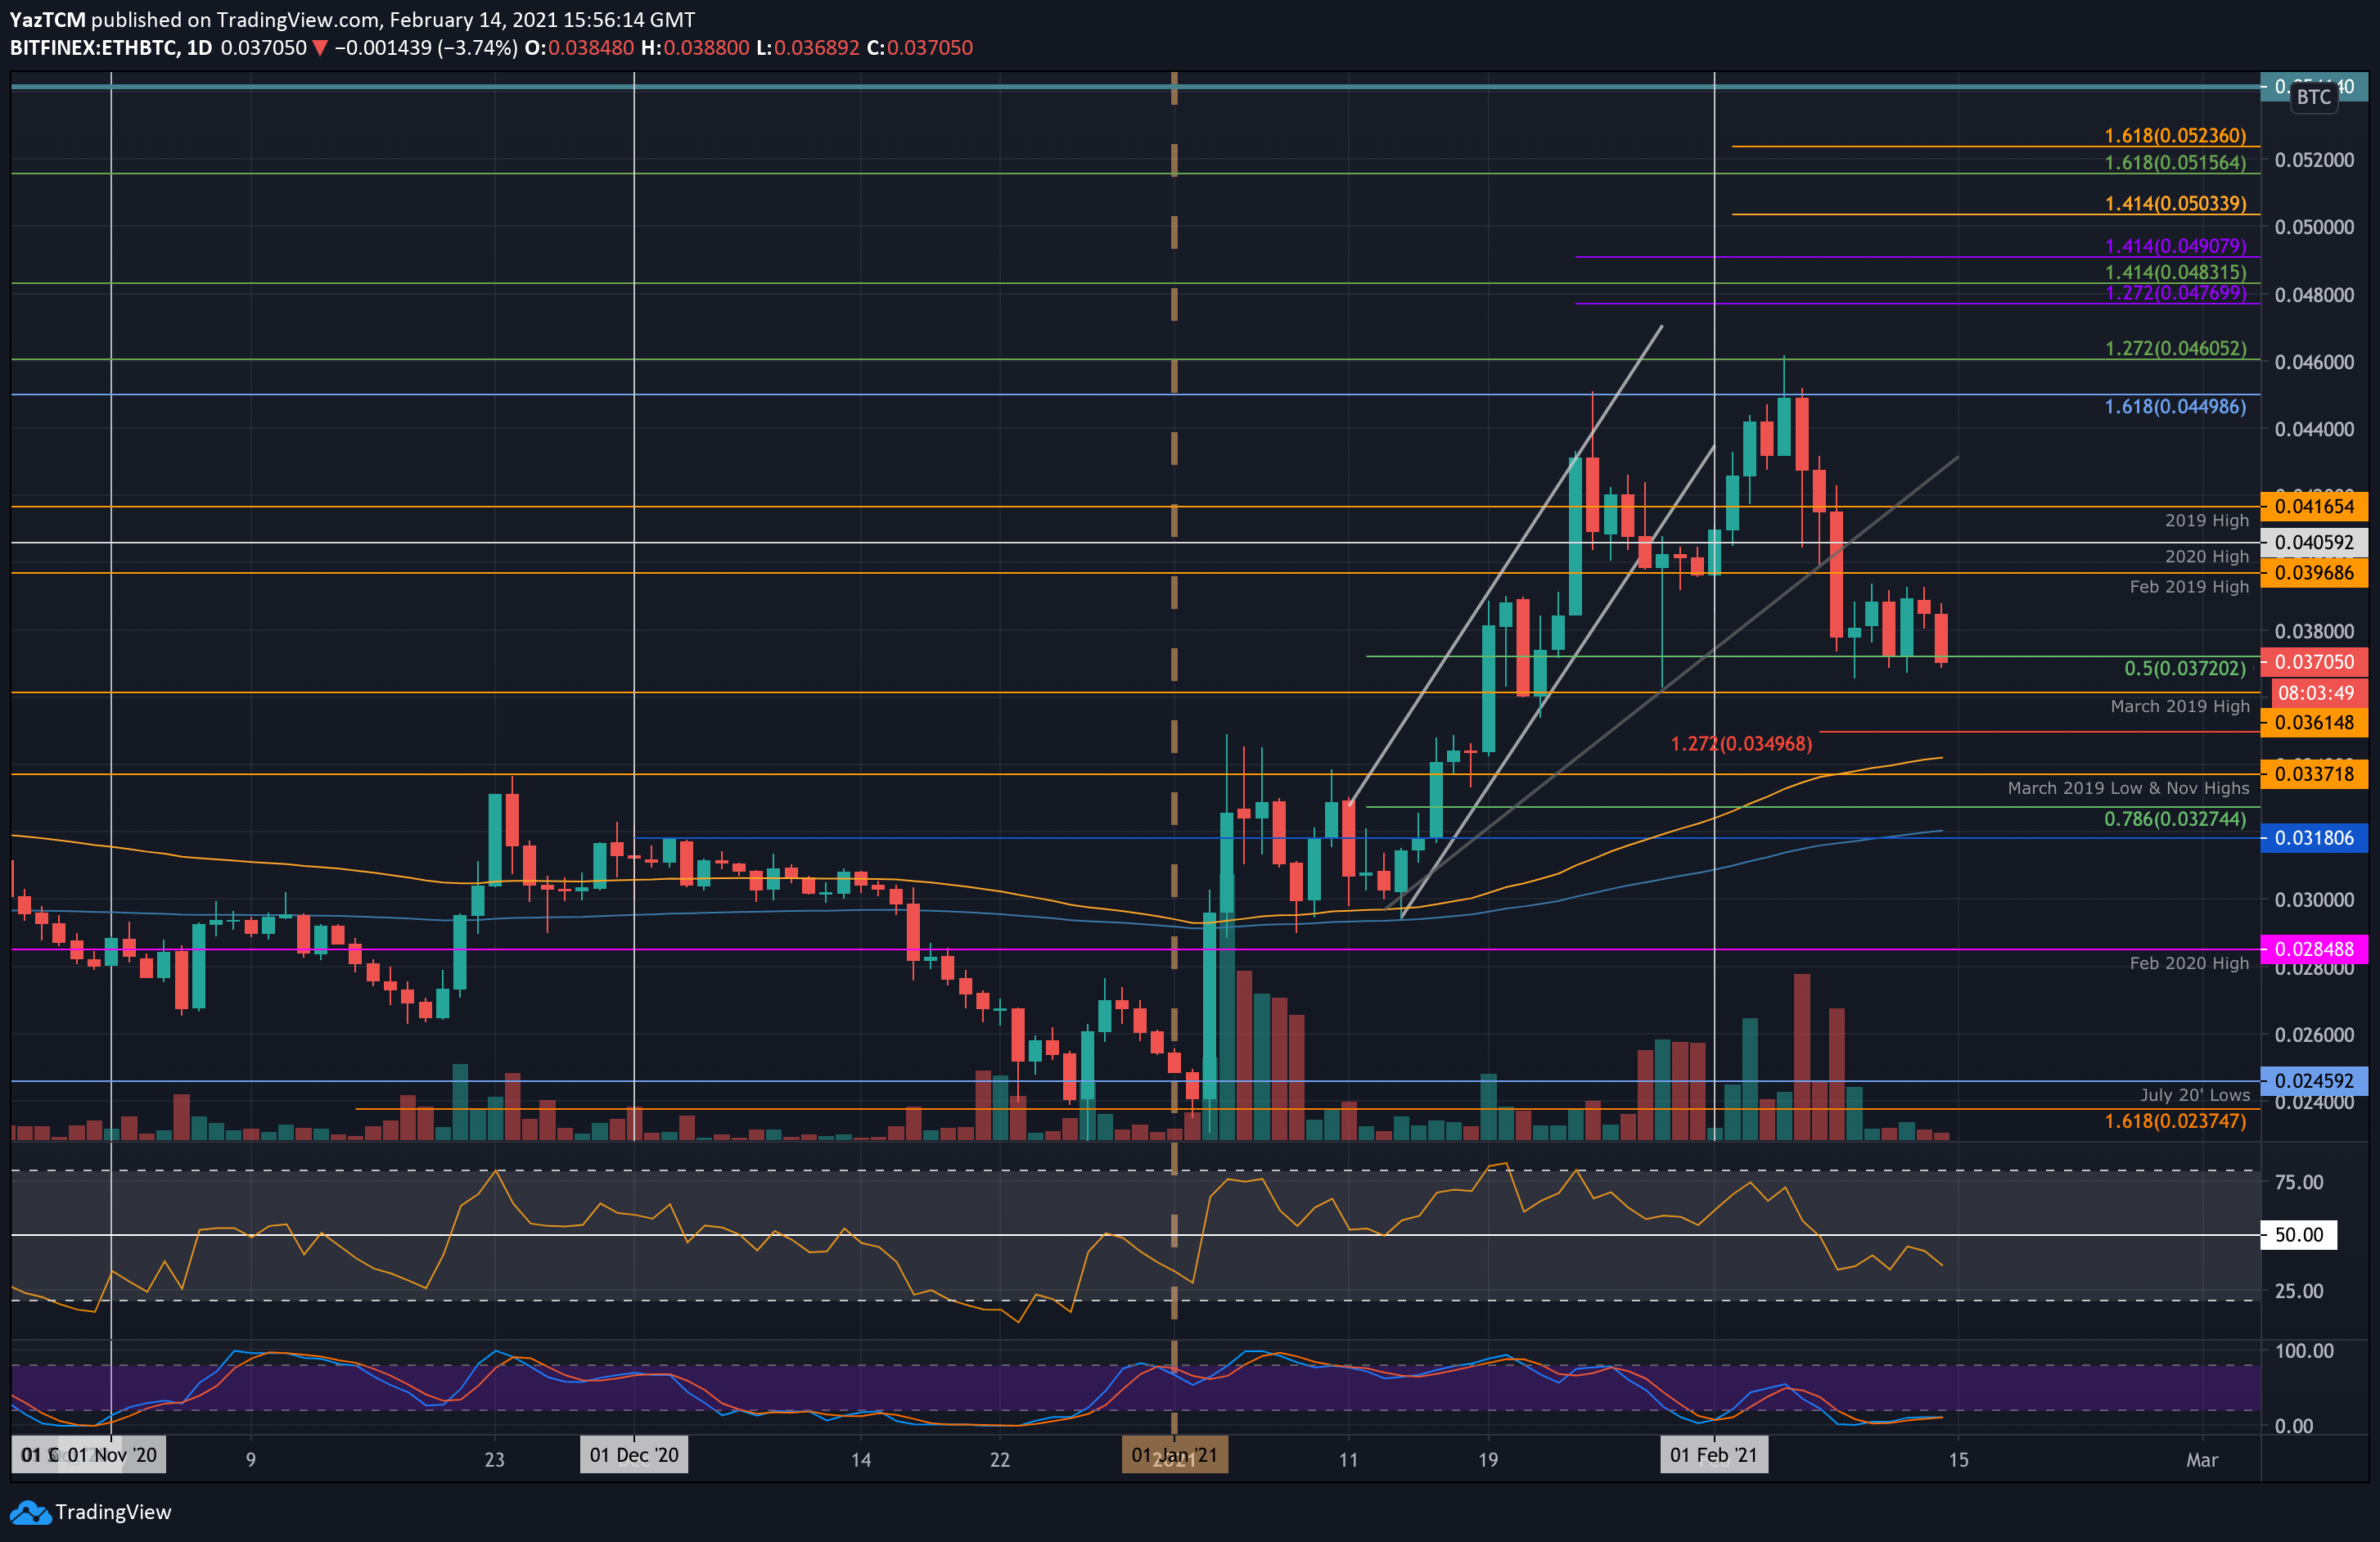
Key Support Levels: 0.0361 BTC, 0.0349 BTC, 0.034 BTC.
Key Resistance Levels: 0.038 BTC, 0.039 BTC, 0.0396 BTC.
Against Bitcoin, Ethereum has been struggling this month after dropping from 0.046 BTC. Over the past six days, Ethereum has been rangebound between 0.0372 BTC (.5 Fib) and 0.039 BTC.
Today, ETH has slipped beneath 0.0372 BTC to hit 0.037 BTC. We still need to wait for a daily candle close today to confirm it has broken beneath the .5 Fib Support.
ETH-BTC Short Term Price Prediction
Looking ahead, the first support beneath 0.037 BTC lies at 0.0361 BTC (March 2019 High). This is followed by 0.0349 BTC (downside 1.272 Fib Extension), 0.034 BTC (100-days EMA), and 0.0337 BTC (November 2020 Highs).
On the other side, the first resistance lies at 0.038 BTC. This is followed by 0.039 BTC, 0.0296 BTC (Feb 2019 High), and 0.0405 BTC (2020 High).
The RSI is beneath the midline, indicating the bears are in control of the market momentum.