Ethereum Price Analysis: This Is the Level ETH Has to Overcome to Challenge $3K
Ethereum’s recent price action suggests a strengthening bullish trend as it rebounds from the key support and approaches the significant resistance region of the 100-day MA.
If ETH breaches this threshold, a sustained bullish trend will unfold.
Technical Analysis
By Shayan
The Daily Chart
Ethereum recently witnessed heightened buying activity around the middle trendline of a multi-month descending channel at approximately $2.4K. This demand surge led to a notable price rebound, pushing it toward the resistance region of $2.6K, aligning with the 100-day moving average.
If Ethereum successfully reclaims this MA and confirms a pullback, it could initiate a fresh uptrend. In this bullish scenario, the next target would include the 200-day MA at $2.9K and the upper boundary of the descending channel near $2.8K. Conversely, should ETH face another rejection, it may retrace back toward the $2.4K support level for consolidation.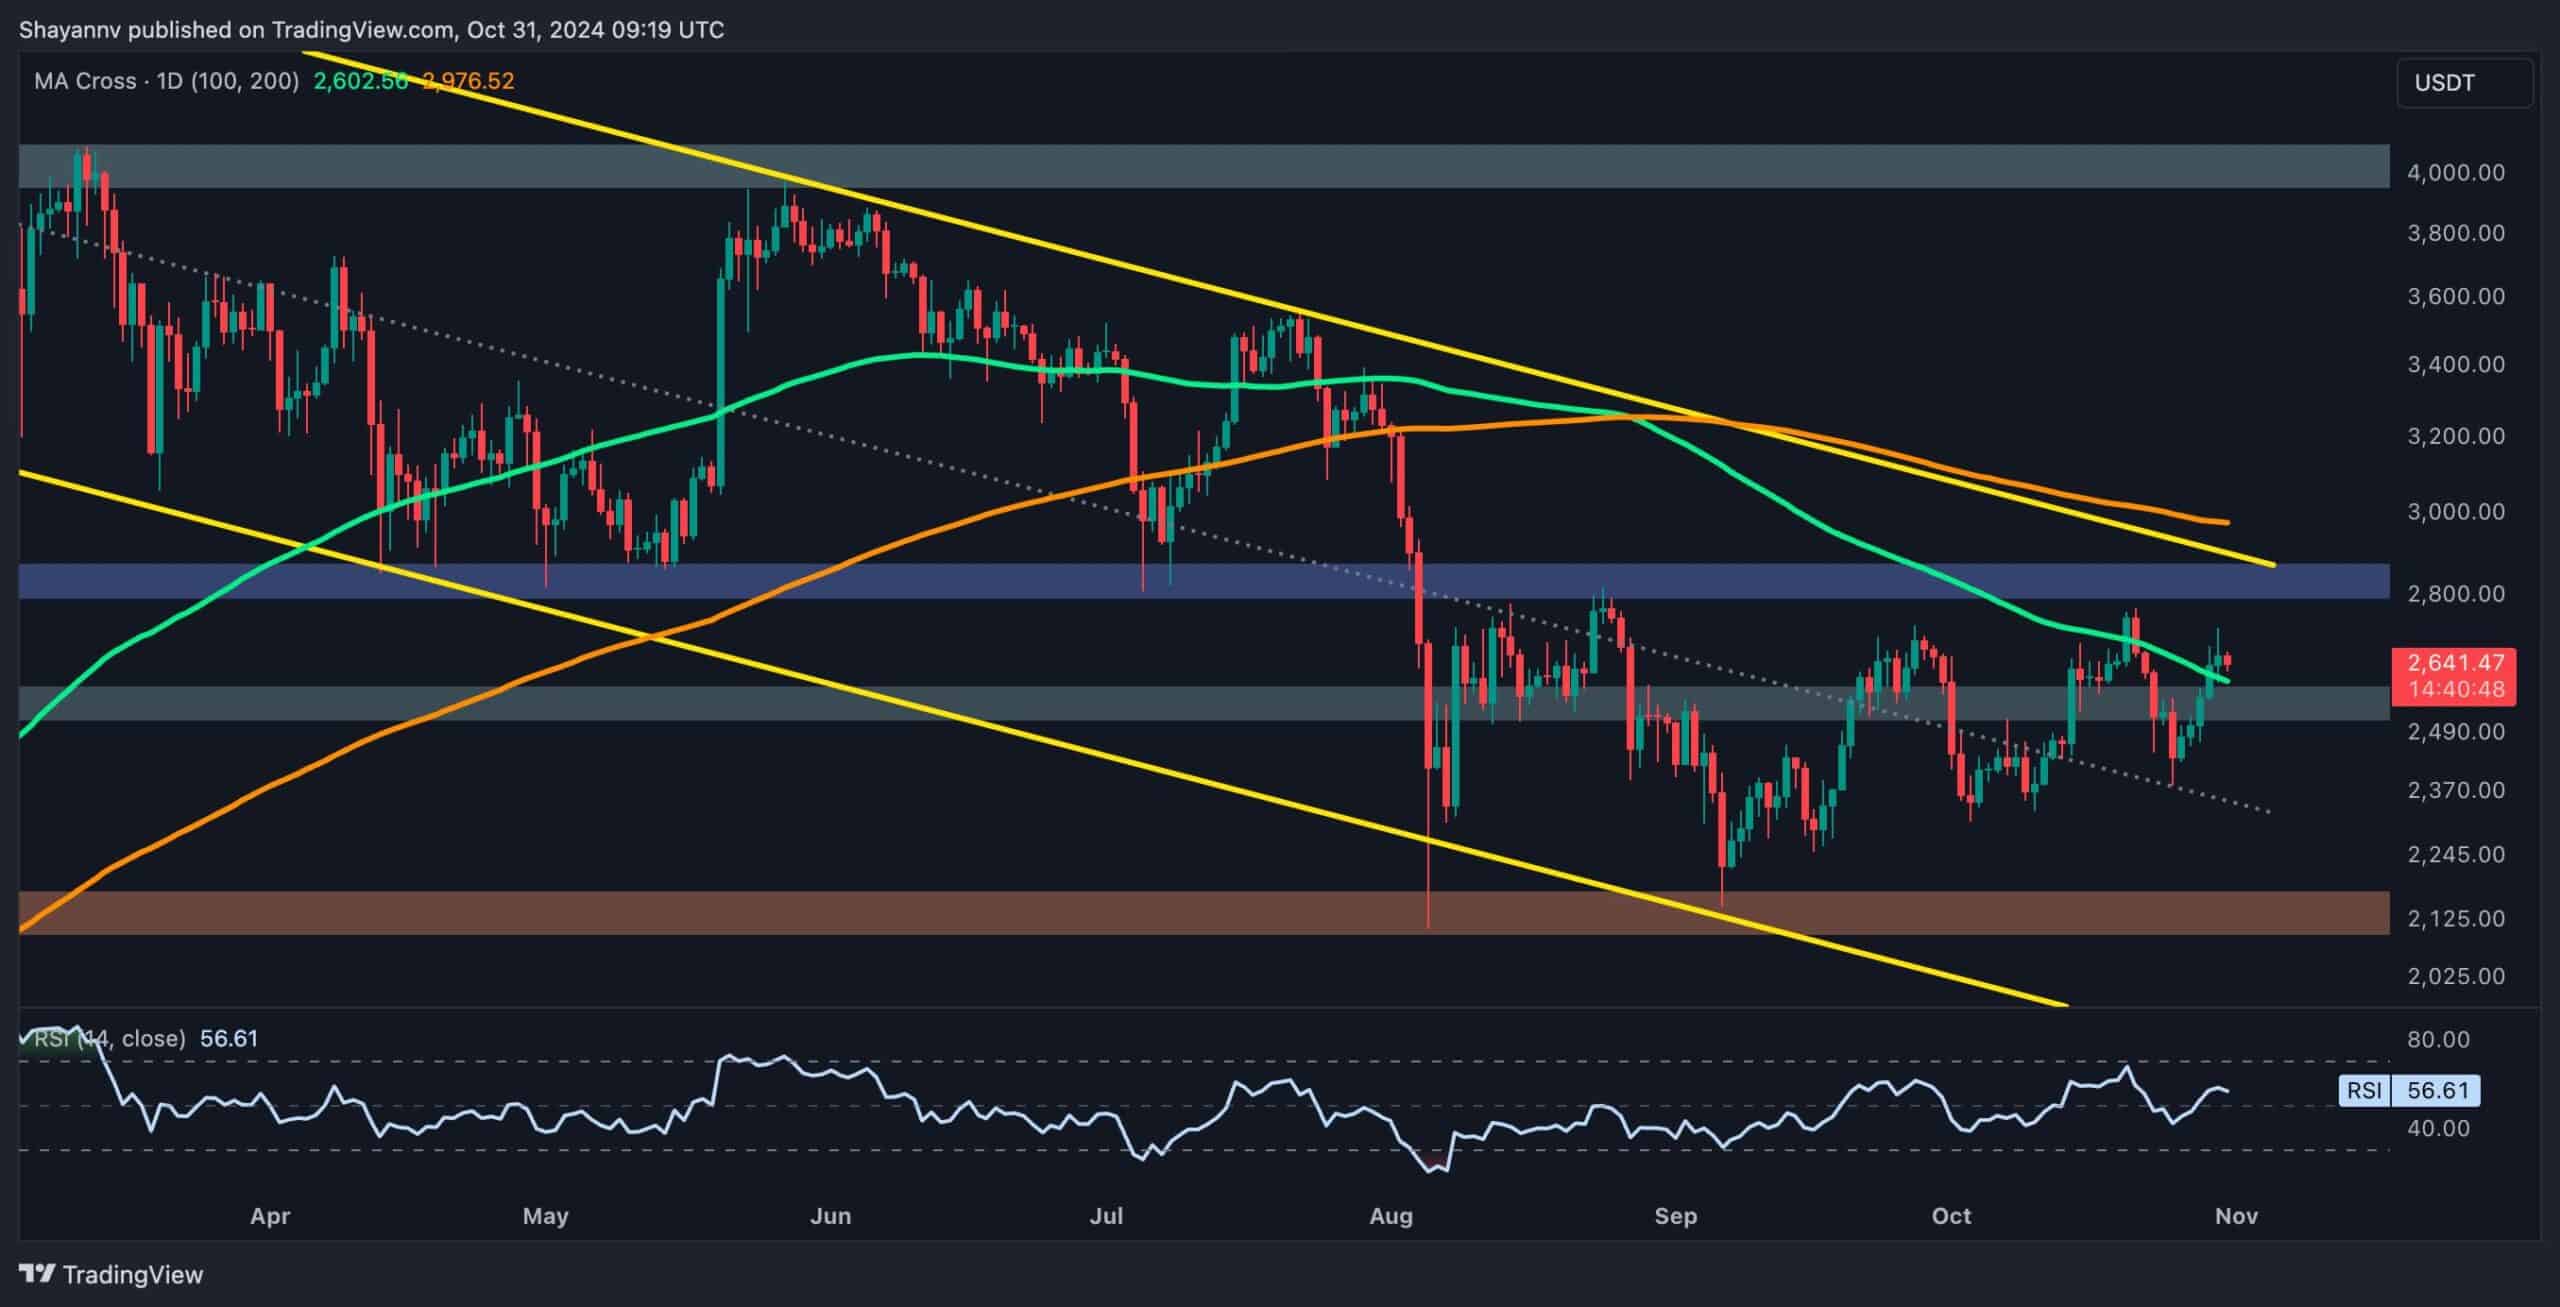
The 4-Hour Chart
On the 4-hour chart, Ethereum’s recent rebound near the $2.4K region, specifically around the ascending flag’s lower boundary, highlights a short-term increase in demand. The price has now reached a critical resistance zone, corresponding to the 0.5 and 0.618 Fibonacci levels ($2.6K-$2.8K), where significant supply is anticipated.
ETH’s price remains confined within this tight range, bound by dynamic support from the flag’s lower boundary and resistance at these Fibonacci levels. If the asset breaks above this range, it could lead to a short-liquidation cascade, potentially propelling it toward the $3K threshold.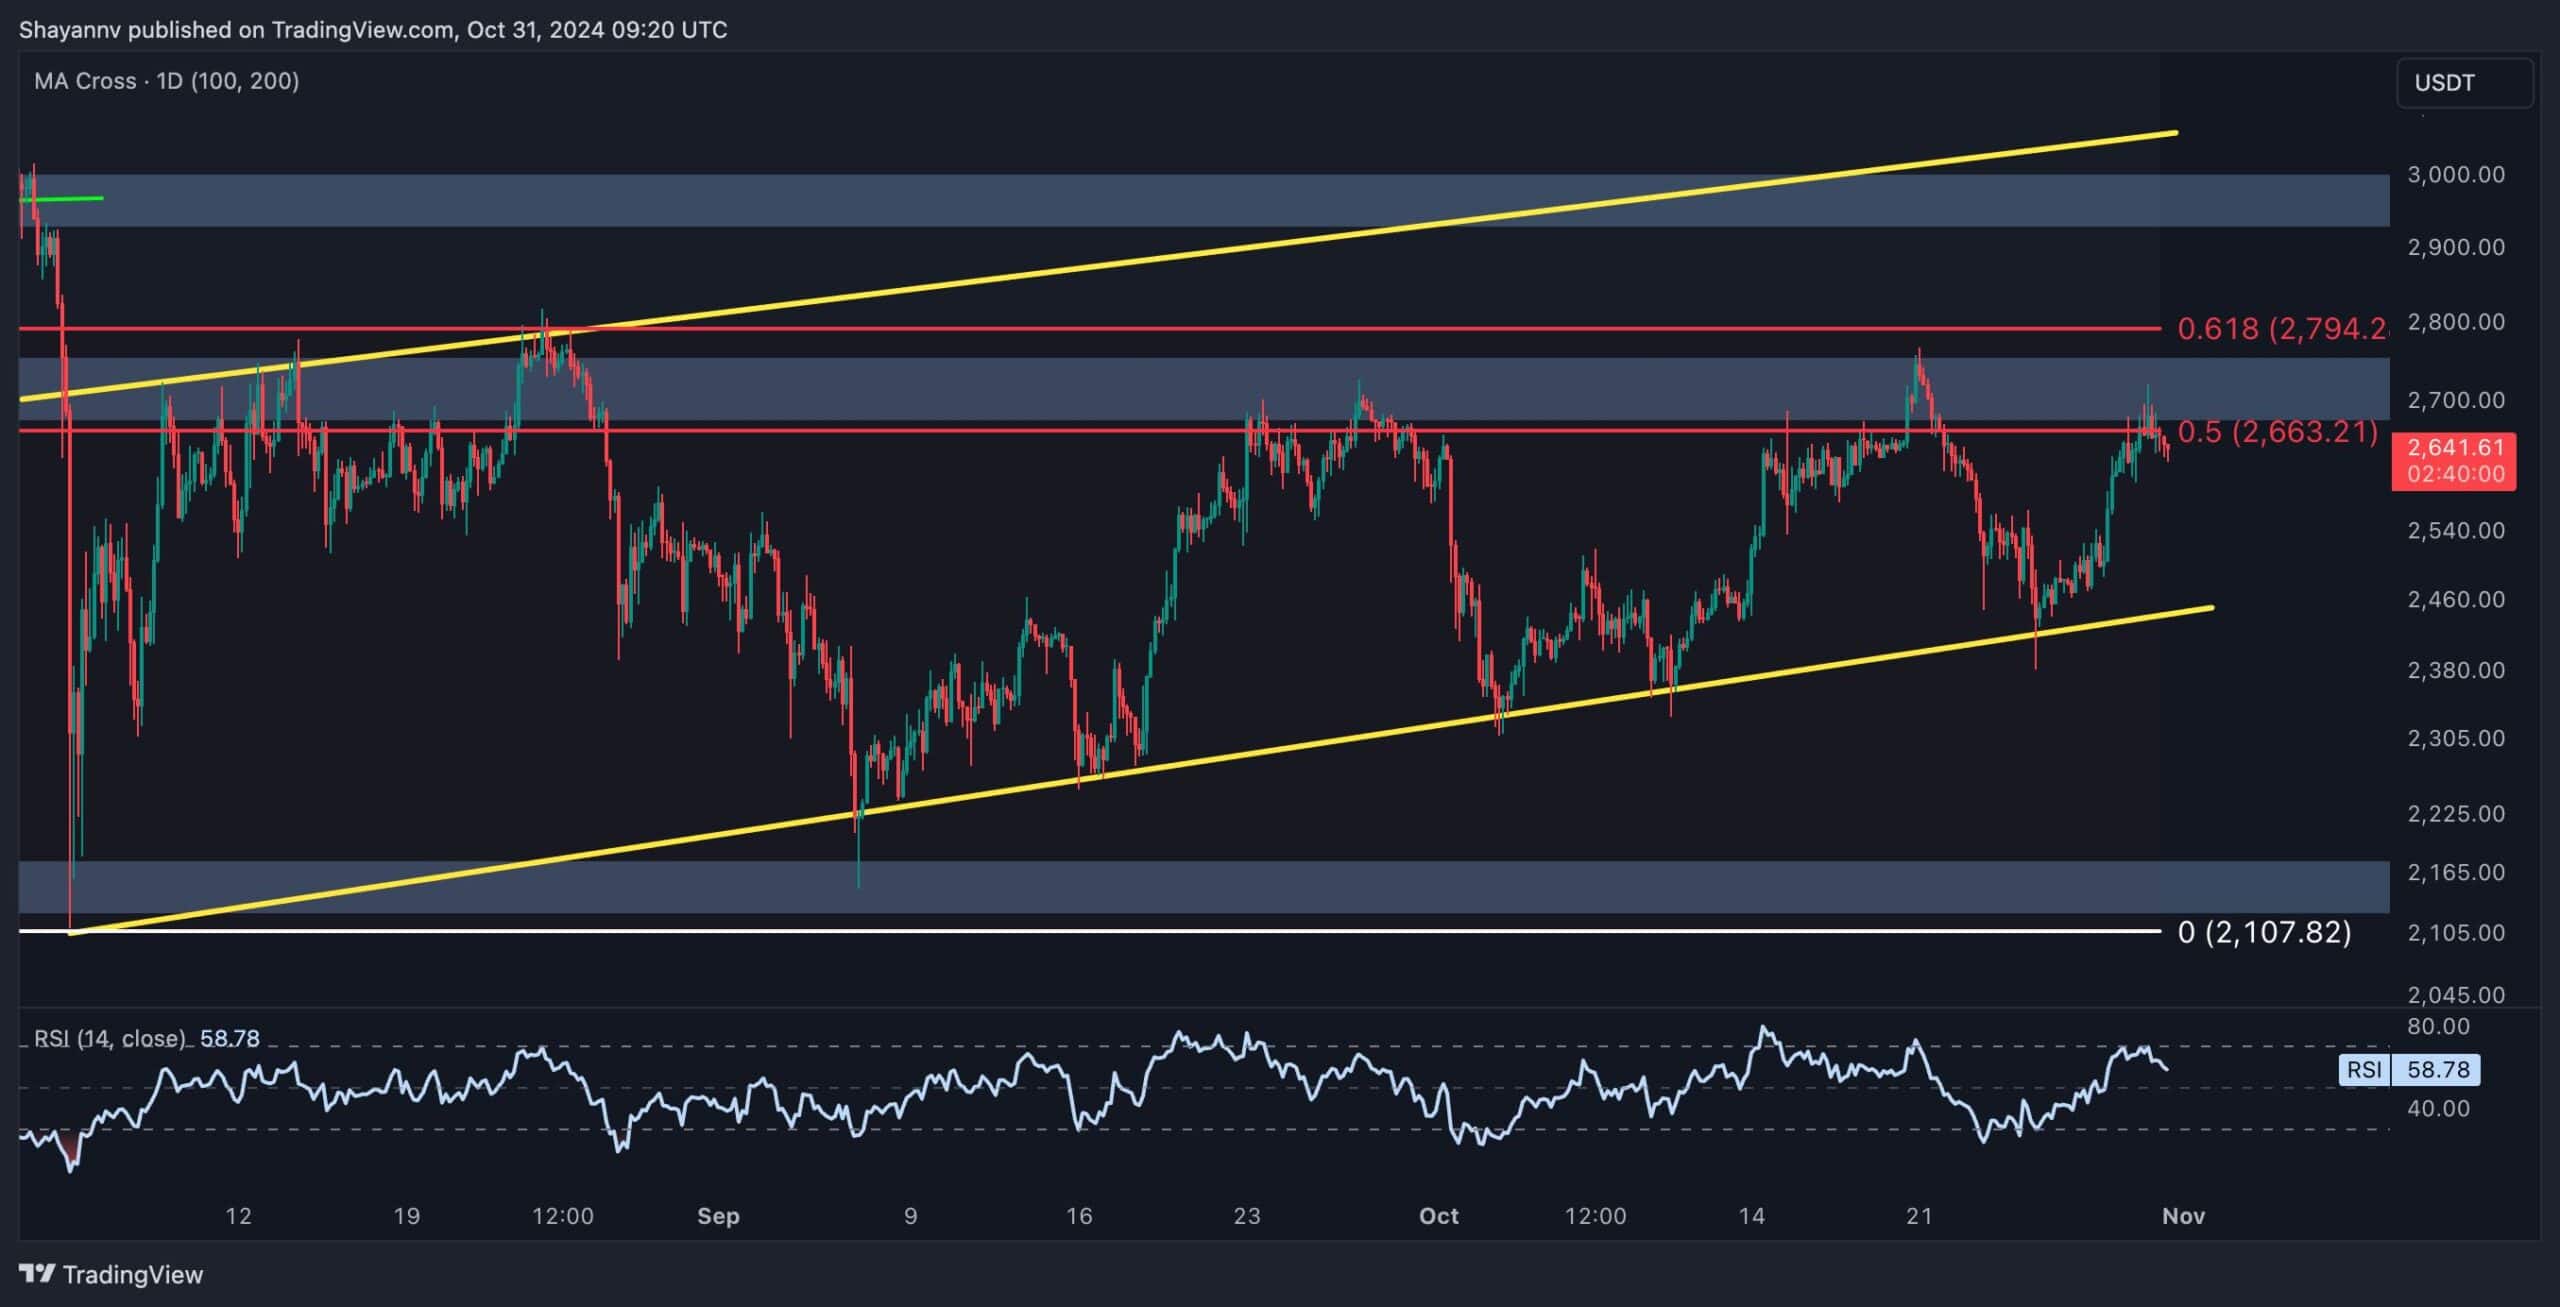
On-Chain Analysis
By Shayan
Ethereum’s recent price action has sparked renewed bullish sentiment in the market, reflected in the ETH funding rates metric. It measures the aggression of buyers versus sellers in the futures market, where positive funding rates suggest bullish sentiment and negative rates indicate bearish sentiment.
Currently, the funding rates are in positive territory with a slight upward trend, indicating that futures traders have shifted towards a more optimistic outlook on Ethereum. However, despite this positive change, funding rates are still lower than levels seen in March, when ETH was in the early stages of a strong bullish trend. This disparity suggests that while there is growing bullish sentiment, it hasn’t yet reached the intensity required to fuel a significant breakout.
For Ethereum to overcome key resistance levels and sustain an upward trajectory, a higher funding rate would signal increased buying interest and confidence from futures traders. Higher funding rates would not only confirm participants’ willingness to go long on Ethereum but would also add upward pressure on the price, potentially leading to a stronger and more sustained rally.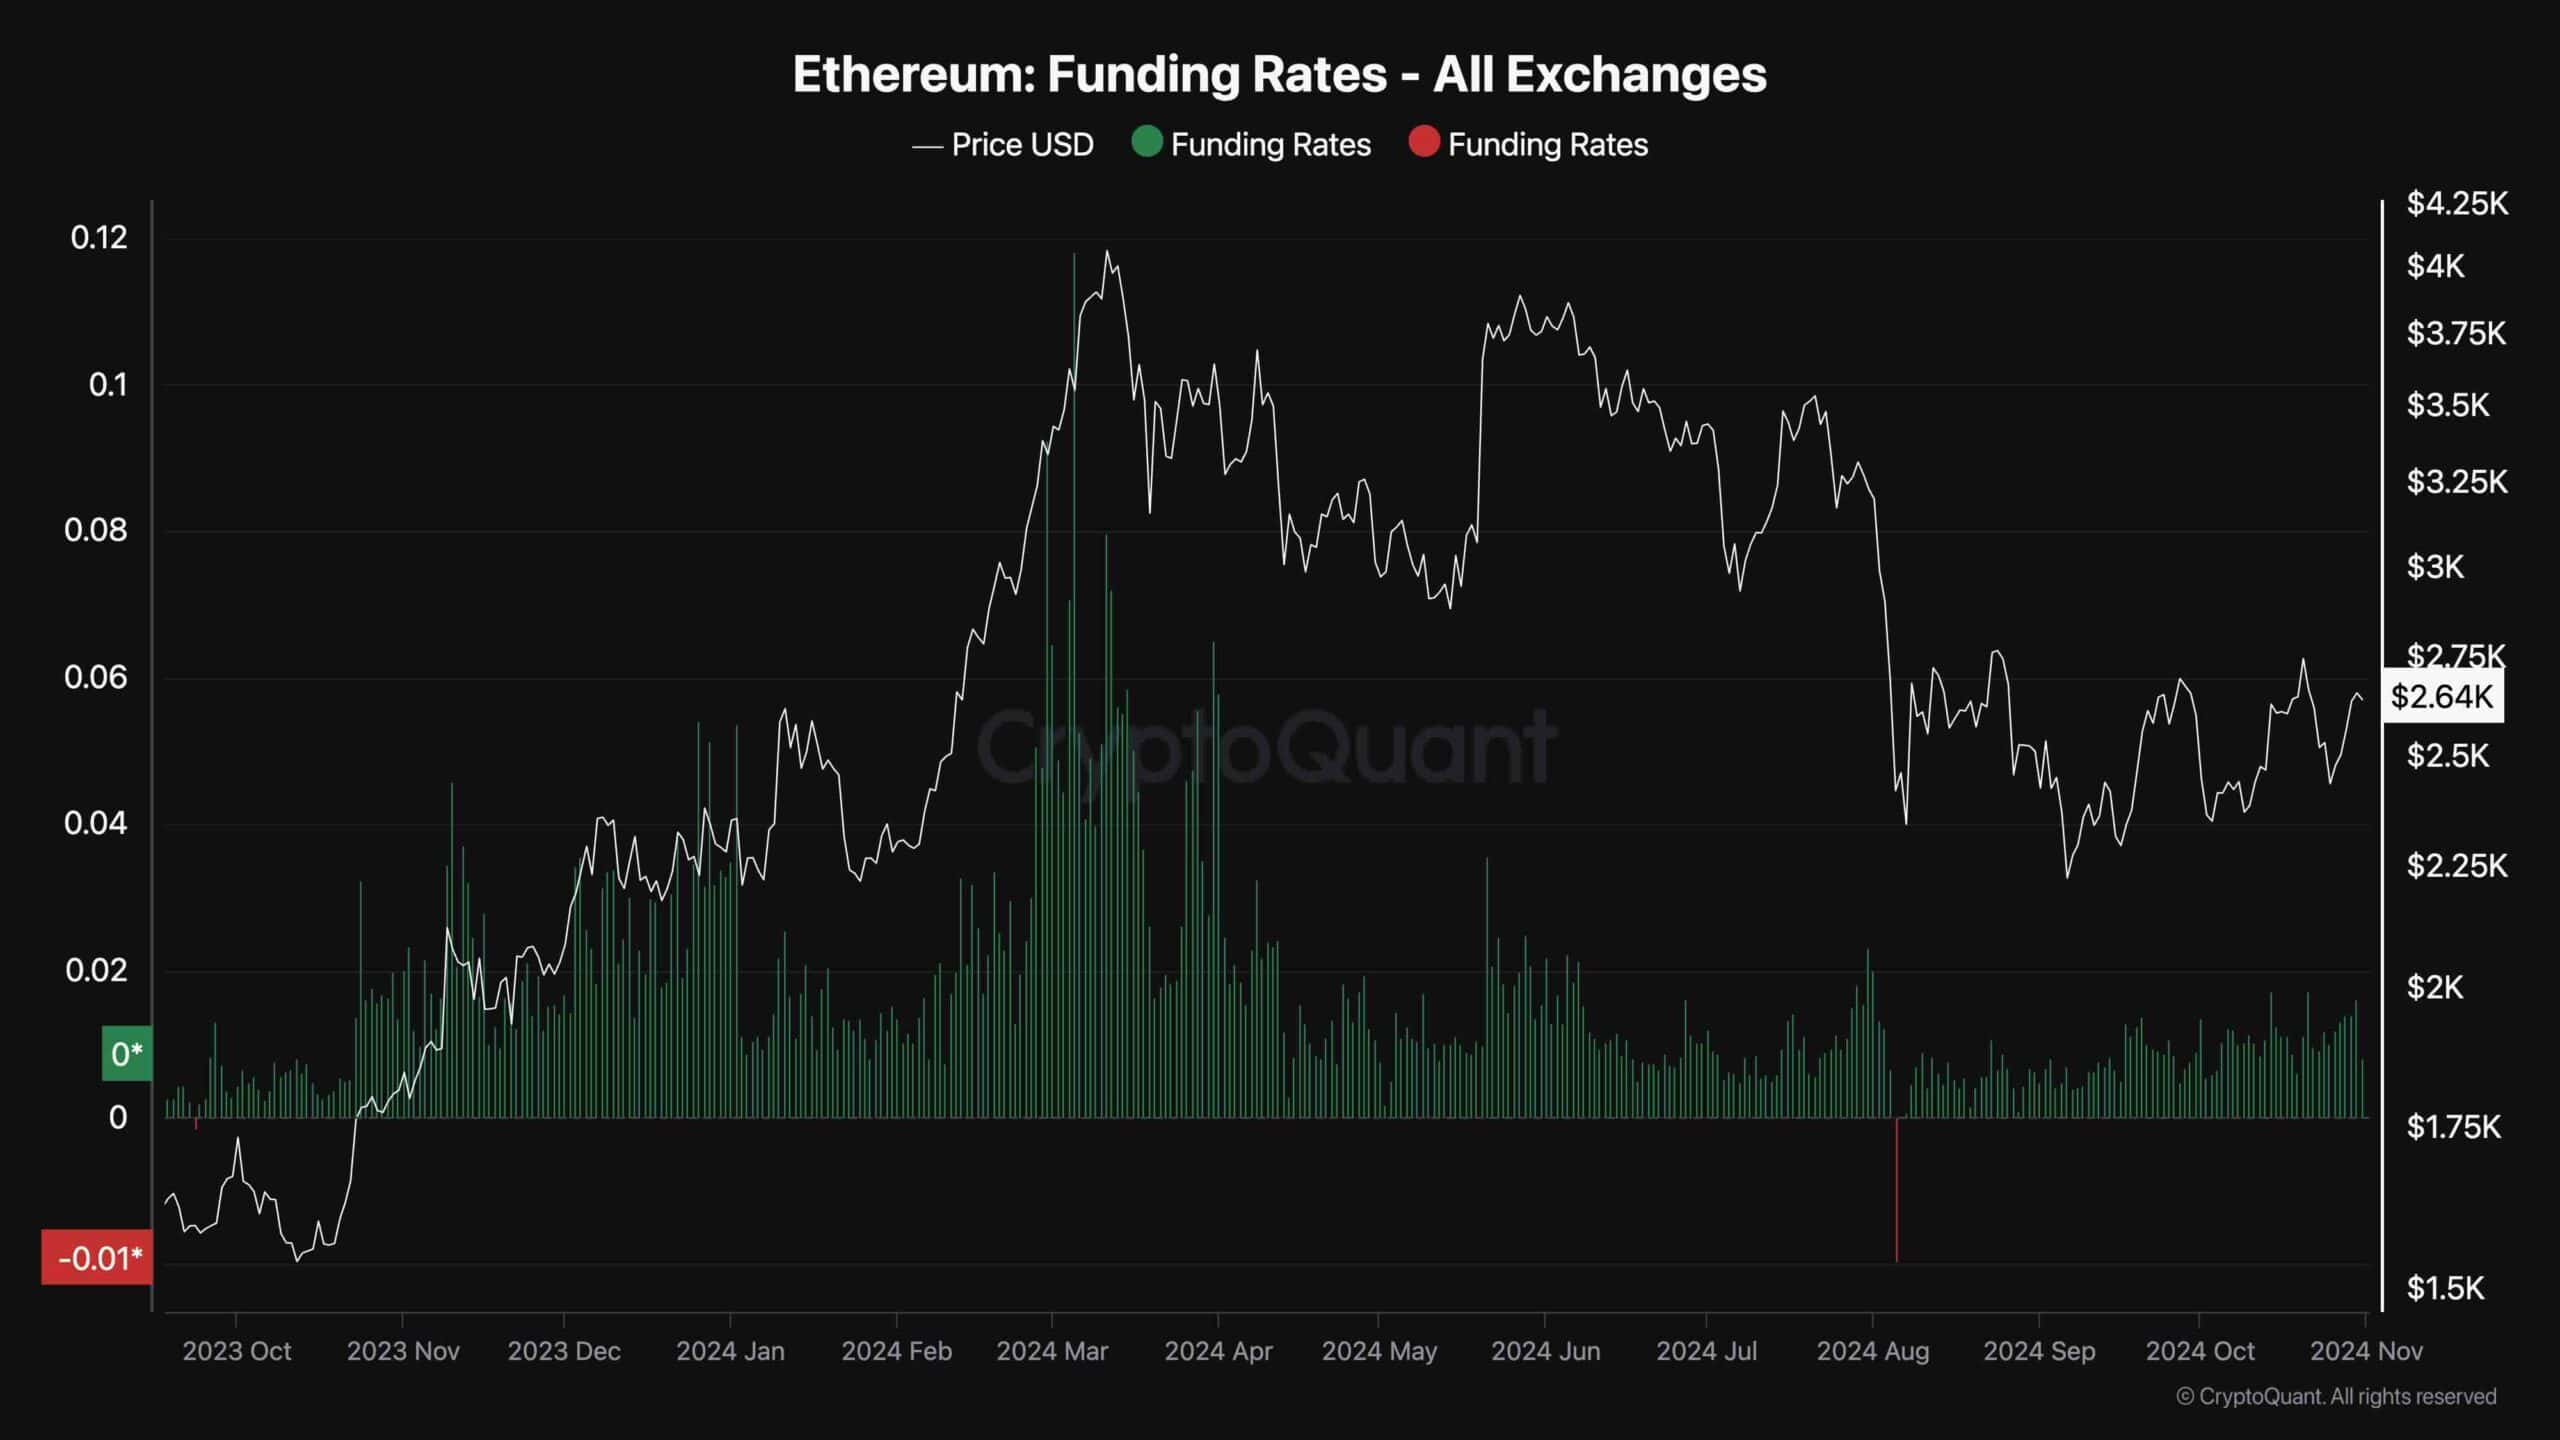
The post Ethereum Price Analysis: This Is the Level ETH Has to Overcome to Challenge $3K appeared first on CryptoPotato.


