Ethereum Price Analysis Oct.7: A Major Move Ahead
Over the past month, Ethereum is forming a triangle. The market is coiling towards the apex of the triangle that is currently being noticed in most charts. We can feel the tension while everyone is waiting to hear some anticipated news that will move the market.
In case of a breakout of this symmetric triangle, it will be the first sign of the market’s next mid-term direction.
ETH is currently down 84% from its all-time high, resting on a historical price level from 2017, around the $200 area.
Looking at the 4-hours chart
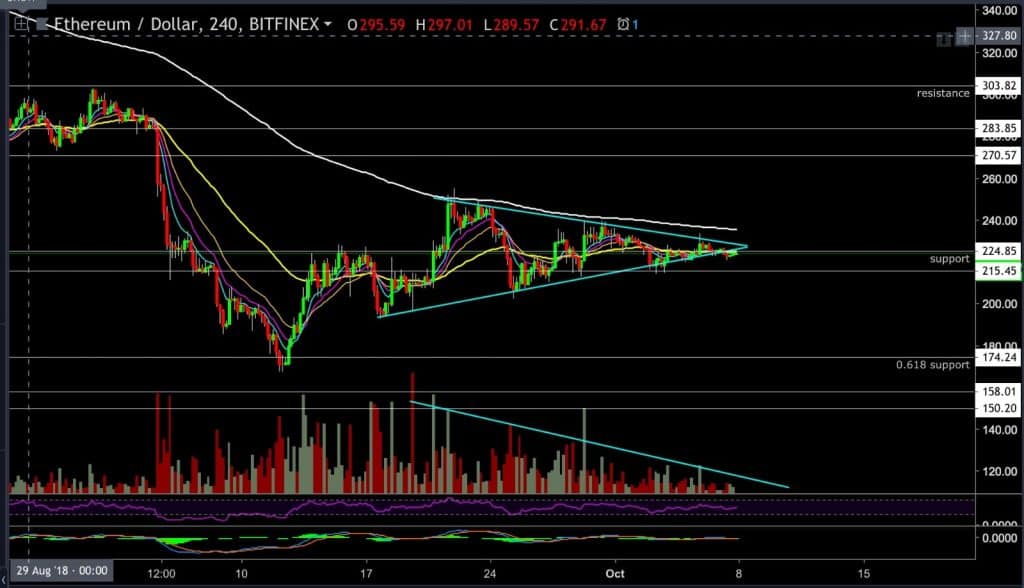
– The triangle is coiling up precisely on the historical support level. Five swings are building this formation, and we are very close to the expected apex in the next few days.
– EMA 200 (200 days exponential moving average) is acting as a resistance above the upper triangle’s trend line,
while 55 EMA is currently serving as a much closer resistance area.
– If we draw the triangle’s upper and lower trend-lines from the end of each candle and do not include the wicks of the candles, we can see that the lower trend-line is already acting as resistance rather than support – this is a bearish sign.
– The volume is decreasing as expected towards the triangle apex.
In conclusion
– a break above $230 with a substantial volume will be the first sign of a bullish ETH market sign, with the first target at the $270 level.
– a strong move down towards the $214 level will be a bearish sign, breaking it down will lead a target at $170-$180.
Since this triangle is very symmetrical and from the lower side we have the historical support, whilte from the upper side we have few EMA’s resistance levels, it’s smarter not to choose a side before getting an actual signal from the market.
Make sure to wait for a candle close, we are trading crypto and price manipulations are the name of the game. If you notice a “Hammer candle” from below or a “Shooting star” candle form from the top with strong volume and long wick – It will be first the sign of a possible trap.
ETH/USD BitFinex 4 Hours chart
 Cryptocurrency charts by TradingView. Technical analysis tools by Coinigy.
The post Ethereum Price Analysis Oct.7: A Major Move Ahead appeared first on CryptoPotato.