Ethereum Price Analysis Oct.31: ETH Picks a Side?
After a few very boring days with a sideways move and with very slim volatility, the market showed us some signs of life.
BTC had a single digit move down toward the lower trend line of the long-lasting triangle formation that we have seen in the daily chart for a very long time. And at the moment we can see an attempt to build momentum for an upward bounce.
The triangle formation will have to be broken in one way or another. We are getting closer and closer to the apex every day, and the tension is coiling up.
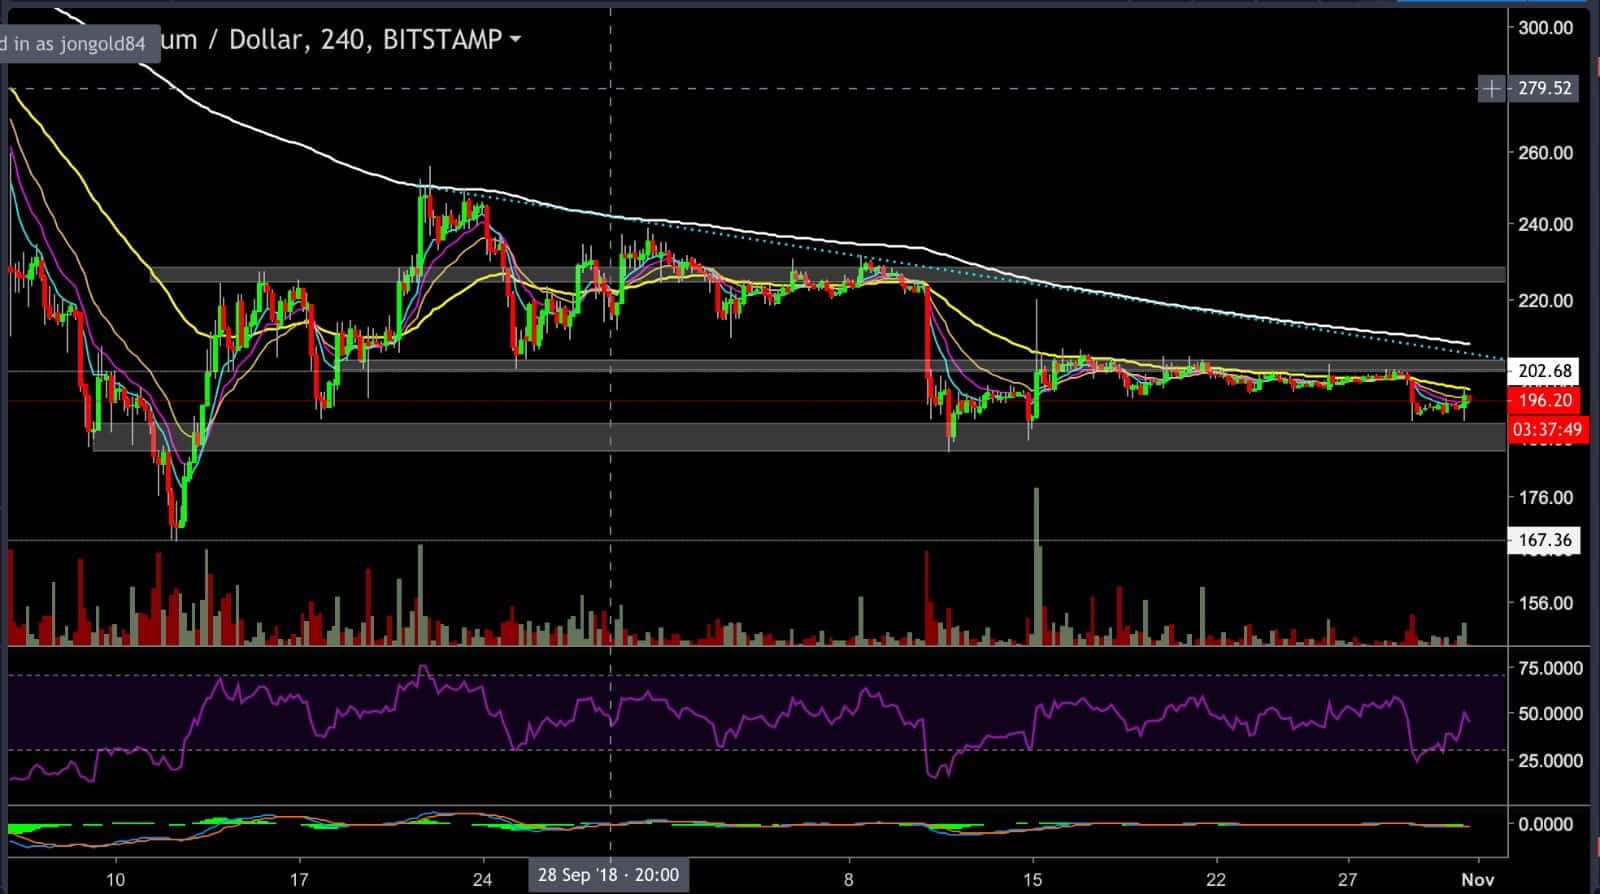
The ETH chart had a move down as well. The price declined toward the lower side of the channel, and from there it bounced back up to our current location at $196.5
Looking at the 4-hour chart
– ETH is still trading inside the channel boundaries between the $205 and $192 price levels. As we predicted in our last analysis, ETH declined toward the lower side of the channel at $190 and bounced out of it quickly to its current location.
– we expected this move to take place due to the fact that ETH couldn’t break the $205 resistance even on the 3rd attempt and the 200 EMA closed on it from the top and acted as an extra resisting force.
– At this moment the ETH chart is fighting against the EMA’s lines acting as resistance at the mid part of the channel ($196.5). If the bears win the fight and send ETH back to $192 – $185 price levels and break the channel support, it might trigger a potential decline toward the next support level at $167.
But if the bulls make a fight of it, we might see another leg up towards the upper price levels of the channel at $205.
A break above the channel resistance level ($205) can lead to a retest of the trend line from the daily chart (blue dotted line) and where 200 EMA is currently located.
– The RSI indicator had a short visit at the oversold regions but quickly climbed back to a natural zone.
ETH/USD BitStamp 4 Hours chart
Cryptocurrency charts by TradingView. Technical analysis tools by Coinigy.

The post Ethereum Price Analysis Oct.31: ETH Picks a Side? appeared first on CryptoPotato.


