Ethereum Price Analysis Nov.8: Sideways action. Soon to break down?
The crypto markets or more accurate, the Bitcoin market has been trading in a minor uptrend channel over the last ten days: since August the 30 Bitcoin’s price had gained around 4%.
Looking at a lower time frame view of the daily chart, BTC is still moving sideways inside the range of the descending triangle formation or the falling wedge formation (depending on your point of view).
Now to Ethereum: The ETH had gained 14% since August the 30 and is currently trading inside the upper channel (on the following chart).
Looking at the 4 hours chart
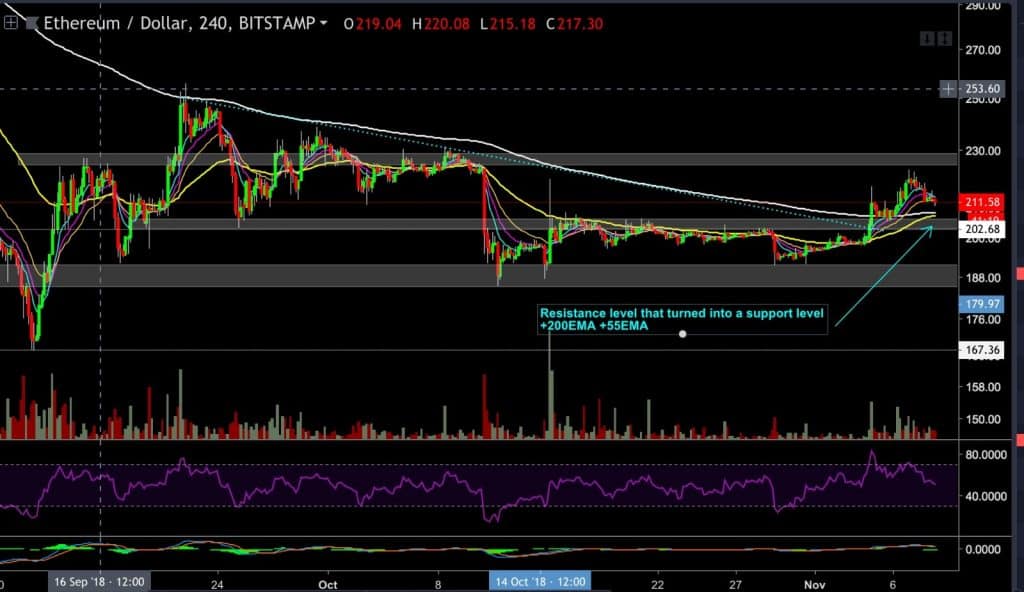
– ETH climbed above the last trading channel’s resistance level ($205-$206) and rallied all the way up to the $222, almost hitting the resistance level we mentioned in our previous analysis, the target at $224
-In the past 24 hours, we saw a correction of 4.5%, but there is still strong support close to the current price level. Notice that the last resistance ($205 – $206) has turned into support and that the 200 EMA (exponential moving average) and the 55 EMA lines are currently sitting on the same area and making the support even stronger. The sellers will have to show a lot of strength to break below this support level.
– In case that the bears will manage to pull price back below the $205-$206 support level, then ETH could decline to the $197 area or even lower – towards the next $192 support level.
– In case the bulls take the upper hand, we might see ETH attempting to attack the next resistance level ($224) one more time.
To summarize the above, we are in a sideways market. The crypto markets are waiting for the next significant news that might affect the trend. Be careful and be patient, the opportunities will pop-up at the right moment.
ETH/USD BitStamp 4 Hours chart
Cryptocurrency charts by TradingView. Technical analysis tools by Coinigy.

The post Ethereum Price Analysis Nov.8: Sideways action. Soon to break down? appeared first on CryptoPotato.


