Ethereum Price Analysis Nov.18: Looks like a correction before the next wave
After last week’s massive collapse where $20 billion worth of cryptos evaporated from the total market capitalization, bulls step in an attempt to hold the price above the support level.
Bitcoin is currently holding the $5,500 price level, and ETH is presently maintaining the $174 price level.
What we see is the most likely type of a temporary correction upward, in the middle of a broader downward trend direction. The market is still bearish.
Elliott wave’s analysis suggests that the decline is still not over yet and we expect to see another downward-going wave in the near future.
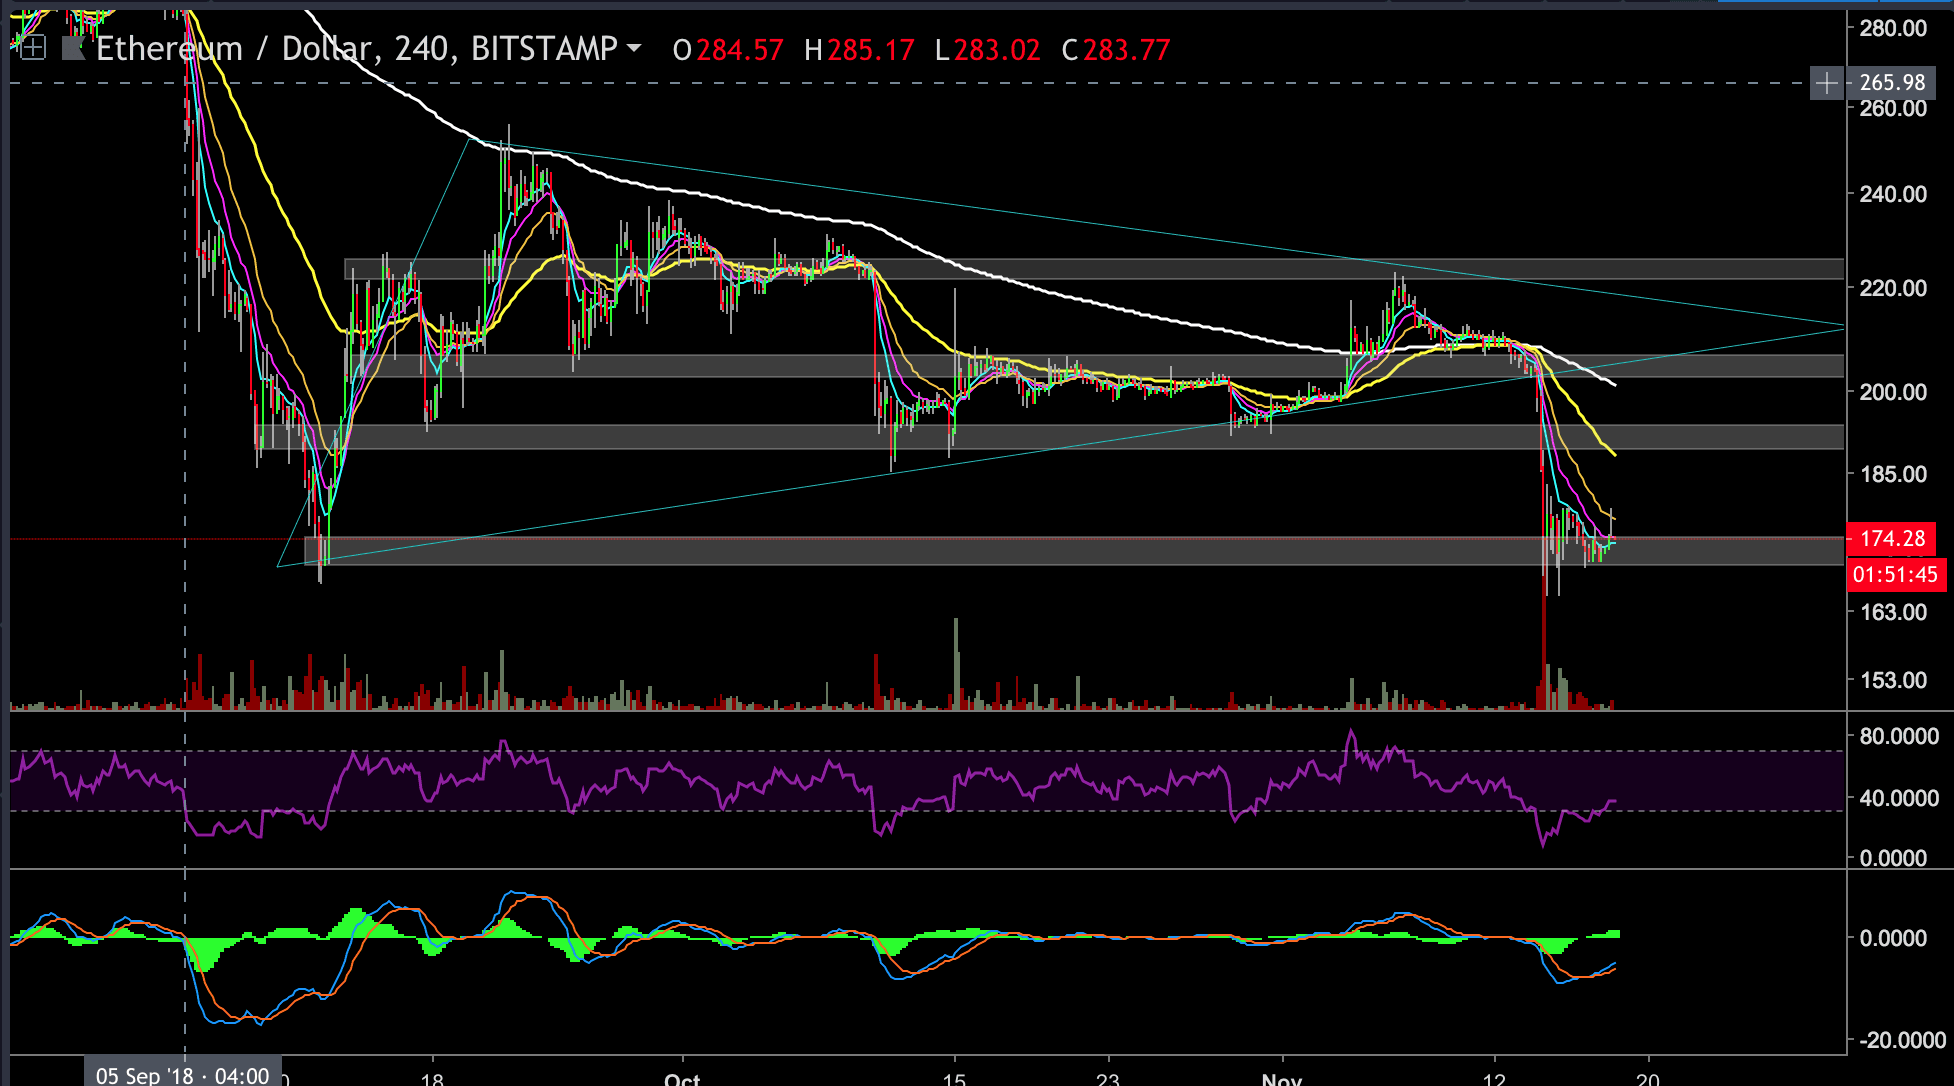
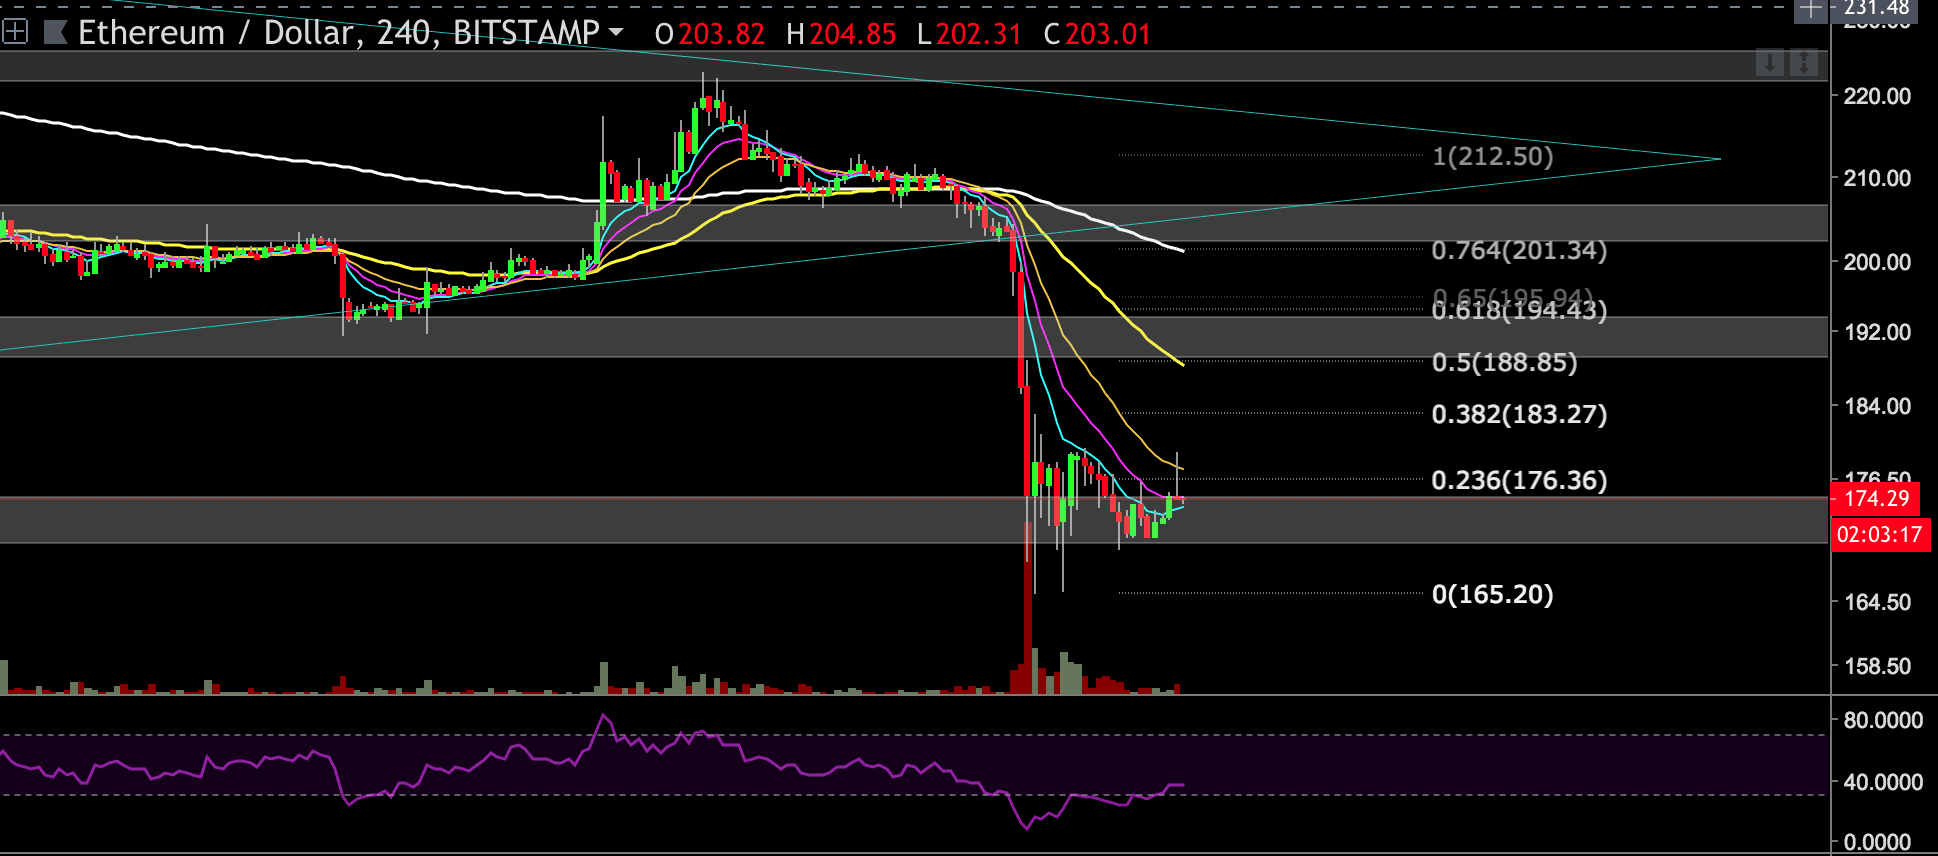
Looking at the 4 hours chart:
– ETH price is currently held above the 174$ support level with the three smaller EMA’s acting as close-range resistances (8/13/22 EMA’s on the following chart).
– We can notice a red “shooting star” candle (bearish candle formation) with a very long wick. The price hit the previous resistance at $178 and turned immediately turned back down.
– We should consider the possibility of another short move upward, as a “dead cat bounce” towards the 0.382 retracement level ($184) or even higher, towards the 0.5-0.618 Fibonacci retracement level ($190 resistance level) if the bulls will have enough strength against the bears, that are pushing the price lower.
– On the other hand, if the bears manage to push the price lower, in order to break the 168$ support level, the next target might be the $140-135 range.
– The RSI indicator is currently holding above 30 (4 hours chart) which signals that the bulls might get their chance to ‘fight’ and raise the price (a possible bullish sign).
– MACD histogram is ticking higher at the moment, with a positive crossover in the MACD’s averages.
ETH/USD BitStamp 4-Hours Chart
Cryptocurrency charts by TradingView. Technical analysis tools by Coinigy.
The post Ethereum Price Analysis Nov.18: Looks like a correction before the next wave appeared first on CryptoPotato.