Ethereum Price Analysis Nov.12: Low volatility. A move ahead?
The Crypto market is getting really really tense lately. Not much has changed regarding price levels since our last price analysis, but we can notice that the BTC volume is constantly shrinking.
ETH is currently trading at the $210 price level. We haven’t seen too much volatility in the ETH chart during the last three days. The price volatility was less than 3%, which is very low compared to Ethereum.
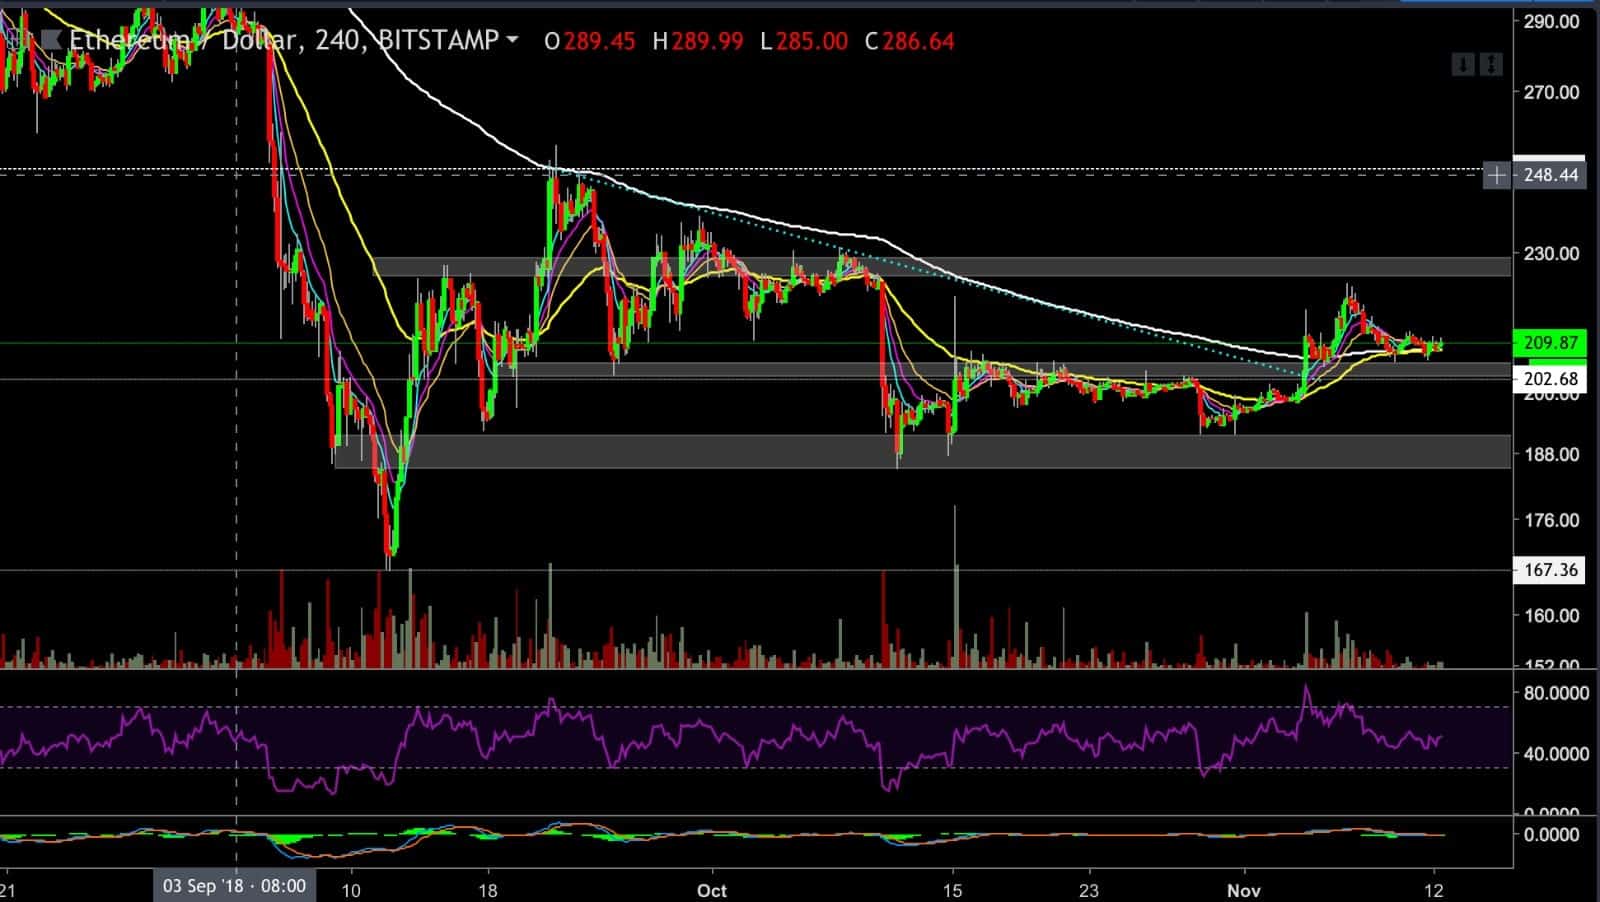
Looking at the 4 hours chart
- ETH is getting a strong support from the $206-$205 price territory. This area acts as resistance for the longer term.
- The 200 EMA and 55EMA are joining forces to support the price level as well.
- If the sellers will take control and manage to pull the ETH price below this strong support level, we will probably see the price back to the $192 levels. but if ETH will hold this support level, as it looks like that at the moment, we could see a very nice mini-rally developing soon.
- In the above case, the first target could be at the $224 price level, but if the bulls will show strength – we might go straight to the $250 area for ETH.

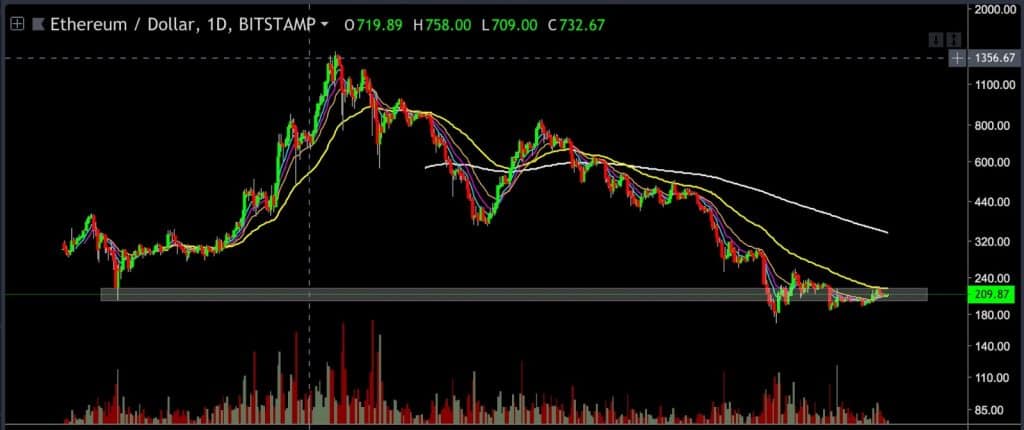
ETH/USD BitStamp 1 Day Chart
It is noticeable in the following daily chart that ETH is playing around with a historic price level between the $200 to $220.
ETH developed a triangle formation on this historic support level and currently moving closer and closer towards the triangle’s apex (where the to contracting lines of the triangle meet). The volume is typically shrinking toward the triangle’s apex and we should see a pretty aggressive move to ETH one of the sides coming very soon.

Cryptocurrency charts by TradingView. Technical analysis tools by Coinigy.
The post Ethereum Price Analysis Nov.12: Low volatility. A move ahead? appeared first on CryptoPotato.


