Ethereum Price Analysis May 24: ETH Back Above $250, Can It Hold?
Ethereum has seen a rebound over the past 24 hours which amounts to positive 3.78 percent, allowing its price to climb back above $250 where it currently trades at $251. Ethereum has now seen a 42% price surge over the past 30 days with a further 68% increase over the past 90 days.
Ethereum currently holds a market cap value of $26.63 billion which puts it in second place amongst the top cryptocurrencies.
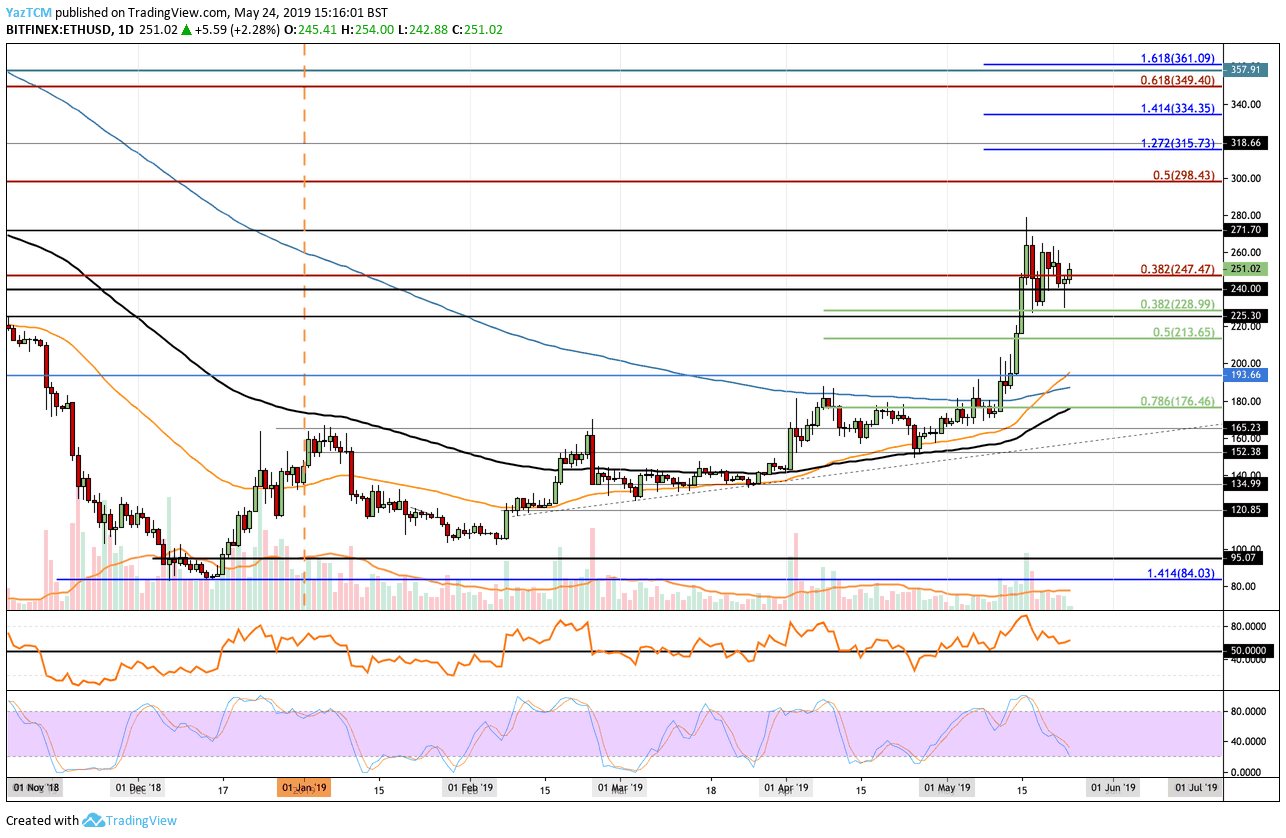
Looking at the ETH/USD 1-Day Chart:
- Since our previous ETH/USD analysis, we can see that ETH/USD had spiked lower into the highlighted support at $228, once again, before rebounding back above $250.
- From above: The nearest level of resistance now lies at $271 and $280. Above $280, further resistance lies between $298 – $300. The resistance at $300 is strengthened by the bearish .5 Fibonacci Retracement level (marked in red) located at $298. Above $300, further resistance lies at $315, $334 and $349.
- From below: The nearest level of support now lies at $250. Beneath $250, further support lies at $240 and $228. Below $228 support lies at $213 and $200.
- The Stochastic RSI has recently approached overbought conditions. We will watch for the crossover above to provide a bullish signal higher.
- The trading volume has started to slowly increase back toward the May 2019 average.
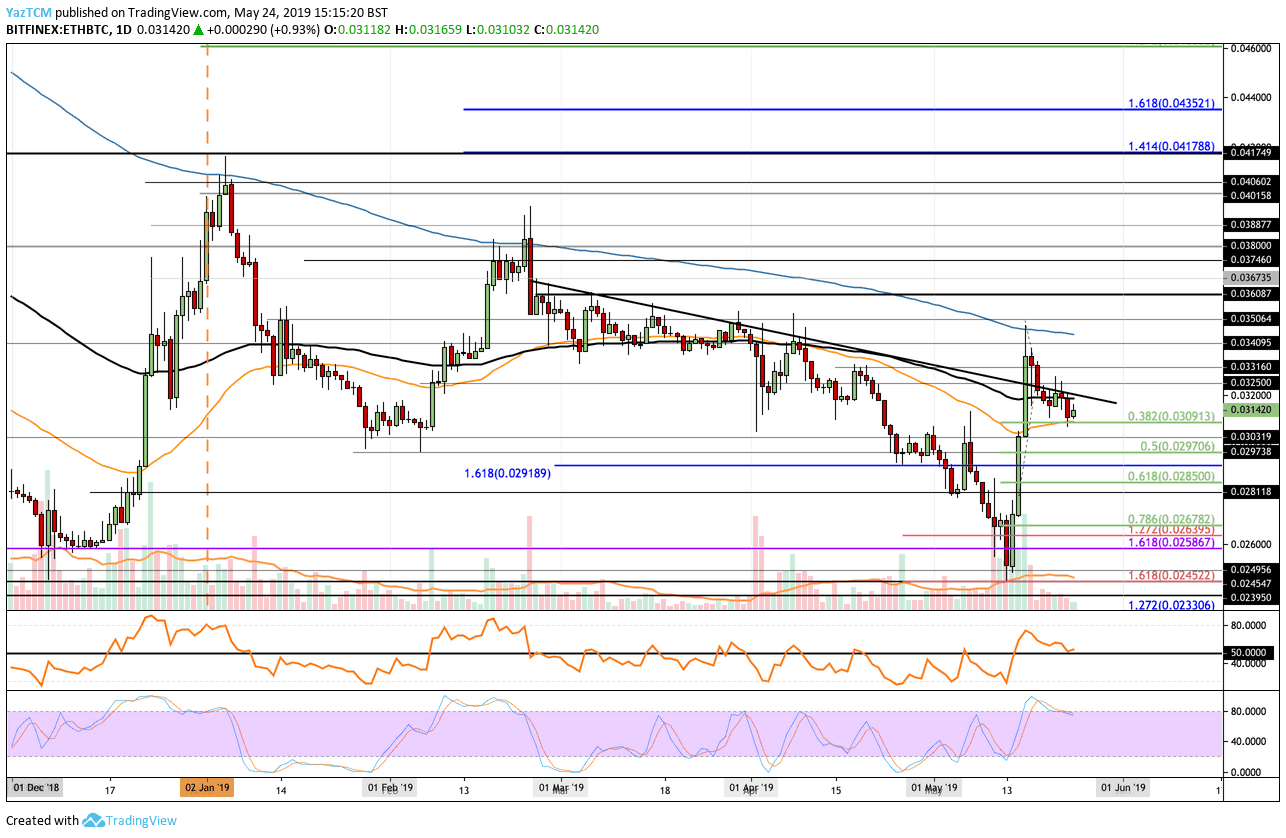
Looking at the ETH/BTC 1-Day Chart:
- Against Bitcoin, we can see that ETH/BTC continues to hold the support around the 0.0309 BTC level and has rebounded higher to where it currently trades at around 0.03142 BTC.
- From above: The nearest level of resistance now lies at 0.032 BTC which contains the 100-day moving average Above this, higher resistance is then expected at 0.0325 BTC, 0.03316 BTC, 0.034 BTC, and 0.035 BTC.
- From below: The nearest level of support now lies at 0.030 BTC. Beneath 0.03 BTC, further support lies at 0.02970 BTC, 0.02918 BTC, 0.0285 BTC and 0.028 BTC.
- The trading volume still remains far below the average in May 2019.
- The Stochastic RSI warns traders to be cautious as it trades in overbought conditions. A crossover below would signal a push lower.
The post Ethereum Price Analysis May 24: ETH Back Above $250, Can It Hold? appeared first on CryptoPotato.