Ethereum Price Analysis Mar.18: ETH On a Decision Point Facing The Crucial $142 Resistance
Ethereum has risen by a minor 3% over the past 7 trading days, bringing the current price up to $141. The market had managed to break above the significant resistance at $142 but has failed to remain above this level. However, the sideways movement we have seen over the past few weeks has started to show signs that the market is ready to move higher.
Looking at the ETH/USD 1-Day Chart:
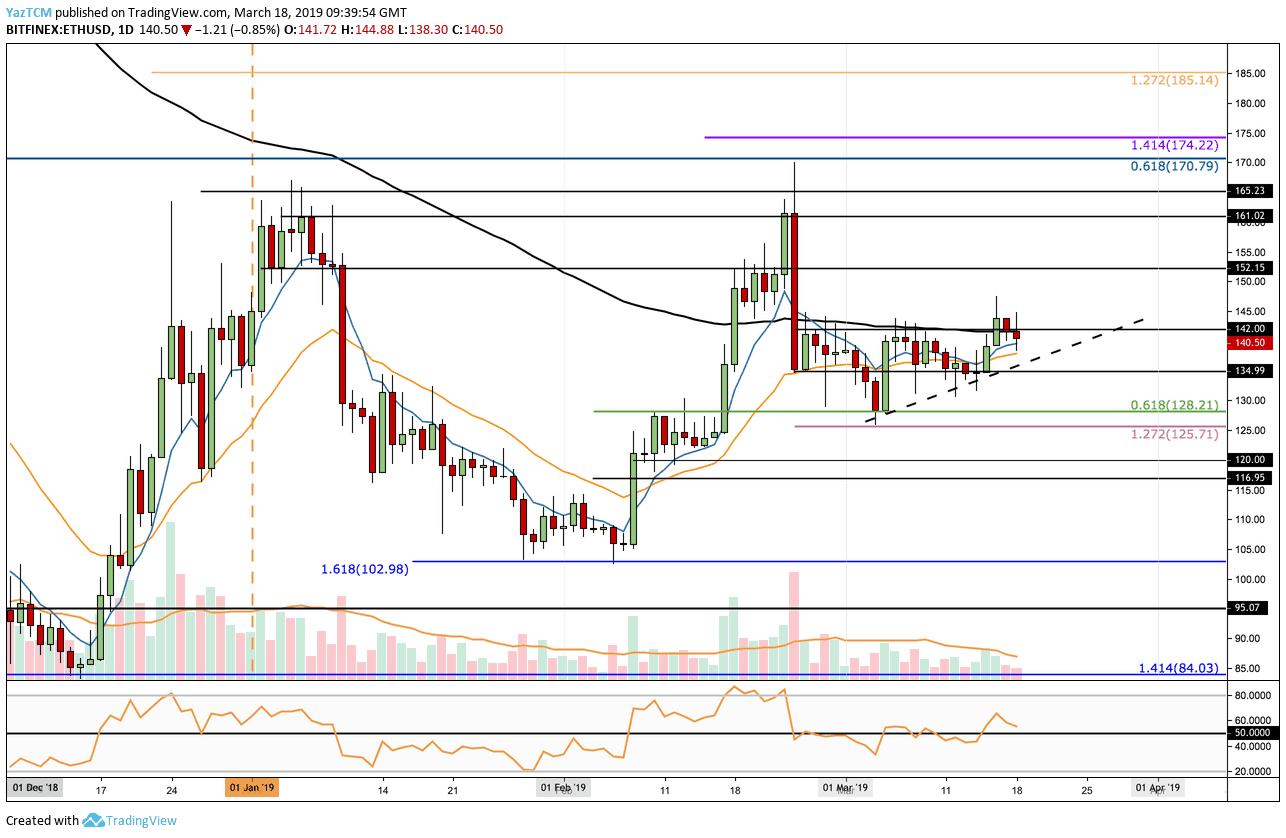
- Since our previous ETH/USD analysis, we can see that Ethereum had recently been successful in breaking above the March resistance at the $142 level. However, the price action was unable to capitalize on this break any higher and has now returned back beneath the $142 resistance level.
- From above: The nearest resistance above lies at $142 again. Above this, higher resistance lies at $152, $161 and $165. If the buyers bring the market above $165 we can expect a more significant resistance at $170 where the long term bearish .618 Fibonacci Retracement lies, measured from the November 2018 high to the December 2018 low.
- From below: The nearest level of support lies at the rising trend line (dashed line). Beneath this, we can expect support at $135, $128, $125 and $120. If the sellers break beneath $120, additional support then lies at $117, $110 and $103.
- The RSI has managed to break up above the 50 level as the buyers take control of the market momentum. We will need to see the RSI rise higher to see the market continuing to climb.
- The trading volume remains lower than the 2019 average.

Looking at the ETH/BTC 1-Day Chart:
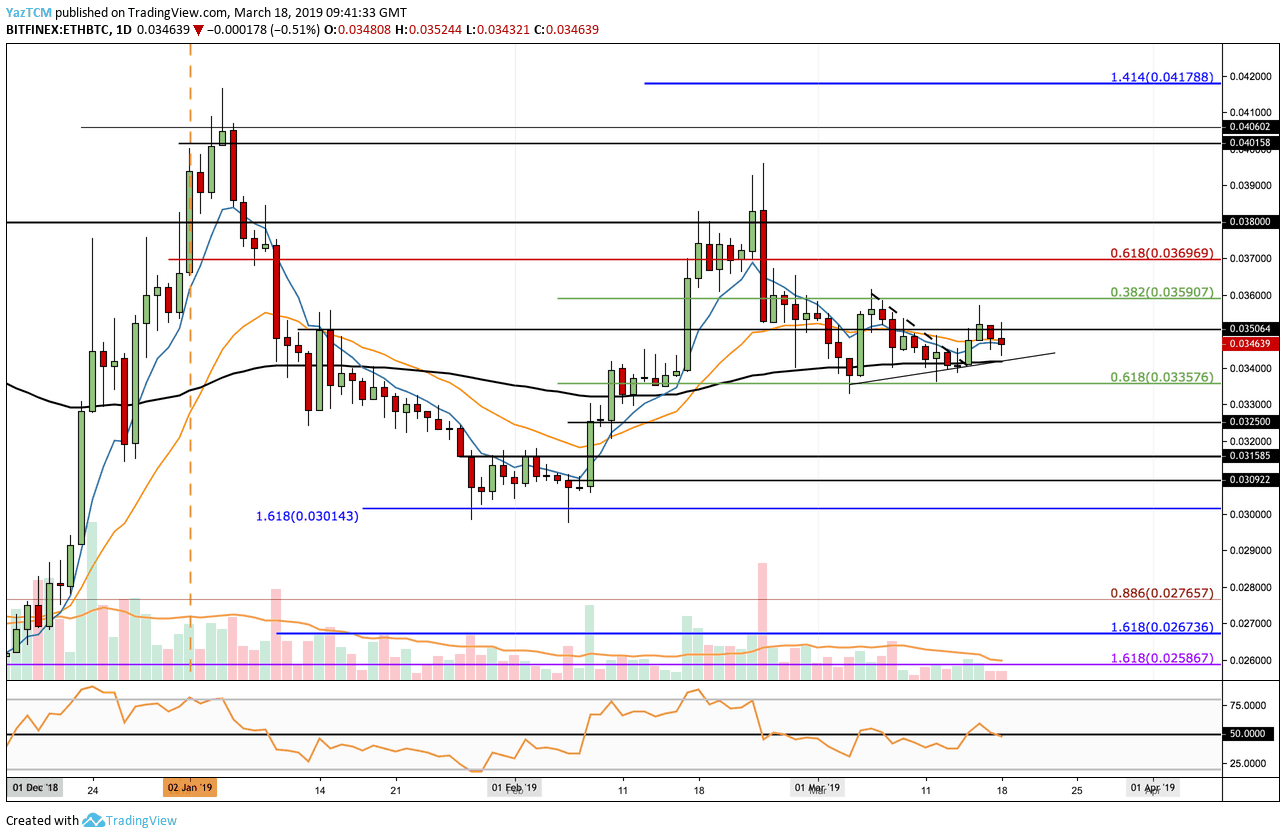
- Following our previous ETH/BTC analysis, we can see that the cryptocurrency had managed to break above the short term descending trend line we had previously highlighted. It then continued to rise but was unable to hold above the 0.035 BTC level. ETH has since fallen below 0.035 BTC to where it is currently trading at 0.03463.
- From above: The nearest resistance lies at 0.035 BTC. This is then followed with resistance at 0.03590 BTC, 0.037 BTC and 0.038 BTC. If the buyers can break above 0.039 BTC, higher resistance lies at 0.040BTC and 0.041788 BTC.
- From below: The nearest support lies at the short term rising trend line. This is then followed with more support at 0.03357 BTC where the short term .618 Fibonacci Retracement level lies. Beneath 0.033 BTC we can expect more support at 0.0325 BTC, 0.03158 BTC and 0.030 BTC.
- The RSI had managed to break above 50 but has now returned to the 50 handle which indicates indecision within the market.
- The trading volume also remains low in the ETH/BTC market.

The post Ethereum Price Analysis Mar.18: ETH On a Decision Point Facing The Crucial $142 Resistance appeared first on CryptoPotato.


