Ethereum Price Analysis June.11 – ETH Retraces From Resistance At $250
Ethereum has fallen by a small 1.50% over the past 24 hours, causing the asset to drop toward the $239.20 level. ETH recently rebounded from support around $226 but was unable to break above the $250 resistance level, leading to the mentioned price fall.
Despite recent price declines – Ethereum is still up by a total of 27% over the past 30 days, with a further 80% price surge over the past 90 trading days. Ethereum remains ranked in 2nd place on CoinMarketCap as it presently holds a $25.66 billion market cap value at press time.
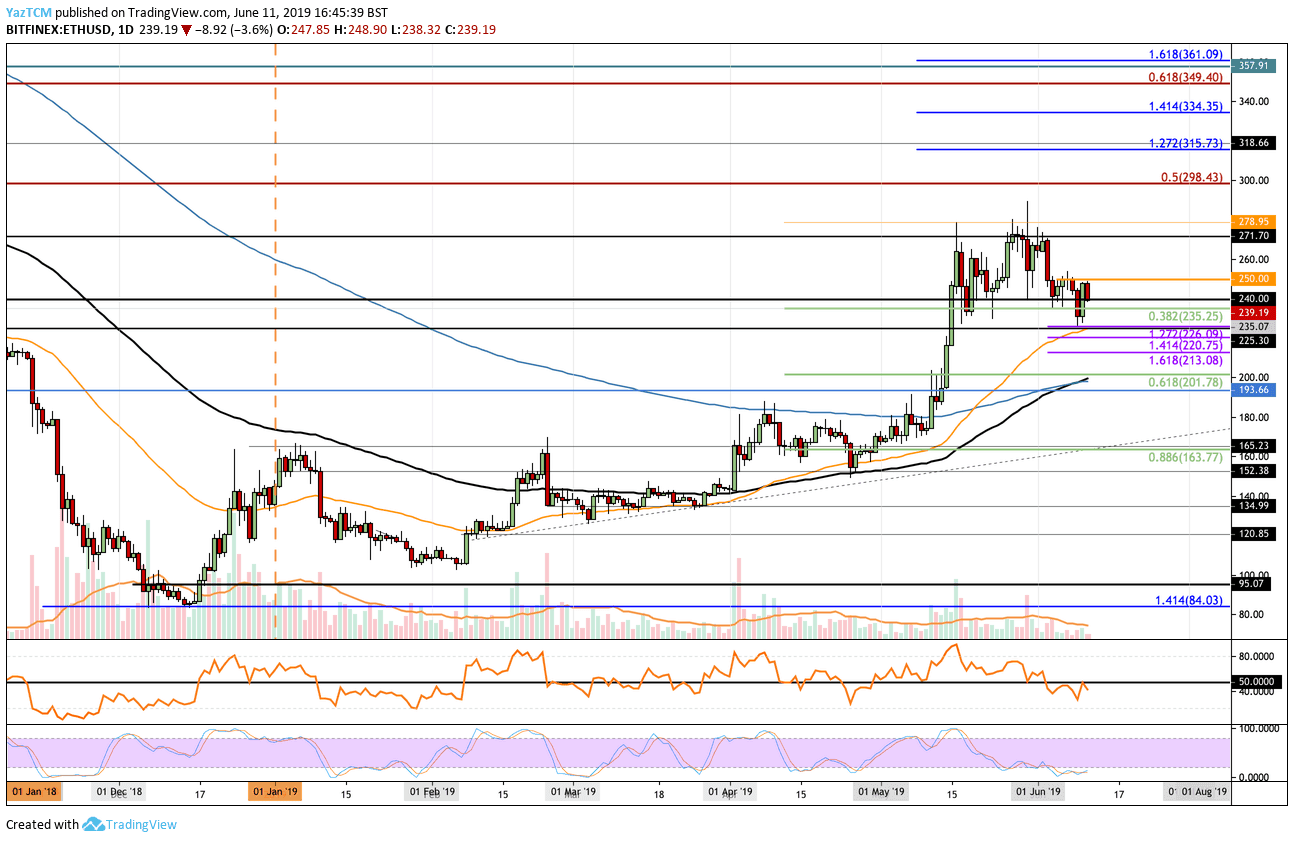
Looking at the ETH/USD 1-Day Chart:
- Since our previous ETH/USD analysis, we can see Ethereum went on to drop beneath support at $240 but found further support at $225 where it saw a rebound. Ethereum has recently turned away from $250 where it faced resistance.
- From above; The nearest level of resistance now lies at $250. Above this, higher resistance is located at $271, $279 and $298. If the bulls continue above $300, higher resistance exists at $315, $334 and $350.
- From below: The nearest level of support now sits at $235. Beneath this, further support is located at $226, $220, $213 and $201. If selling continues beneath $200, strong support can be located at $194.
- The Stochastic RSI currently trades in extreme oversold conditions as we wait for a bullish crossover signal above. The RSI has recently broken beneath the 50-level to show that sellers are in control of current momentum.
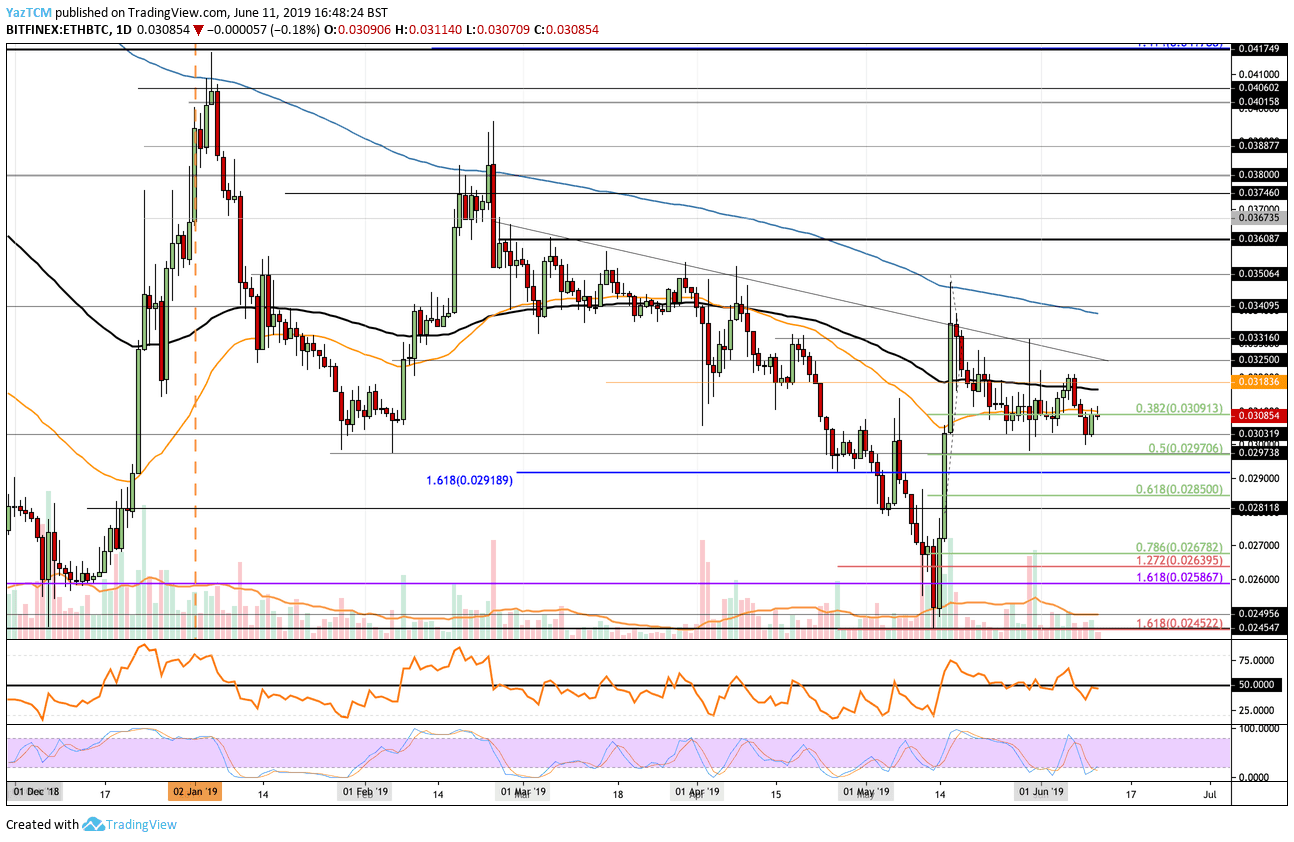
Looking at the ETH/BTC 1-Day Chart:
- Against Bitcoin, we can see ETH has done extremely well holding support at the 0.03 BTC level. The asset, however, is really struggling in making any amount of movement higher.
- From above: The nearest level of resistance lies at 0.031 BTC and 0.03185 BTC. Above this, higher resistance exists at 0.032 BTC, 0.03316 BTC and 0.034 BTC.
- From below: The nearest level of support sits at 0.030 BTC. Beneath this, further support lies at 0.02979 BTC, 0.02918 BTC, 0.0285 BTC and 0.02818 BTC.
- The trading volume remains at roughly the average level for ETH/BTC/
- The Stochastic RSI recently delivered a bullish crossover signal which indicates a potential move higher.
The post Ethereum Price Analysis June.11 – ETH Retraces From Resistance At $250 appeared first on CryptoPotato.