Ethereum Price Analysis Jan.6: ETH Is Looking At $160 and Bitcoin’s Triangle
The market is currently cooling up to build momentum for another potential move.
Notice the symmetric triangle formation that is evolving on the Bitcoin’s chart: A positive break of this formation could easily lead to a breach of the inverse Head and Shoulders trigger line. In such scenario, BTC could potentially rally toward one of the formation’s targets.
A reasonable target in such scenario could be found around the $5000 – $5200 price level, but as we mentioned before, targets (as well as TA) are not science.
Before reaching the $5K area, there is a strong resistance level at $4500. It won’t be easy for the bulls to break through this resistance level.
Now, let’s talk about Ethereum: ETH is currently trading at the $152.35 price level, as of now.
ETH retested the $160 resistance and got rejected one more time. A lot depends on Bitcoin, but breaking the $160 is essential to continue North.
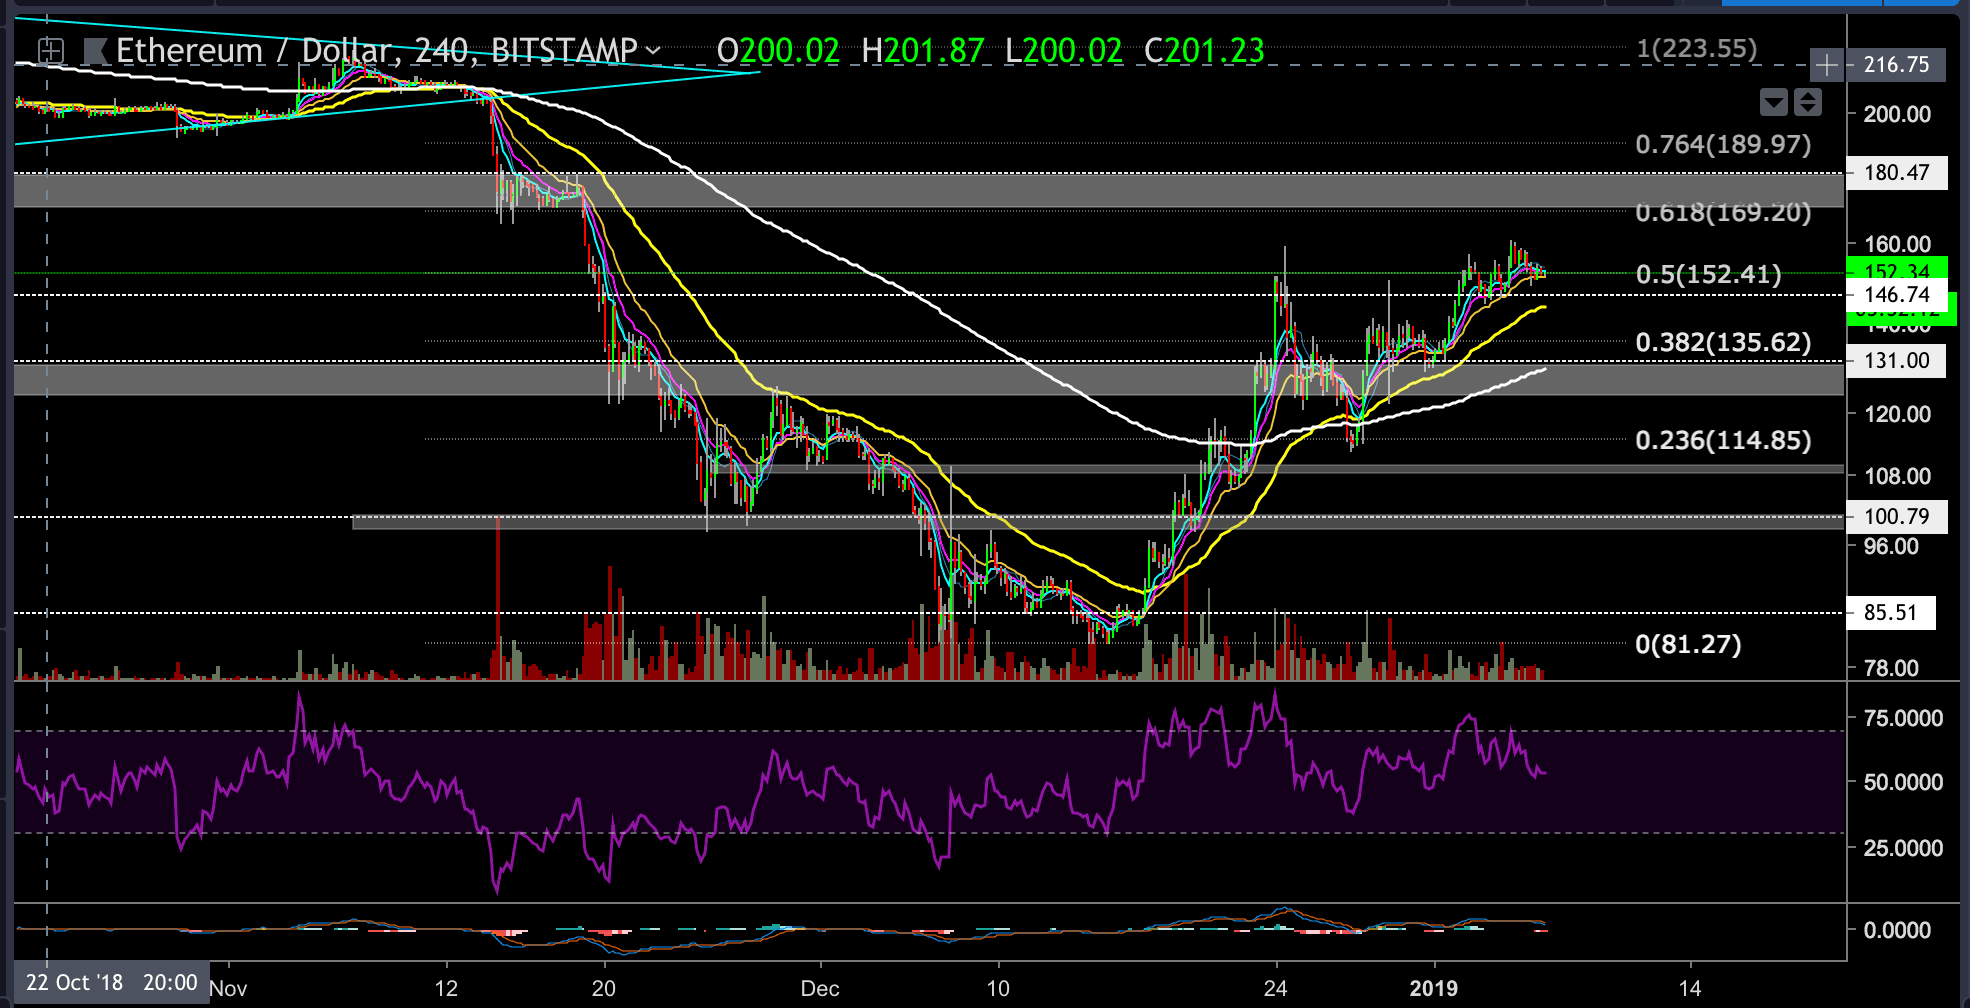
Looking at the 4-hour chart (Bitstamp)
- ETH is currently trading between the $146 support level and the $160 resistance level.
- The Next potential bullish target could be found at the $170 – $180 resistance level (which is a 10%-17% move). It is also the 0.618 – 0.764 Fibonacci retracement level and a sweet spot for the bears to re-enter their short positions, so Bull’s longing should be looking at the $170-$180 price levels for a right place to take some risk of the table.
- On the other hand, failing to break up the $160 level is likely to send ETH to retest the $146 support level or even lower – the next support lies around $131 – $124 range.
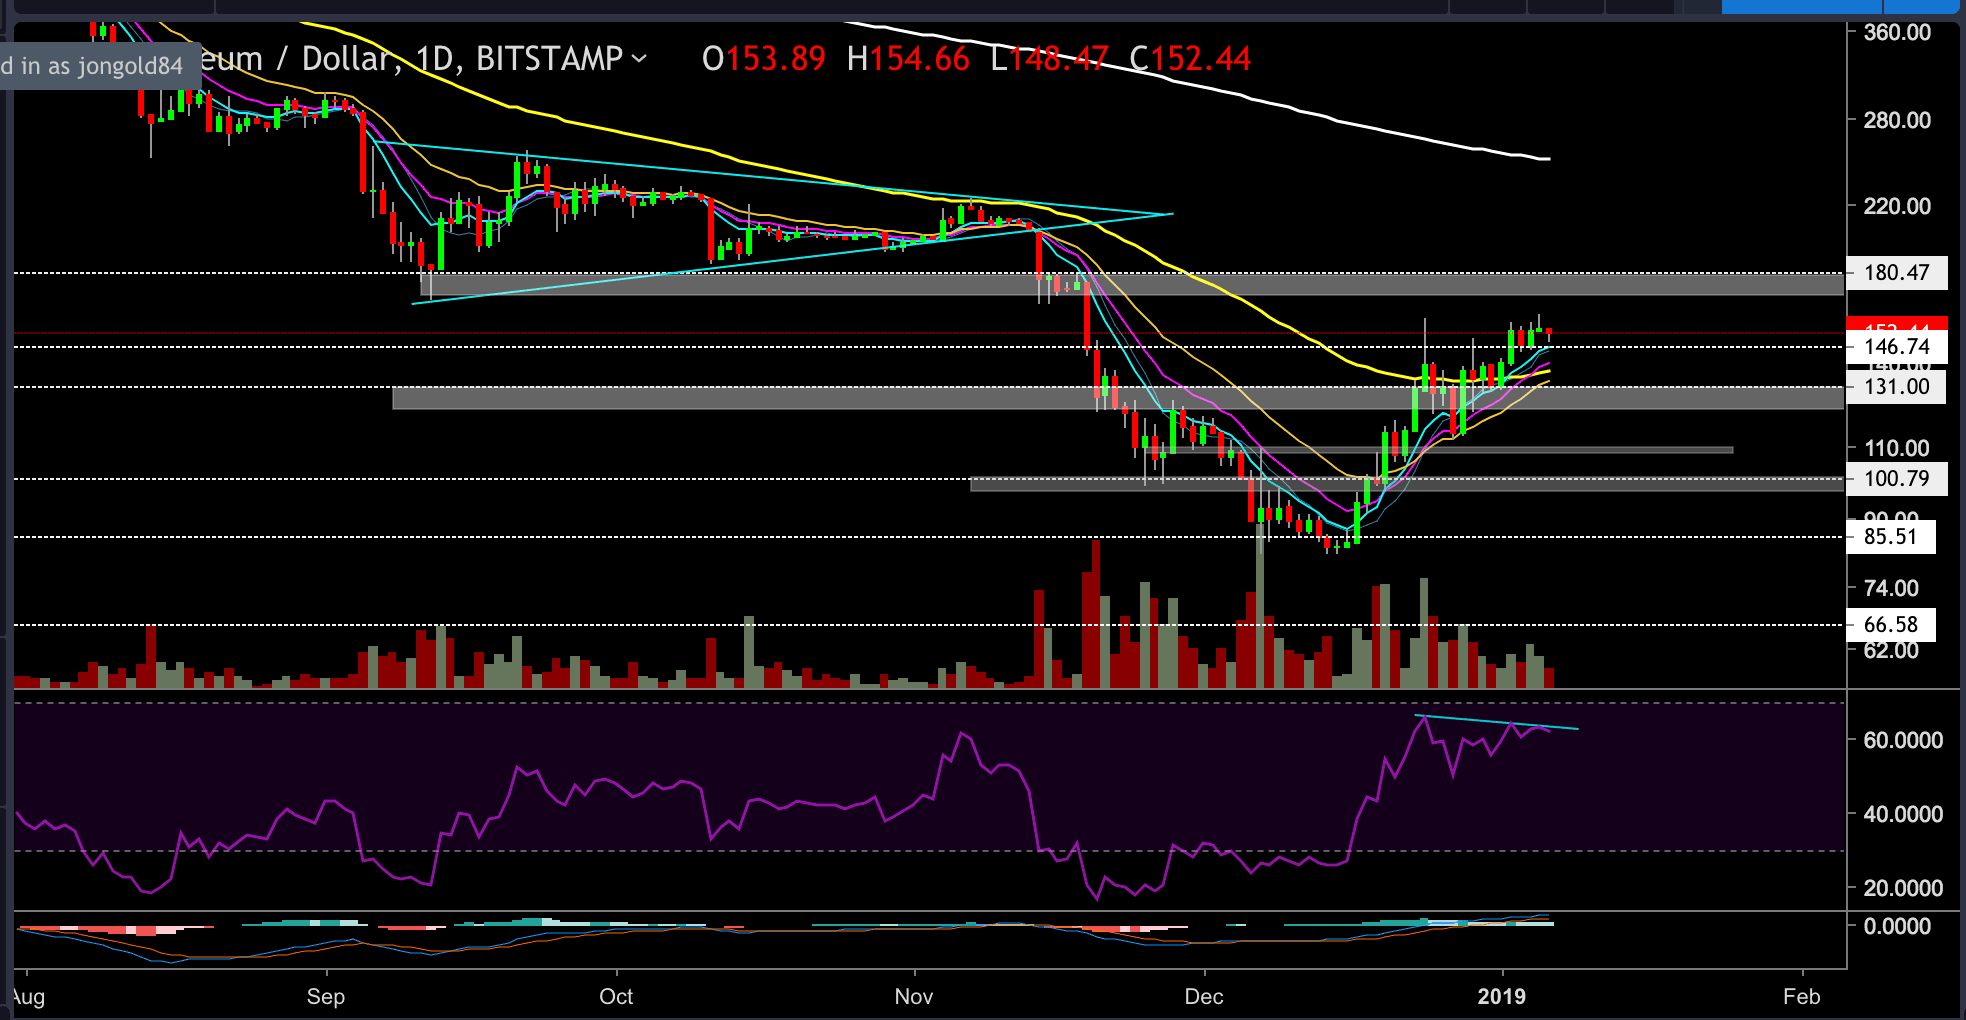
Looking at the ETH 1-day chart (Bitstamp)
- We can notice how the 8, 13 and 21 days EMA’s are crossing above the 55 EMA (the yellow line on the following chart). It is a bullish sign for a potentially positive move. We would like to see those EMA’s climbing vertically above the 55 EMA.
- If the bulls manage to rally toward the $170 – $180 resistance level and to breach above it, then the $214 price level could be the next target, but as of now, it is too early to say.
- The RSI indicator is consolidating nicely at the upper side of the channel. If the light-blue trend line gets breached up, then it could signal a mini-rally.
The post Ethereum Price Analysis Jan.6: ETH Is Looking At $160 and Bitcoin’s Triangle appeared first on CryptoPotato.