Ethereum Price Analysis Jan.3: What’s Next For ETH Following a 30% Gain In 7 Days?
In our previous ETH analysis, we discussed the potential of the inverted Head and Shoulders formation that is currently developing in the Bitcoin’s chart. If this formation turns out to be valid, then it will likely affect the total crypto market and Ethereum as well,
At the moment of writing this, BTC chart is trading around the $3800 price level and might finish building the left shoulder of the mentioned formation.
For this formation to take place, first we want to see BTC price rise to the neckline at $4335 and then to break above the resistance level, this can grant Bitcoin next targets at $5000 and beyond. However, until the above scenario takes place, nothing has changed.
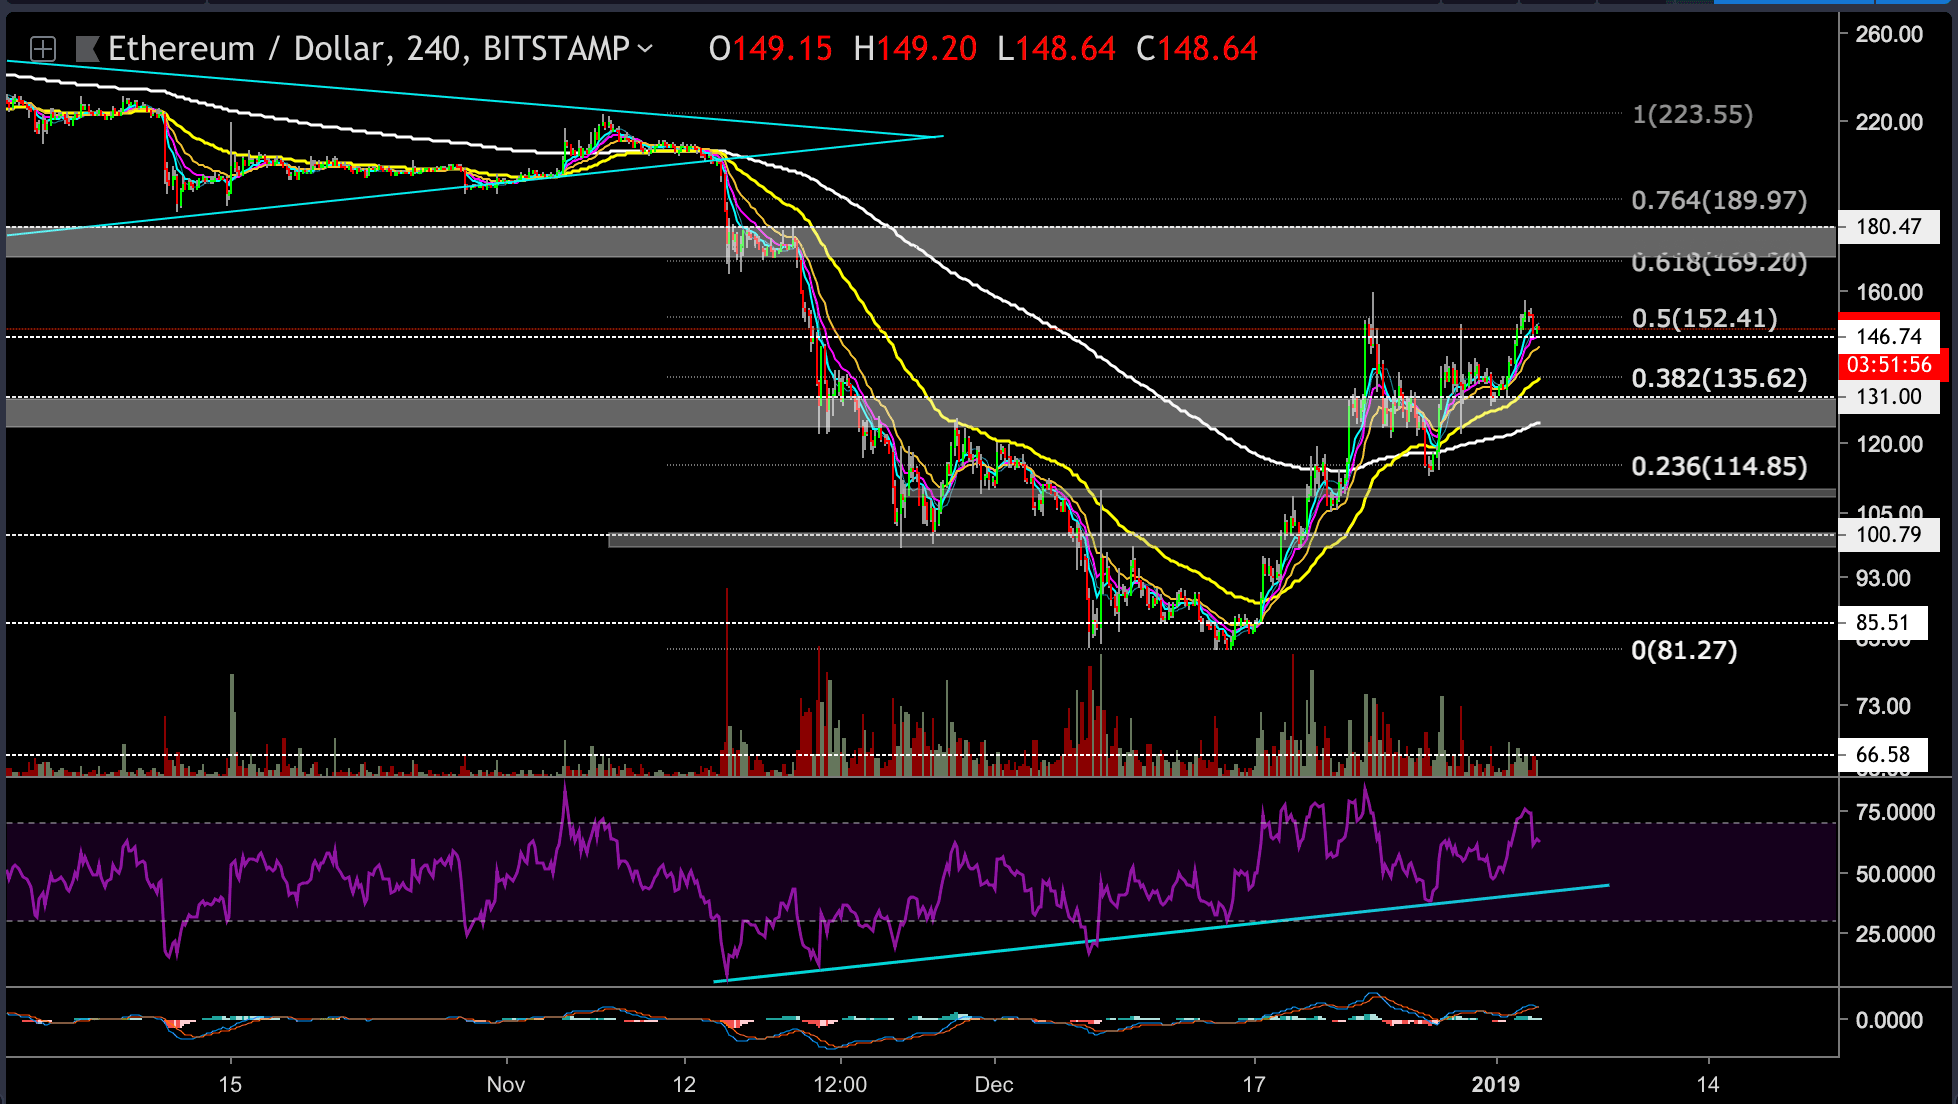
ETH chart reached our expected target on top the $146 resistance level. This level is also the 0.5 Fibonacci retracement of the significant drop started in November when ETH broke down the triangle formation on the daily chart (around $200).
Looking at the 4-hour ETH-USD chart (Bitstamp)
- Over the last 24 hours, ETH reached our given target at the $146 resistance level and continued higher all the way up to $156 where it encountered resistance. From there, a move down to retest $146, now as a support
- If ETH bounces of the resistance turned support level, then it might attempt to retest the $156 one more time and even the $158 which was the last rally’s peak.
- In case those two resistance level get breached, then the next bullish target is waiting at the 0.618 Fib retracement level at $169 – $174 area.
- On the other hand, the current 0.5 Fib level is not an easy resistance task to break up, and ETH might fall back toward the $124 – $130 support level, where lies the 55 and 200 EMAs.
- This scenario is very likely to take place, and it could be a part of a triangle formation that might be evolving on the 4-hour chart. This type of consolidation could build up new momentum for another leg up.
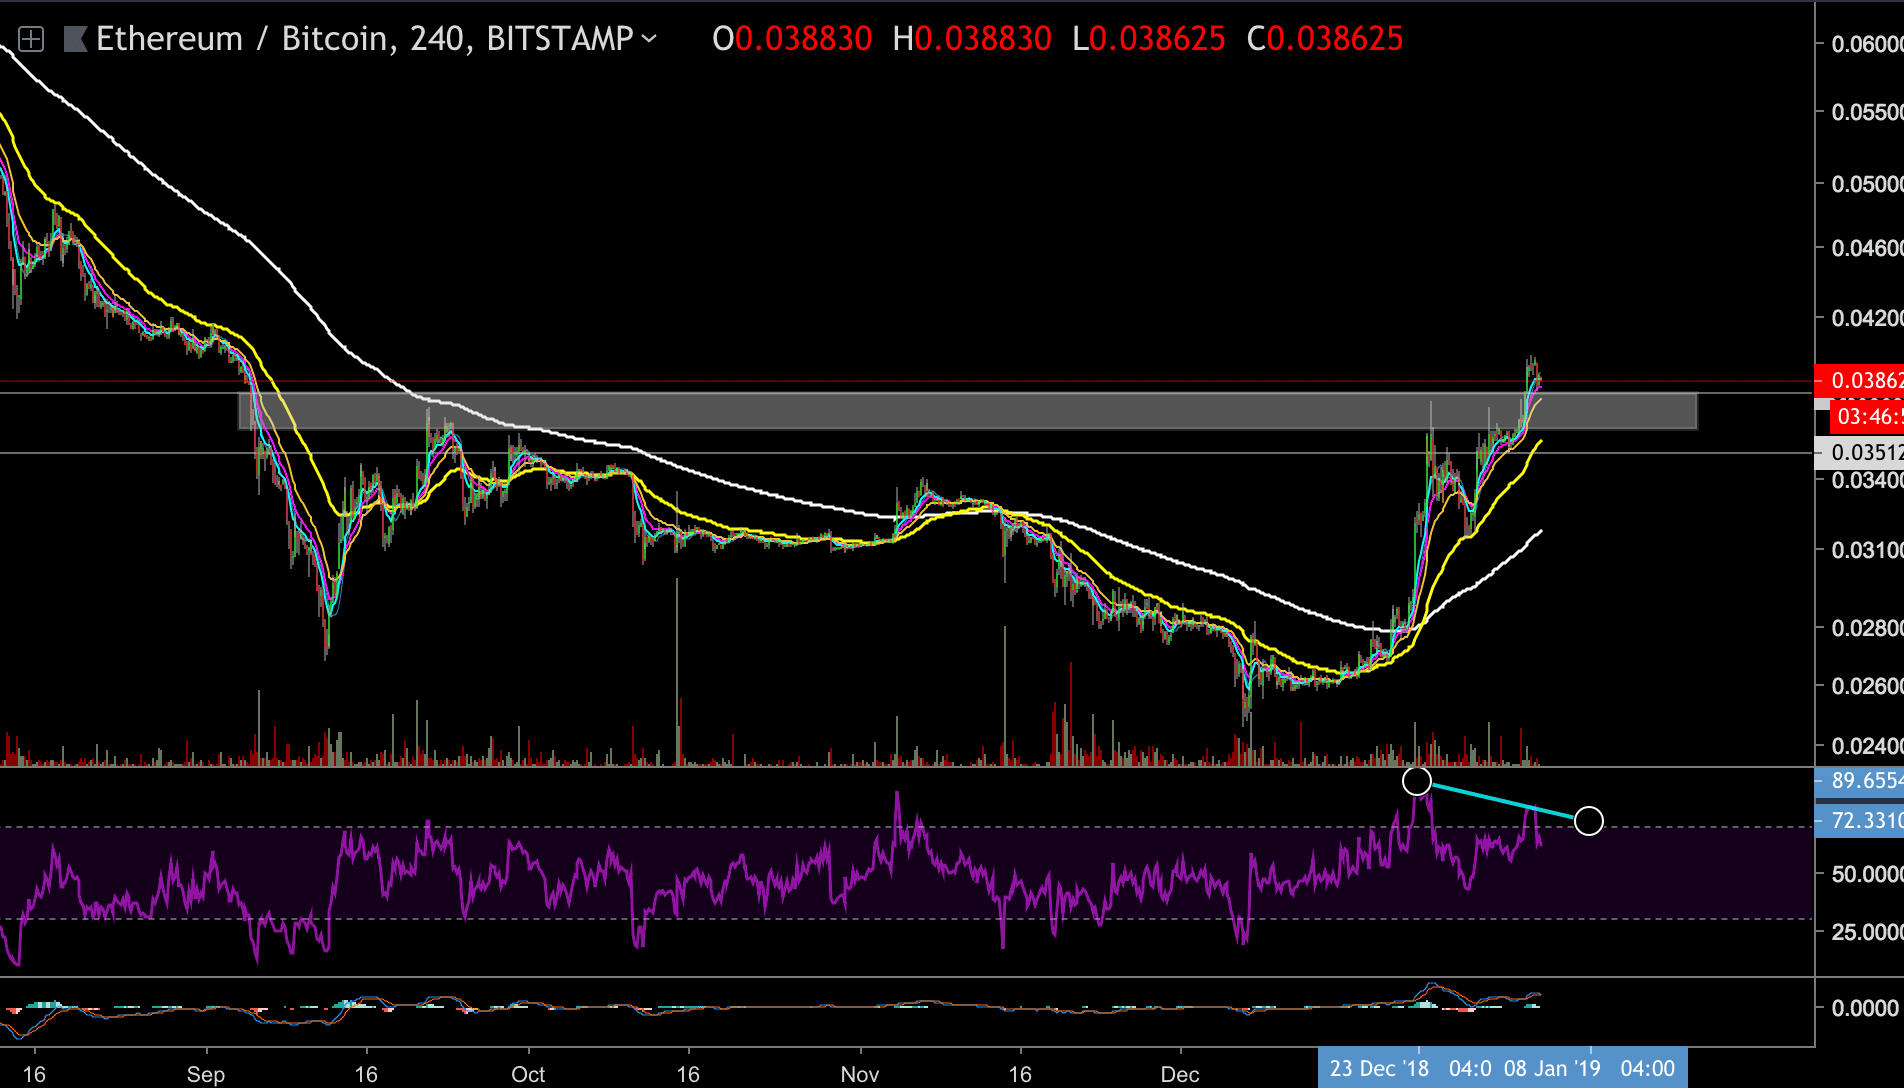
Looking at the 4-hour ETH-BTC chart (Bitstamp)
ETH is currently trading above the resistance level (marked on the attached chart) which was turned into a support level. However, we can notice negative diversions on the RSI indicator which could turn into a bearish signal.
The post Ethereum Price Analysis Jan.3: What’s Next For ETH Following a 30% Gain In 7 Days? appeared first on CryptoPotato.