Ethereum Price Analysis Jan.28: ETH Is Facing The $100 Support (Again)
Since our last post, BTC hasn’t breached above the $3,500-$3,600 price level. And on the 3rd attempt, BTC just broke down and declined towards the $3,400 support level where it is currently trading.
This move was followed by the big Alts and caused ETH to lose 10% of its value.
The descending triangle formation that we discussed in our last analysis broke to the downside, and as we expected, ETH revisited the $100 mental support level.
At the moment, ETH is getting supported by the $100 price level, but if the BTC price keeps on falling, then the ETH chart is most likely to act the same.
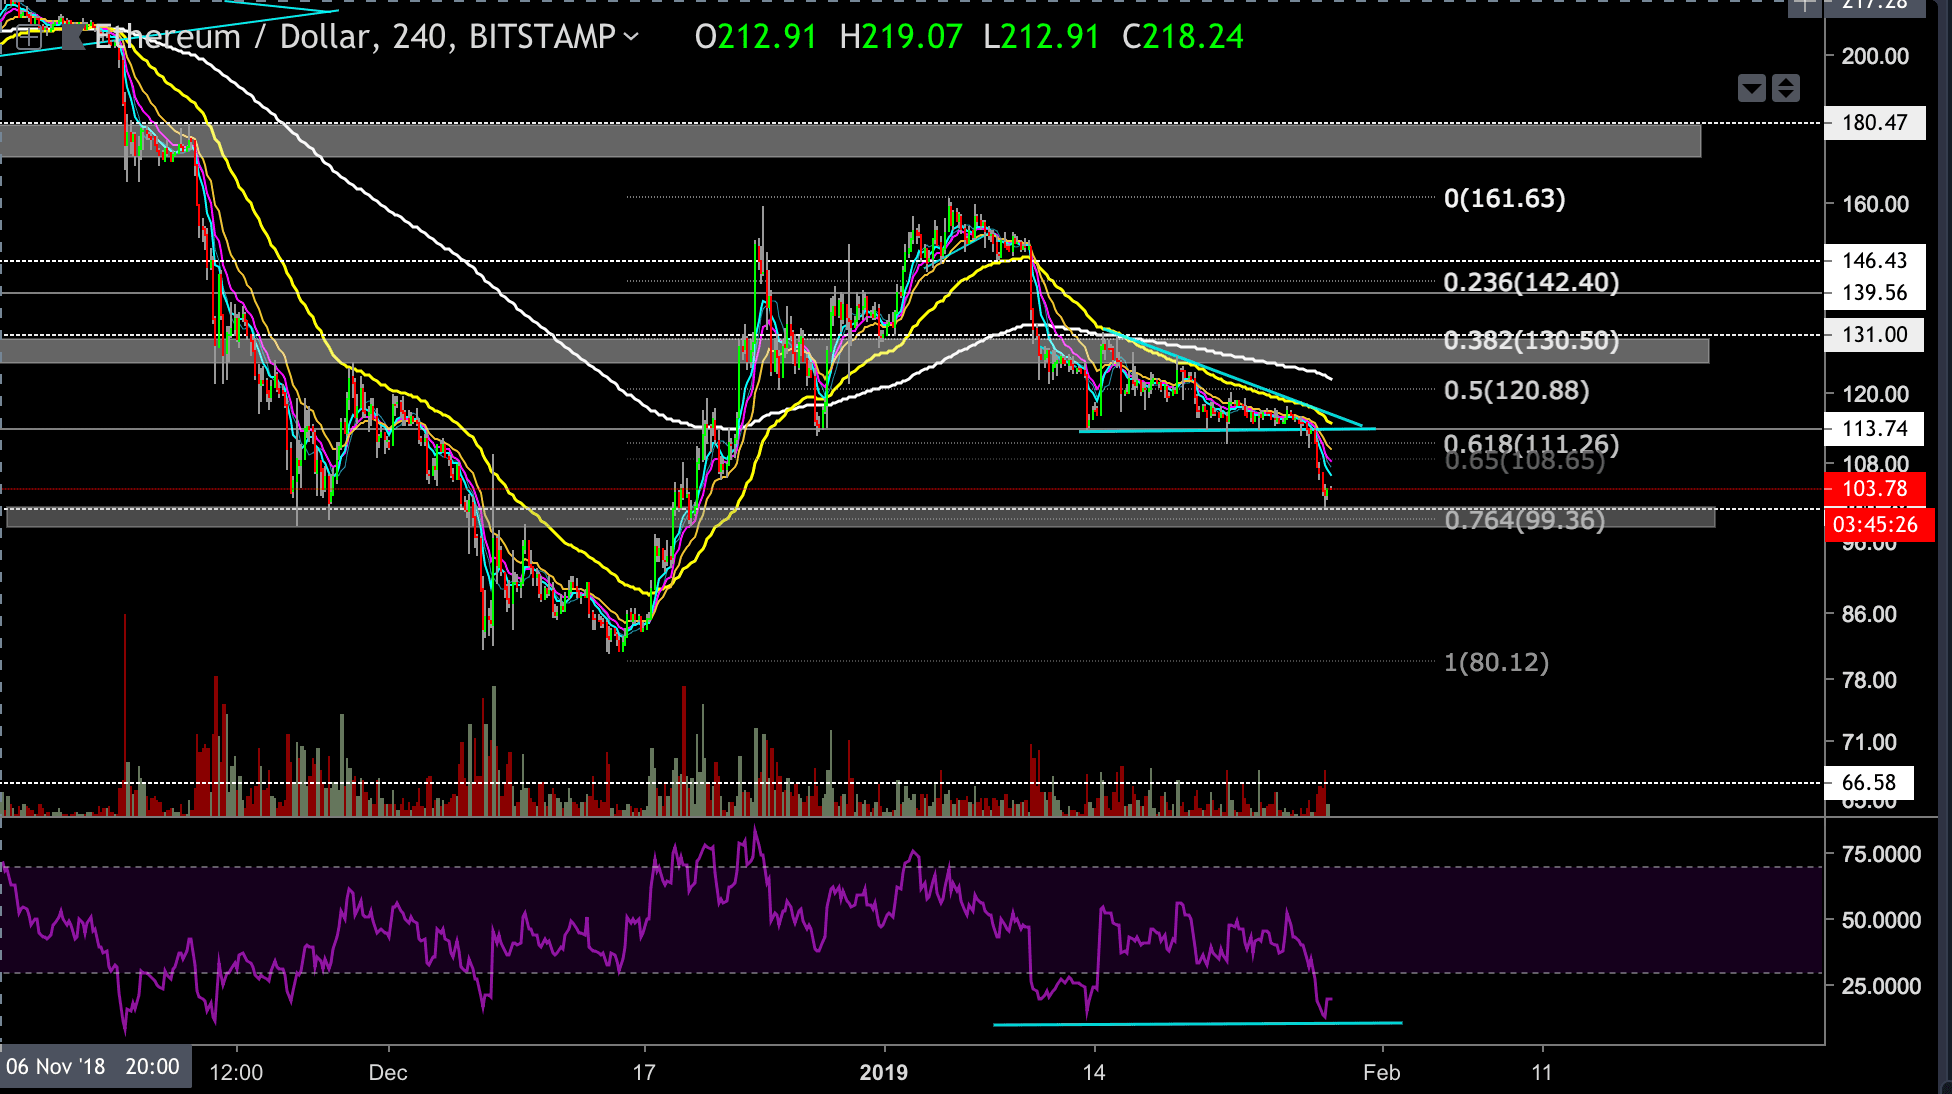
Looking at the 4-hour ETH-USD chart
- The current $100 support level has a good chance of holding the first break attempt. It is an important support level, which usually doesn’t get broken on the first attempt. If it does hold, then there is a good chance for a bounce toward the $110-$113 price level.
- If ETH gets a stronger bounce from this support level, then it might even rally toward the $124 price level, but at the moment there is not enough volume to support such a move.
- You should note that the $100 support level is also the 0.764 retracement level. In the case where this support level doesn’t hold against the bears, the ETH price is very likely to test the $90 area and even lower to the $80-$85 price level, which is the last significant support level.
- The RSI indicator is at the 19 level, which is extremely oversold. A fact that might support the positive temporary bounce scenario.
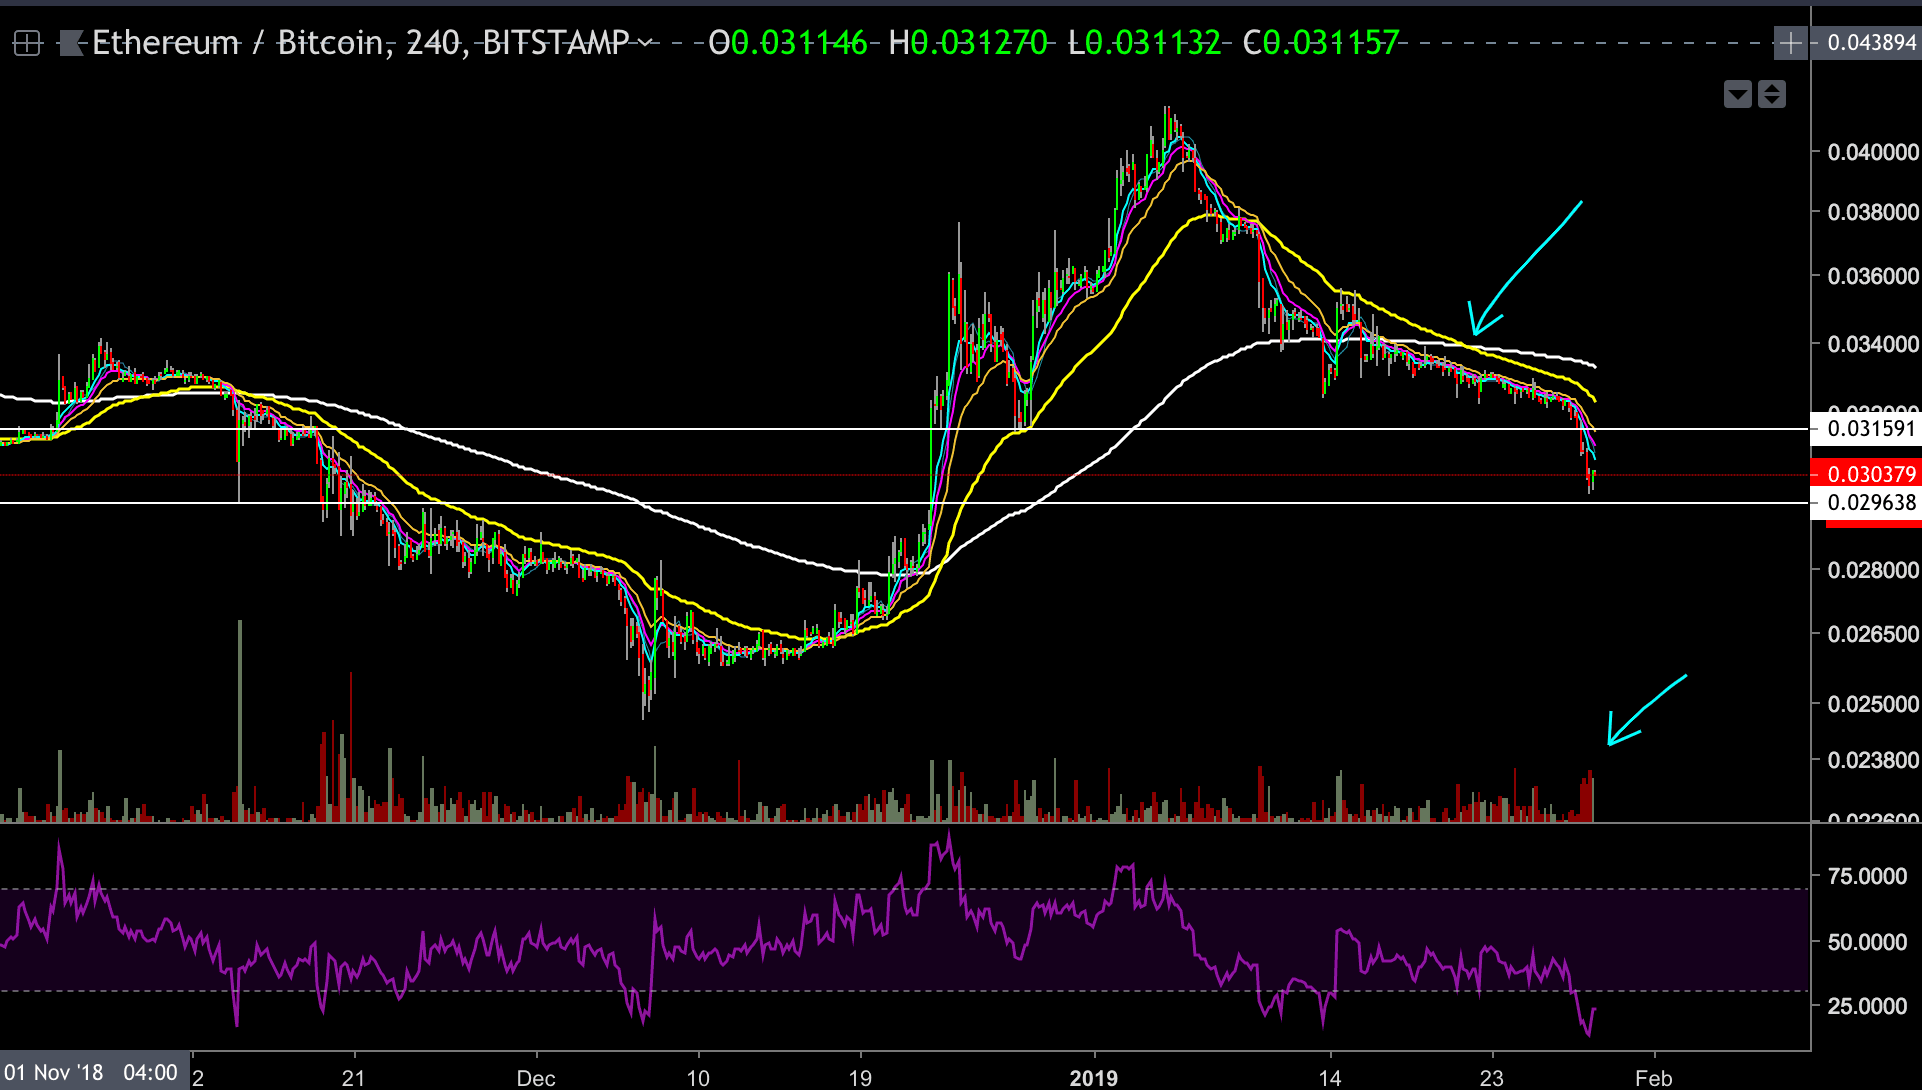
Looking at the 4-hour ETH-BTC chart
- In our last analysis, we discussed the “death cross” that took place on the ETHBTC chart (55EMA moves below the 200 EMA, yellow below white on the attached chart) as you can see this bearish signal worked well and ETH broke down toward the 0.0299TBC support level.
- You can also note the red growing volume candles on the attached chart.
- The next support level at the 0.0296BTC could hold for the first break attempt, but at the moment the ETH pair with BTC looks very weak
The post Ethereum Price Analysis Jan.28: ETH Is Facing The $100 Support (Again) appeared first on CryptoPotato.