Ethereum Price Analysis Jan.22: ETH Struggles To Stay Above $100 Following a Death Cross
Over the past two days, BTC has been going sideways. This consolidation came up following a very bearish hourly candle that dropped BTC from $3690 to $3470 (Bitstamp).
It is unclear at the moment if this consolidation will turn into a bear flag formation (more bearish action to come) or a “drop base rally” formation (inverted Bart pattern) which will typically lead to a bounce back upward.
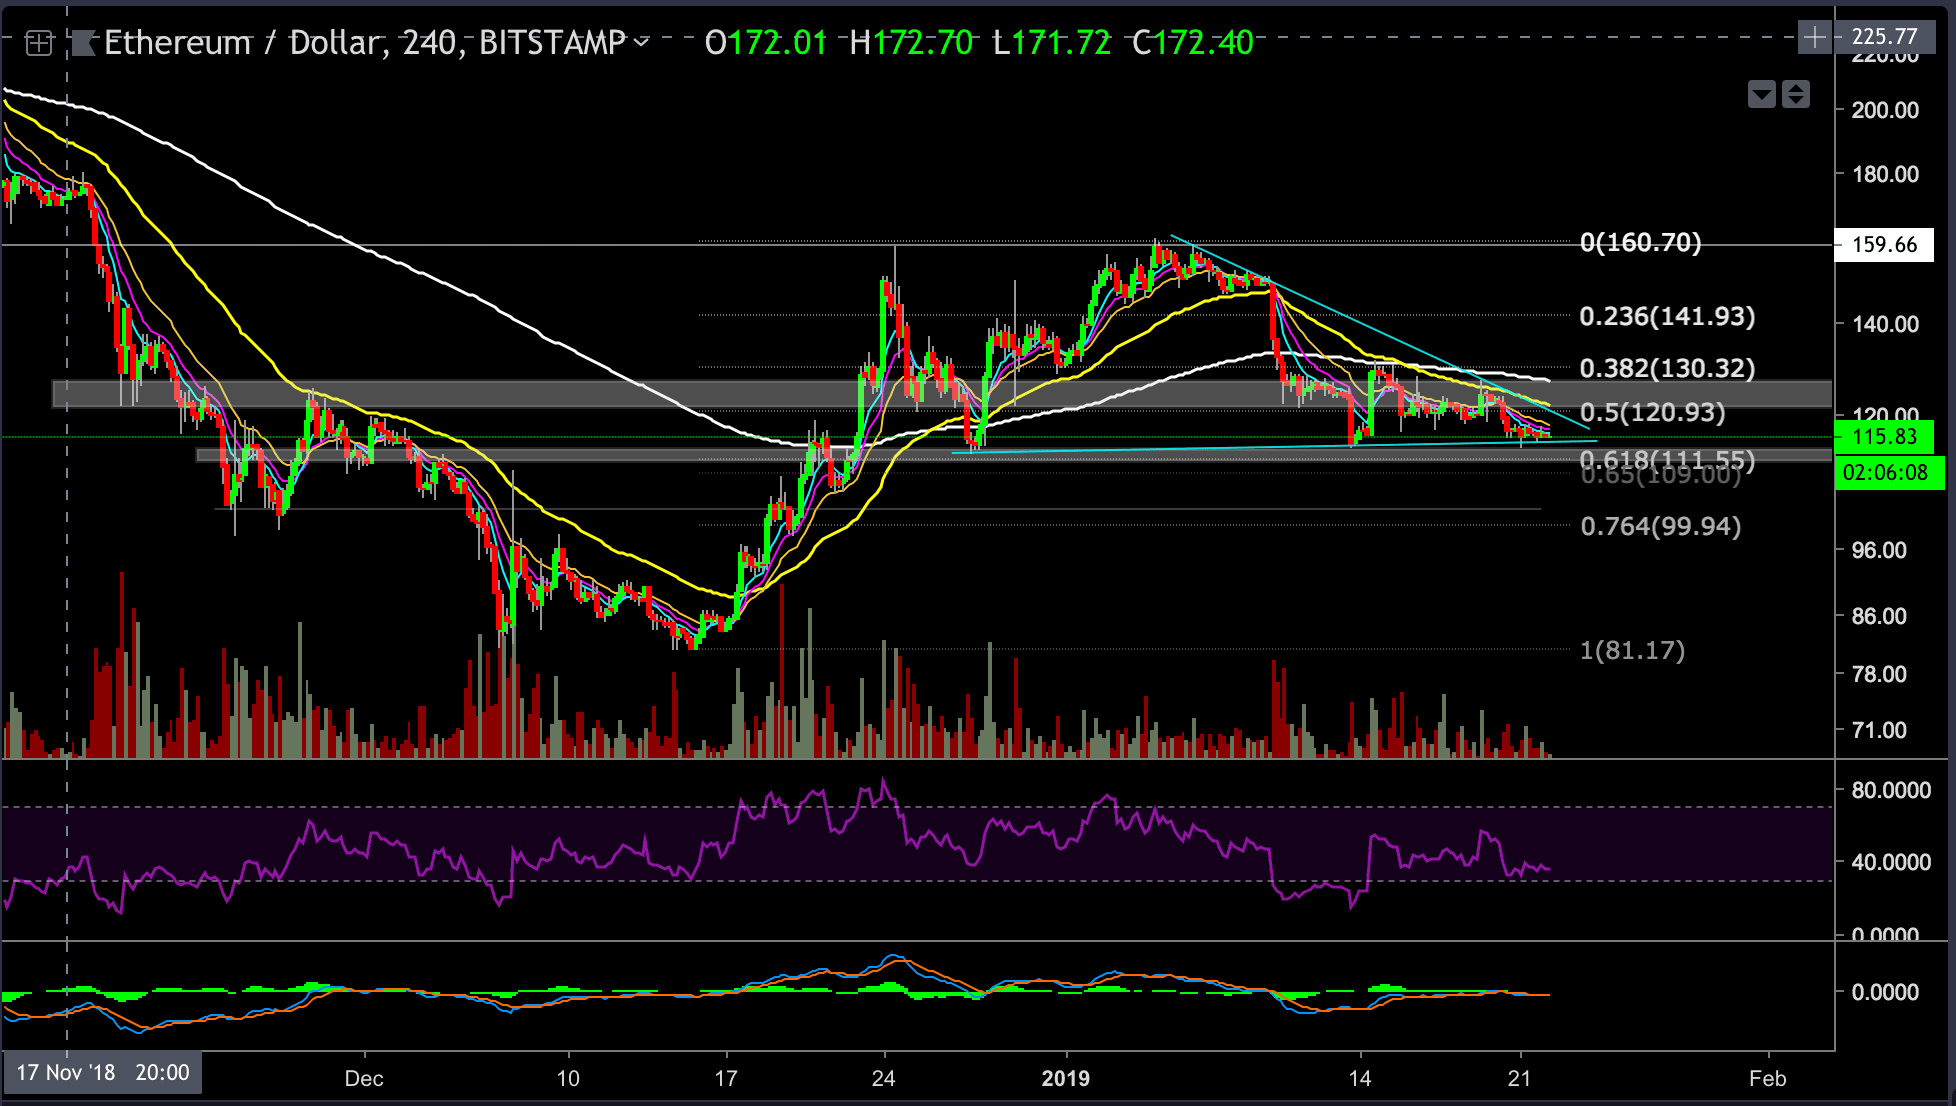
ETH, at the same time, retested the last support level of $113.6 and is currently ‘locked up’ in a channel. The range of $111 – $113 serves as a support level and $121 – $126 as a resistance level.
Looking at the 4-hour ETH-USD chart
- At the moment of writing this post, ETH is trading at the $116 price level, and very likely to test the mentioned support level of $111 – $113 one more time shortly.
- A break below the support level might lead to a bearish continuation toward the next support range of $100 – $105.
- There is a clear bearish triangle visible on the ETH chart; if this formation plays out, it has a target at around the $100 price level area (which is the next support level).
- In the case of a positive bounce, ETH might try to test the channel resistance level at $121-$126. A break above that resistance could send ETH for the next target, at the $130 support turned resistance level.
- ETH is still trading around the 0.5 – 0.618 Fibonacci retracement level (calculated form the last rally’s peak), while the Bulls wish to see a stronger reaction at this critical support level. The lack of these signs of strength might be a red flag for the Bulls.
- Notice that ETH is trading below all EMA’s.

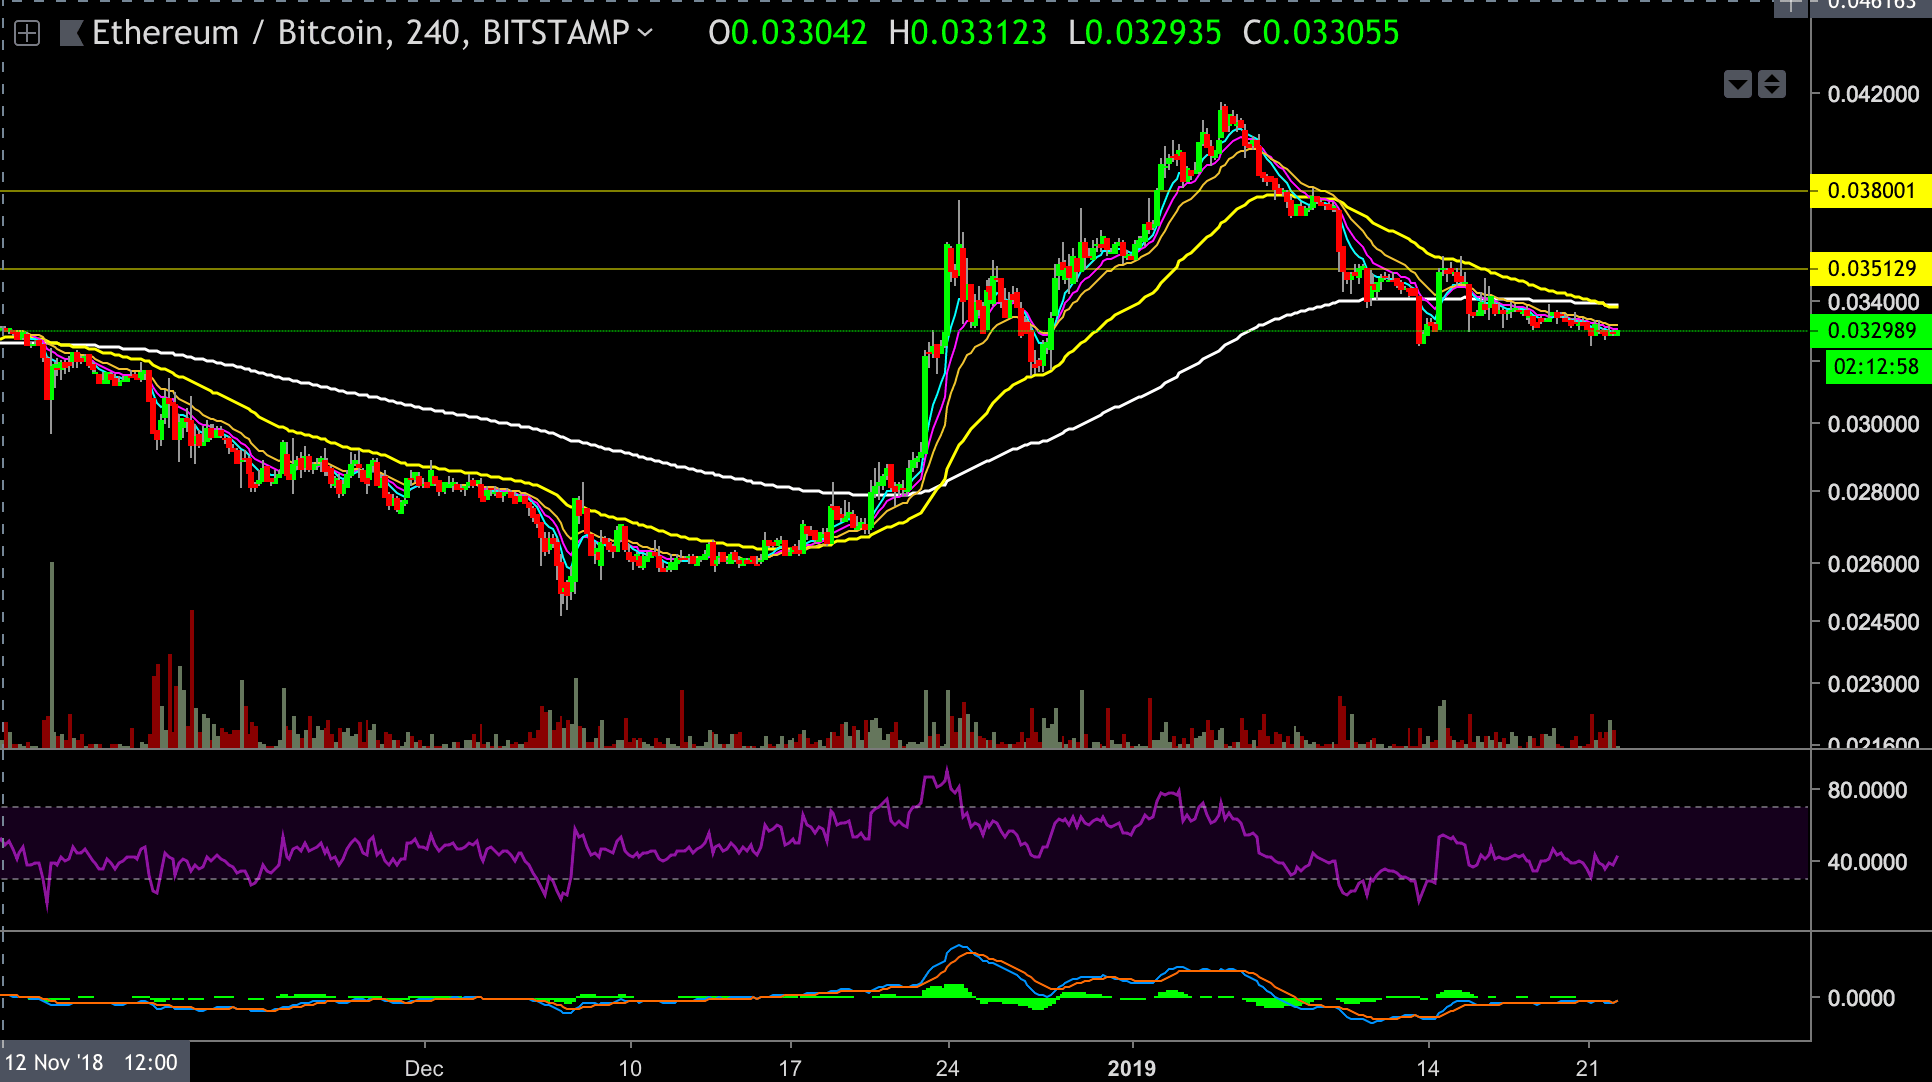
Looking at the 4-hour ETH-BTC chart
- The 55 EMA (marked by a yellow line) is crossing below the 200 EMA (marked by a white line). This cross is known as a Death Cross, and might become a very bearish signal, with that said, the 55 EMA could still bounce back above as a fake cross.
- The RSI indicator found support at the 30 area, above the oversold territories.

The post Ethereum Price Analysis Jan.22: ETH Struggles To Stay Above $100 Following a Death Cross appeared first on CryptoPotato.


