Ethereum Price Analysis: Is ETH on its Way to $2.5K or Danger Still Looms?
Ethereum’s recent price action shows signs of a short-term recovery after hitting the critical support level of $2.1K.
However, despite this brief uptick, the broader market remains deeply bearish, with expectations pointing toward a period of consolidation before the next significant move.
Technical Analysis
By Shayan
The Daily Chart
On the daily chart, ETH encountered strong resistance around $2.8K, leading to a rejection and subsequent downward movement. After this sustained decline, the asset found support at the crucial $2.1K level, which is also the previous daily swing low.
Upon reaching this support, bearish momentum faded, and Ethereum experienced a slight rebound, signaling the potential for a short-term recovery. Furthermore, a bullish divergence between price and the RSI suggests an increase in buying interest, which raises the likelihood of a short-term bullish correction.
Given the presence of buying pressure at $2.1K and the divergence, Ethereum is likely to enter a consolidation phase, with the possibility of slight bullish upticks toward the $2.5K resistance level.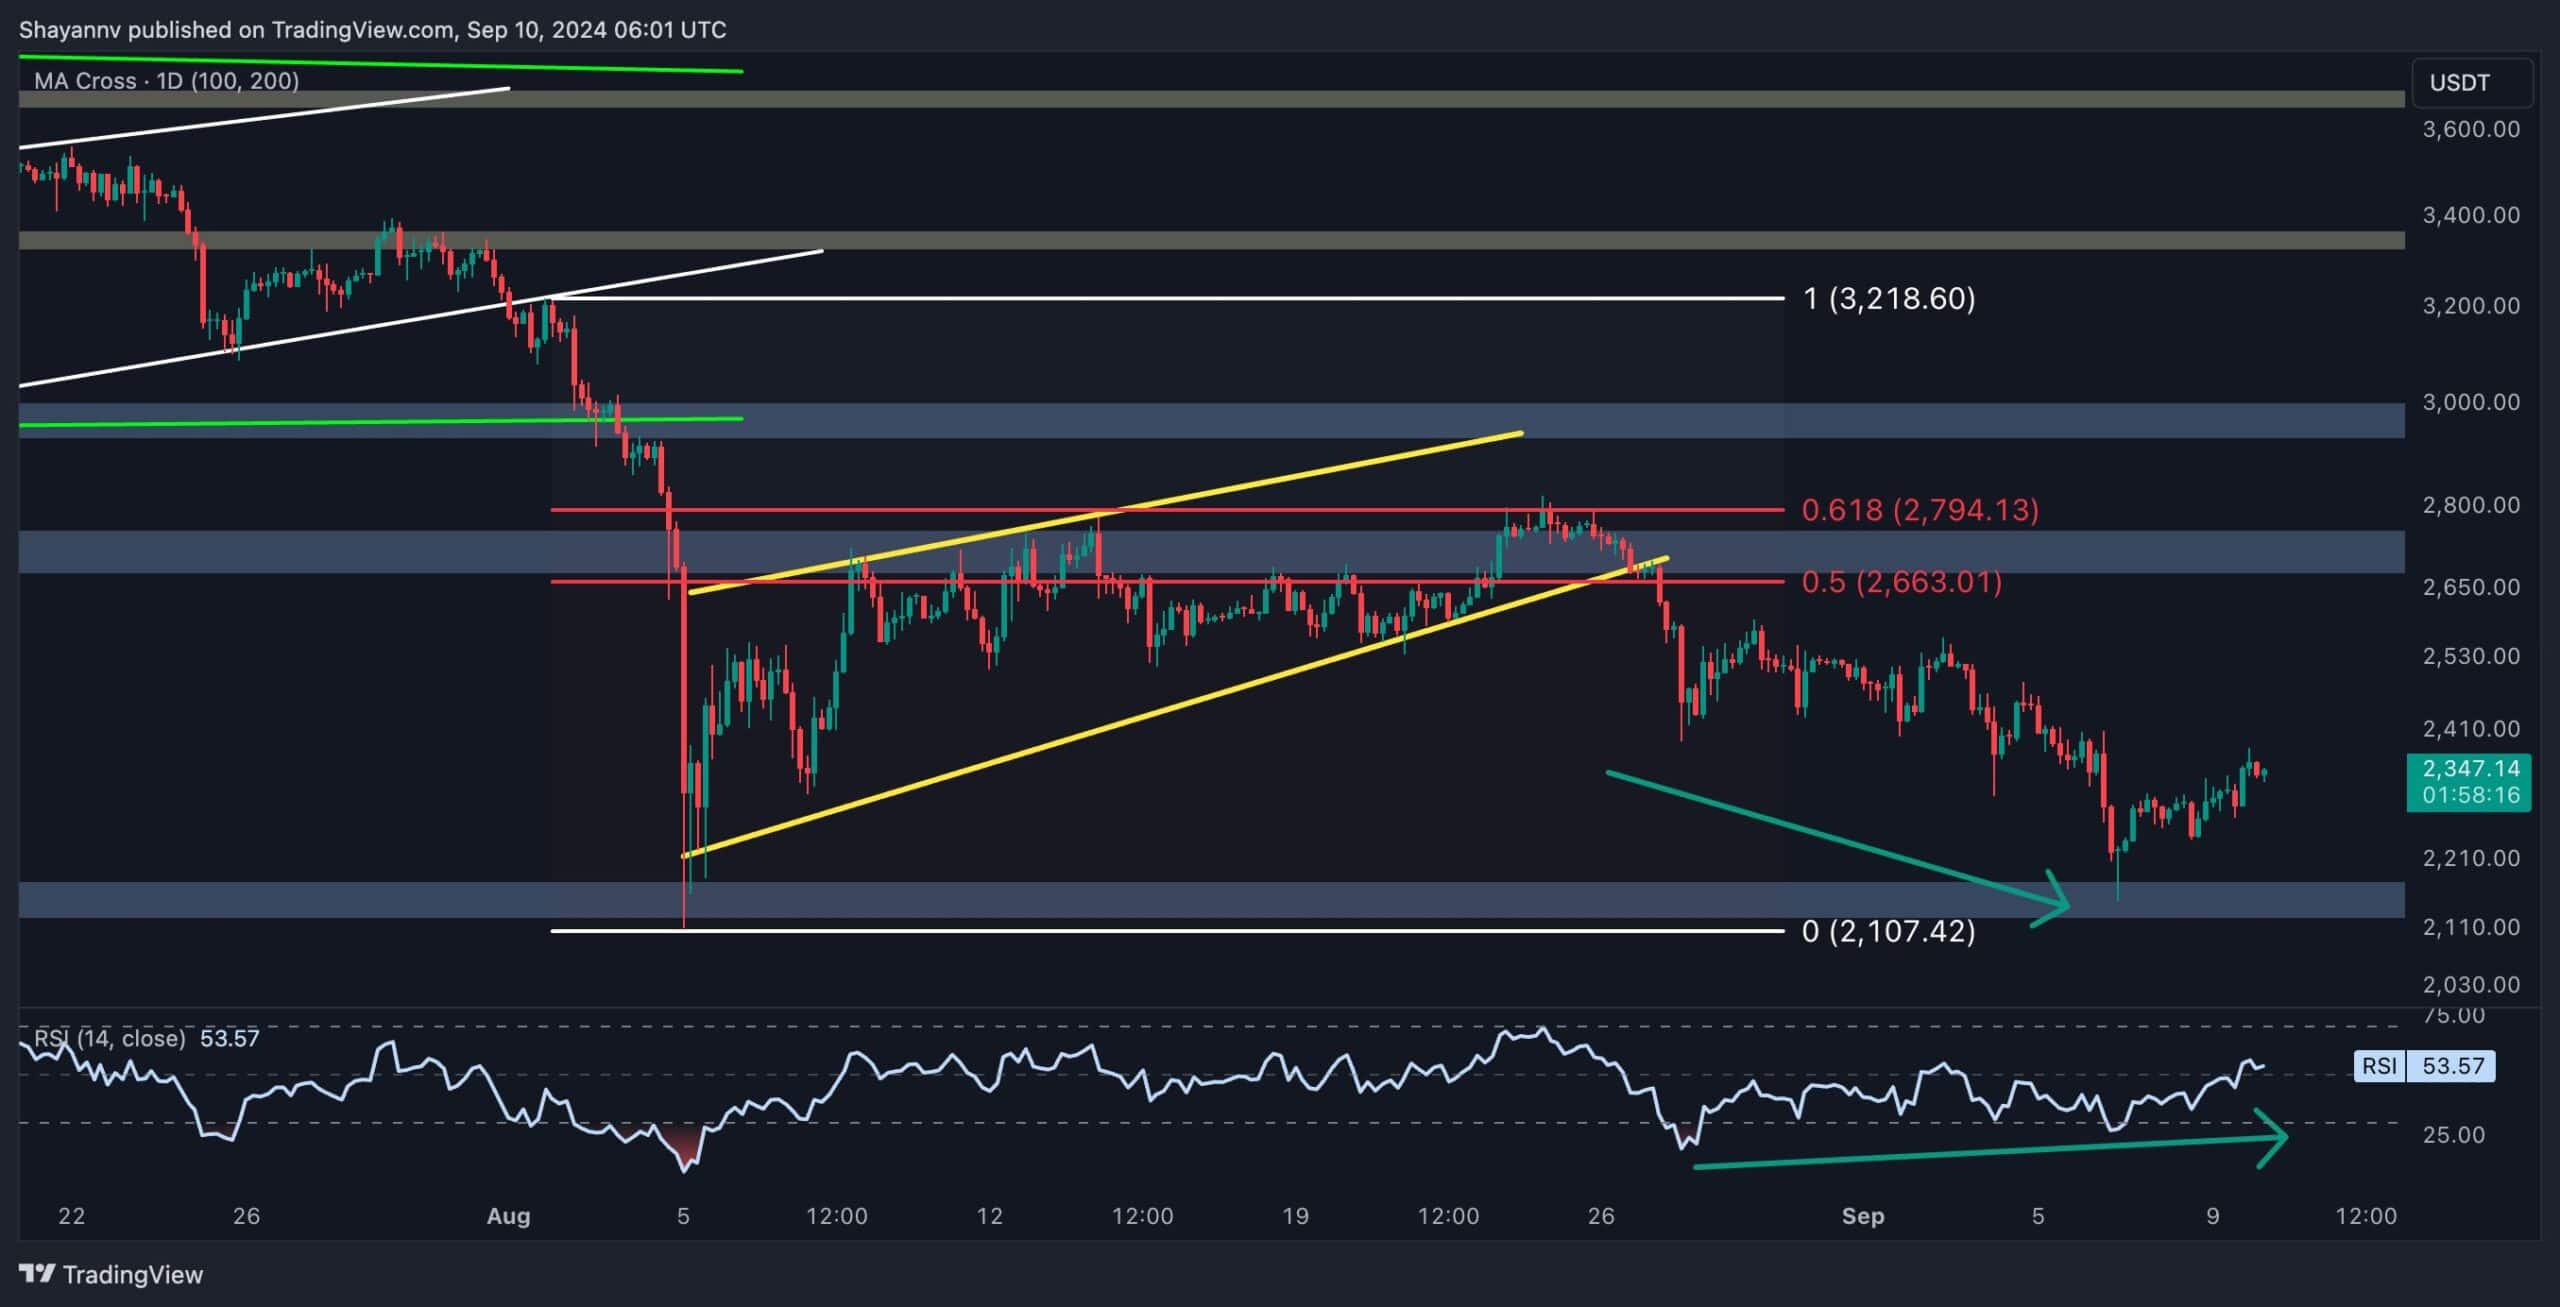
The 4-Hour Chart
On the 4-hour chart, Ethereum faced strong rejection from the resistance zone between the 0.5 ($2.6K) and 0.618 ($2.7K) Fibonacci levels. This rejection, driven by increased selling pressure, pushed the asset to the $2.1K support region. The bullish divergence between the price and RSI is more prominent in this timeframe, further indicating a rise in buying pressure.
Ethereum is undergoing a mild bullish retracement, easing the downward pressure. Continuing this recovery could push the price toward the $2.5K level in the short term. However, if Ethereum breaks below the crucial $2.1K support, it could trigger a sell-off, potentially leading to a further drop toward the $1.8K region.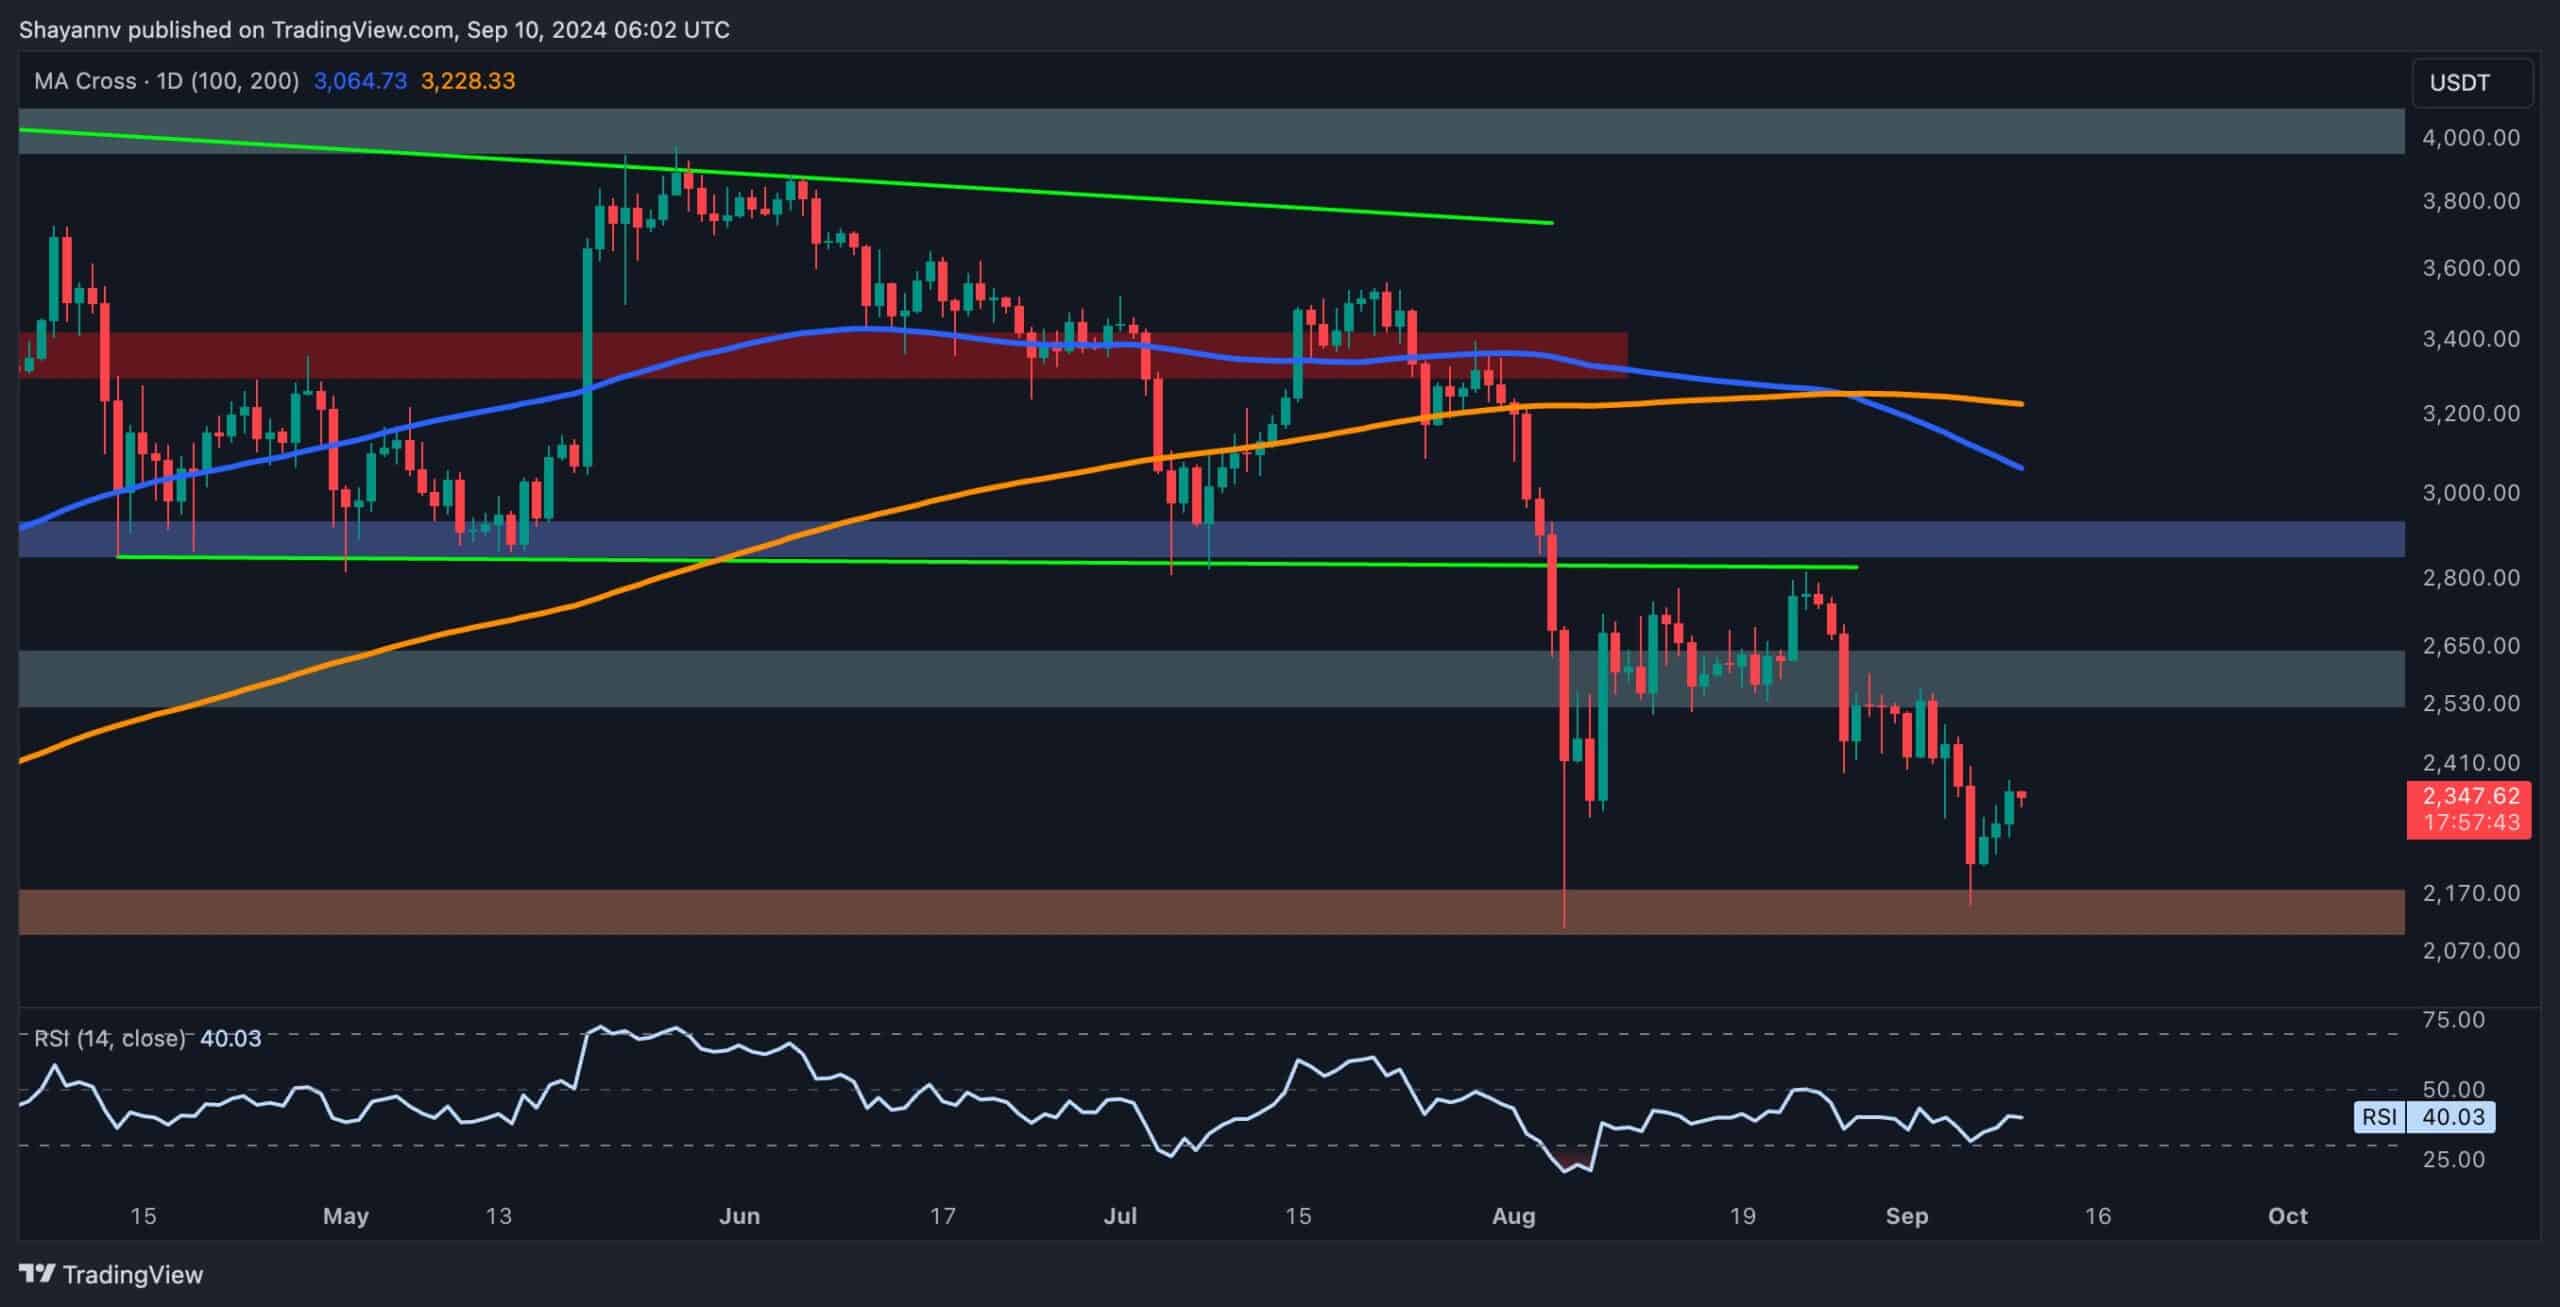
Onchain Analysis
By Shayan
Analyzing the futures market can offer key insights into Ethereum’s price action, especially during downtrends. The ETH/USDT Binance liquidation heatmap visually represents prominent liquidity pools, which often serve as price targets for larger market players or “smart money.”
According to the heatmap, the $2.5K level holds the highest concentration of liquidity near the current price. Liquidity acts like a magnet for price action, so this zone becomes a critical short-term target.
A bullish retracement toward this level is highly probable, driven by the market’s tendency to seek out these liquidity pools. Consequently, the $2.5K price range represents a pivotal area to watch, as its strength could determine the continuation of Ethereum’s current upward movement.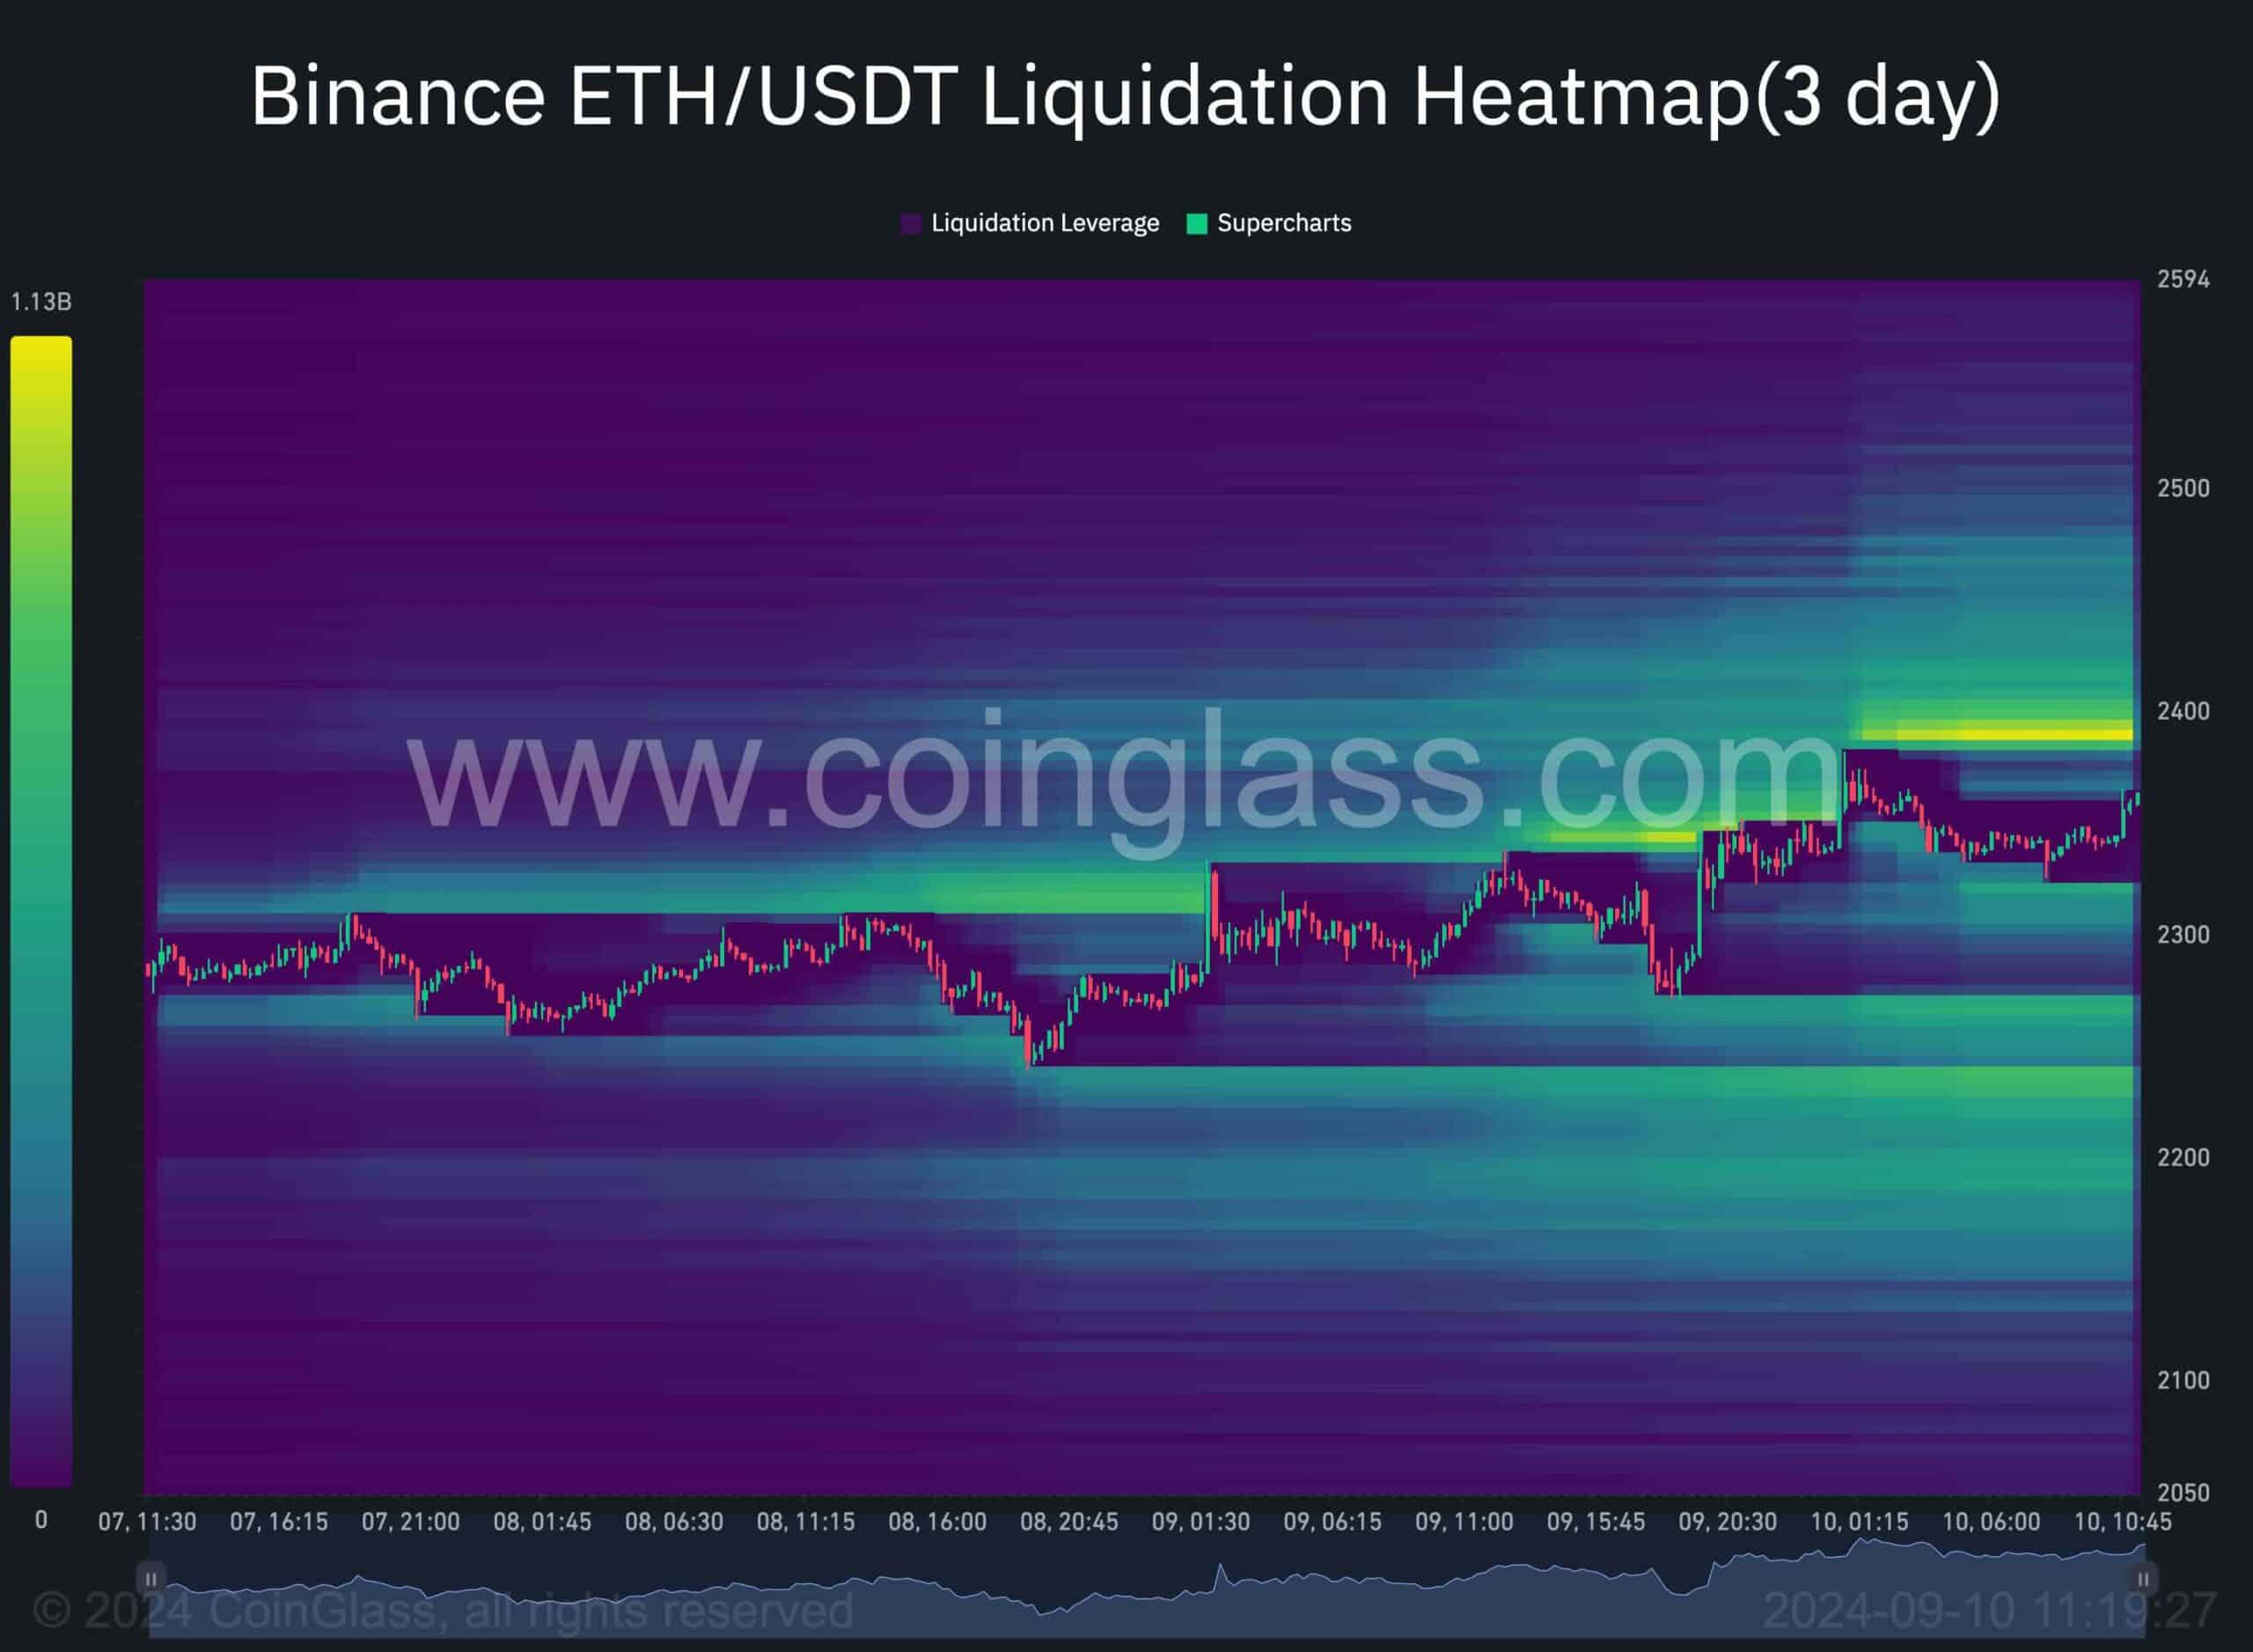
The post Ethereum Price Analysis: Is ETH on its Way to $2.5K or Danger Still Looms? appeared first on CryptoPotato.