Ethereum Price Analysis: Is ETH in Danger of Falling Below $3K Soon?
Ethereum’s price action indicates a temporary consolidation phase following its rejection near the critical $3.5K resistance zone.
A pullback toward $3K (aligned with the 200-day MA) is forming, setting the stage for a potential bullish continuation in the mid-term.
ETH Price Analysis
By Shayan
The Daily Chart
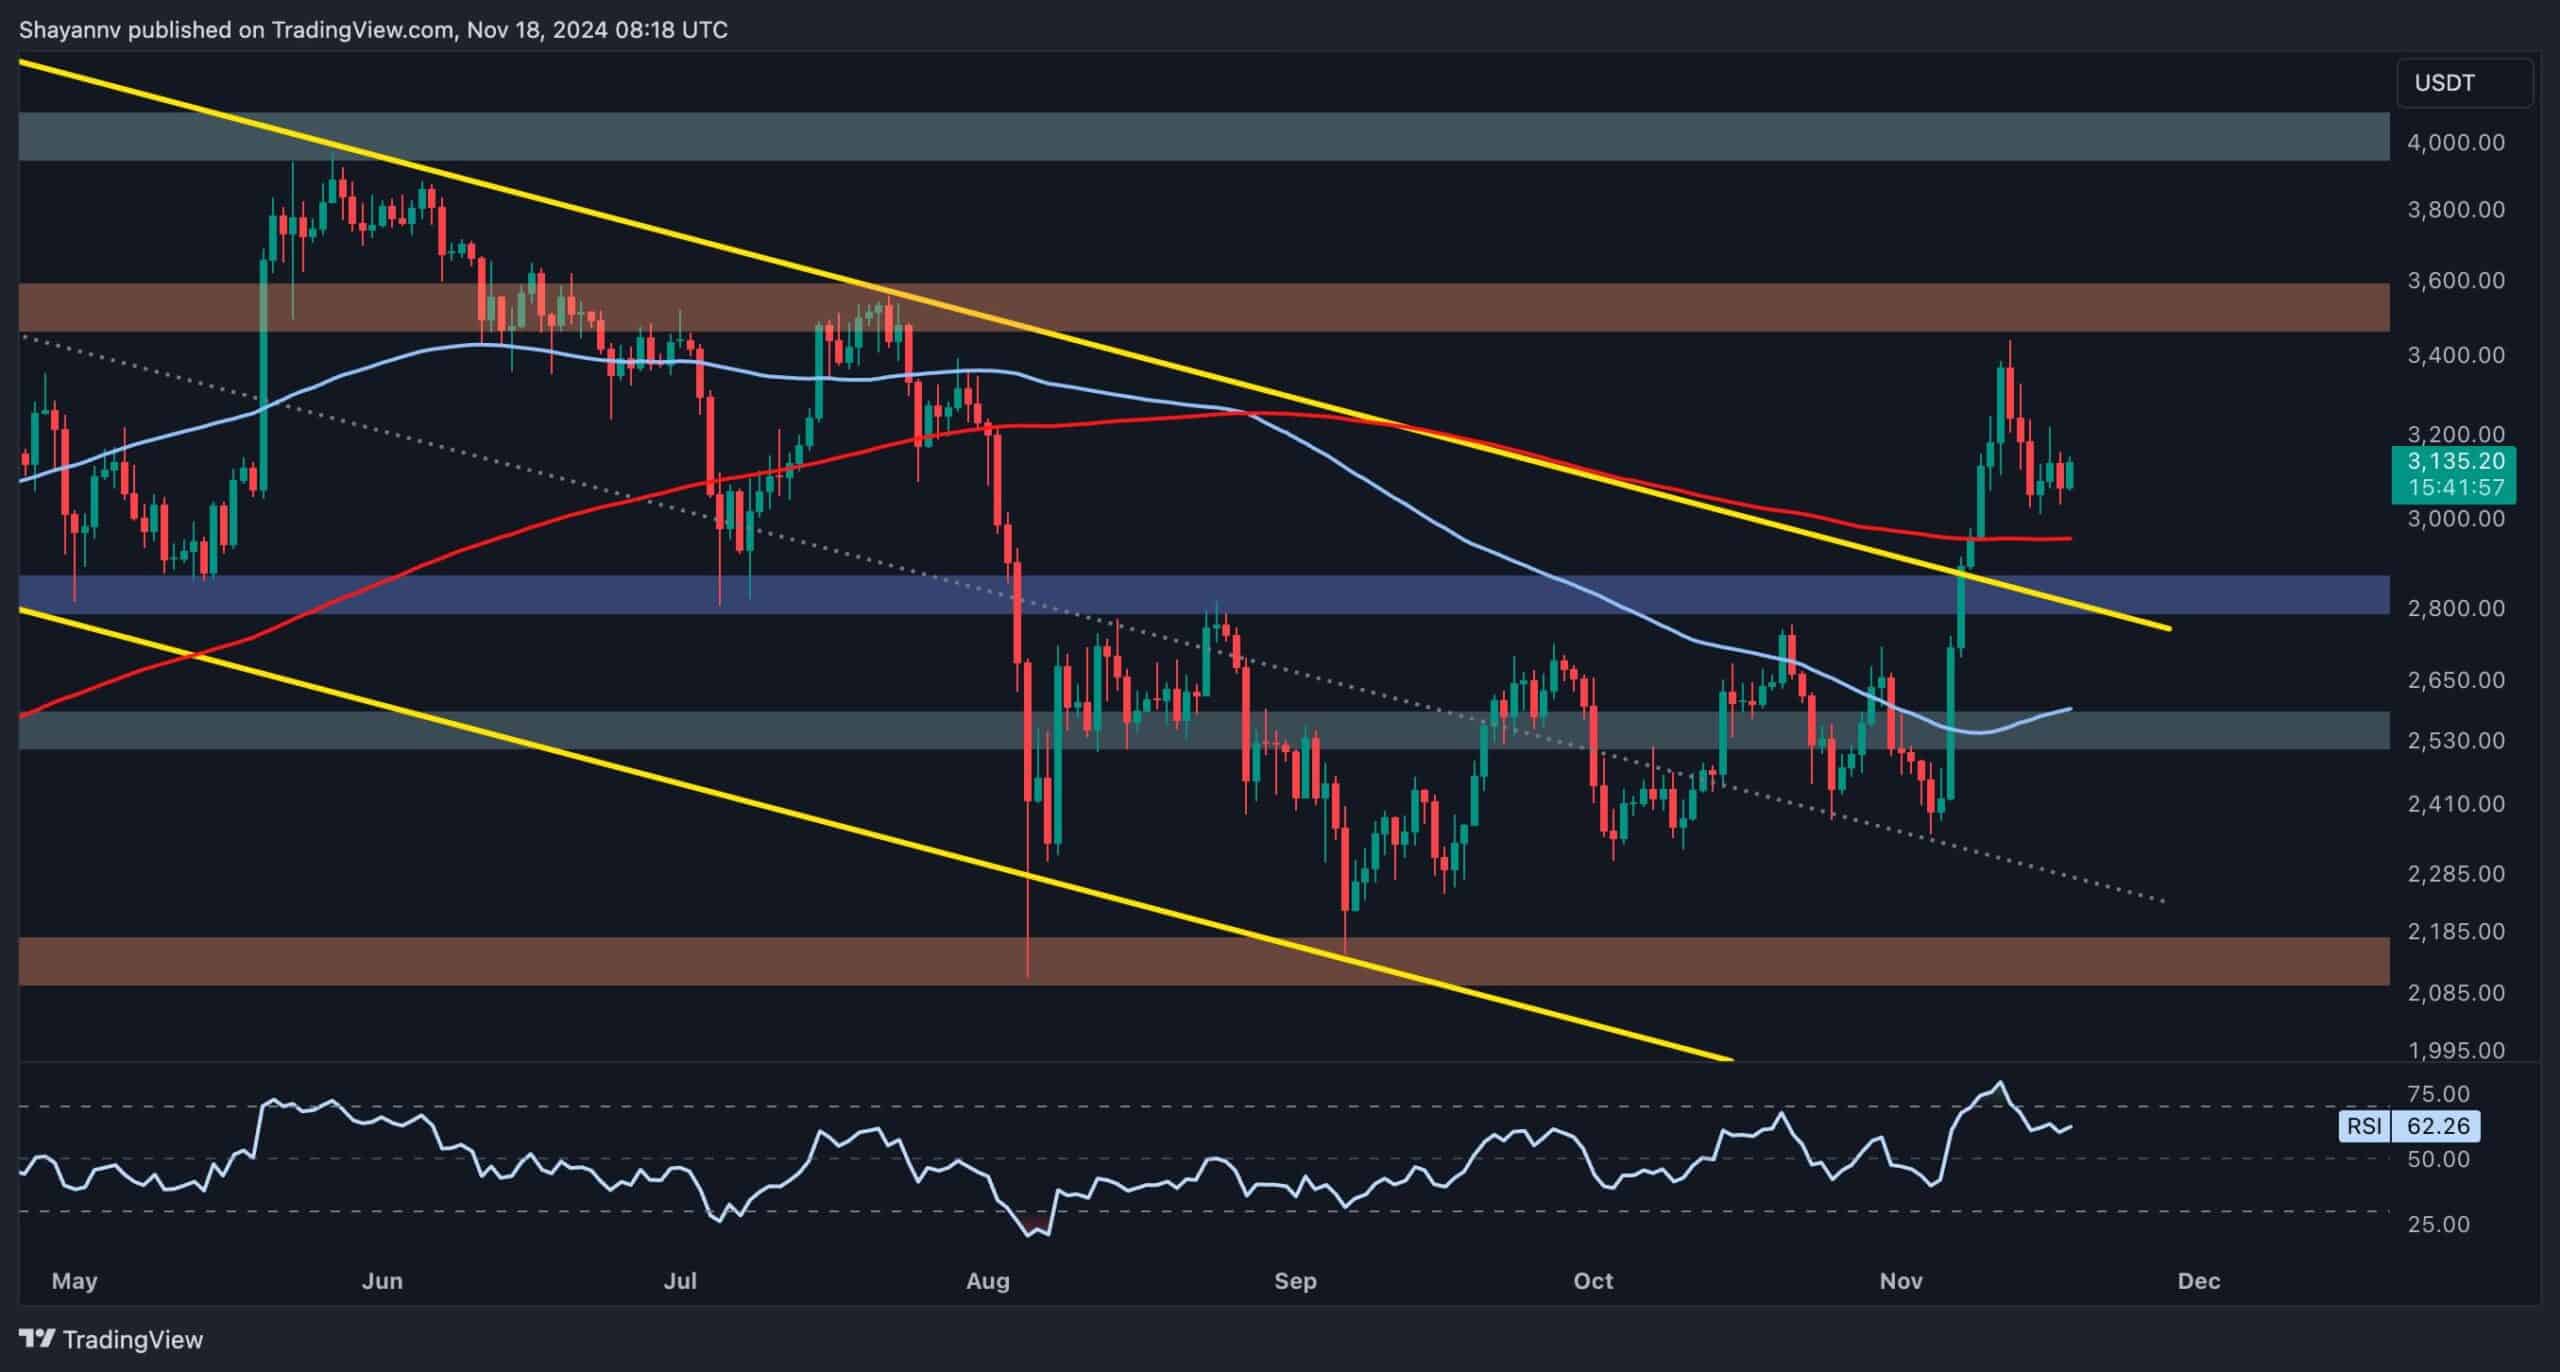
Ethereum recently experienced heightened bullish momentum, climbing above the critical $3K resistance zone, which is now serving as solid support.
Staying above the 100-day and 200-day moving averages further strengthens the bullish outlook. However, the price faced rejection near the $3.5K resistance region, resulting in a corrective pullback toward the 200-day MA of around $3K.
This support area is crucial for Ethereum’s mid-term prospects. A successful pullback completion could pave the way for further price increases, targeting higher resistance levels.
The RSI reading of 62.26 indicates that Ethereum still has room to grow before entering overbought territory. The $3.5K resistance zone aligns with previous highs and supply regions, making it a critical threshold for the continuation of the bullish trend.

The 4-Hour Chart
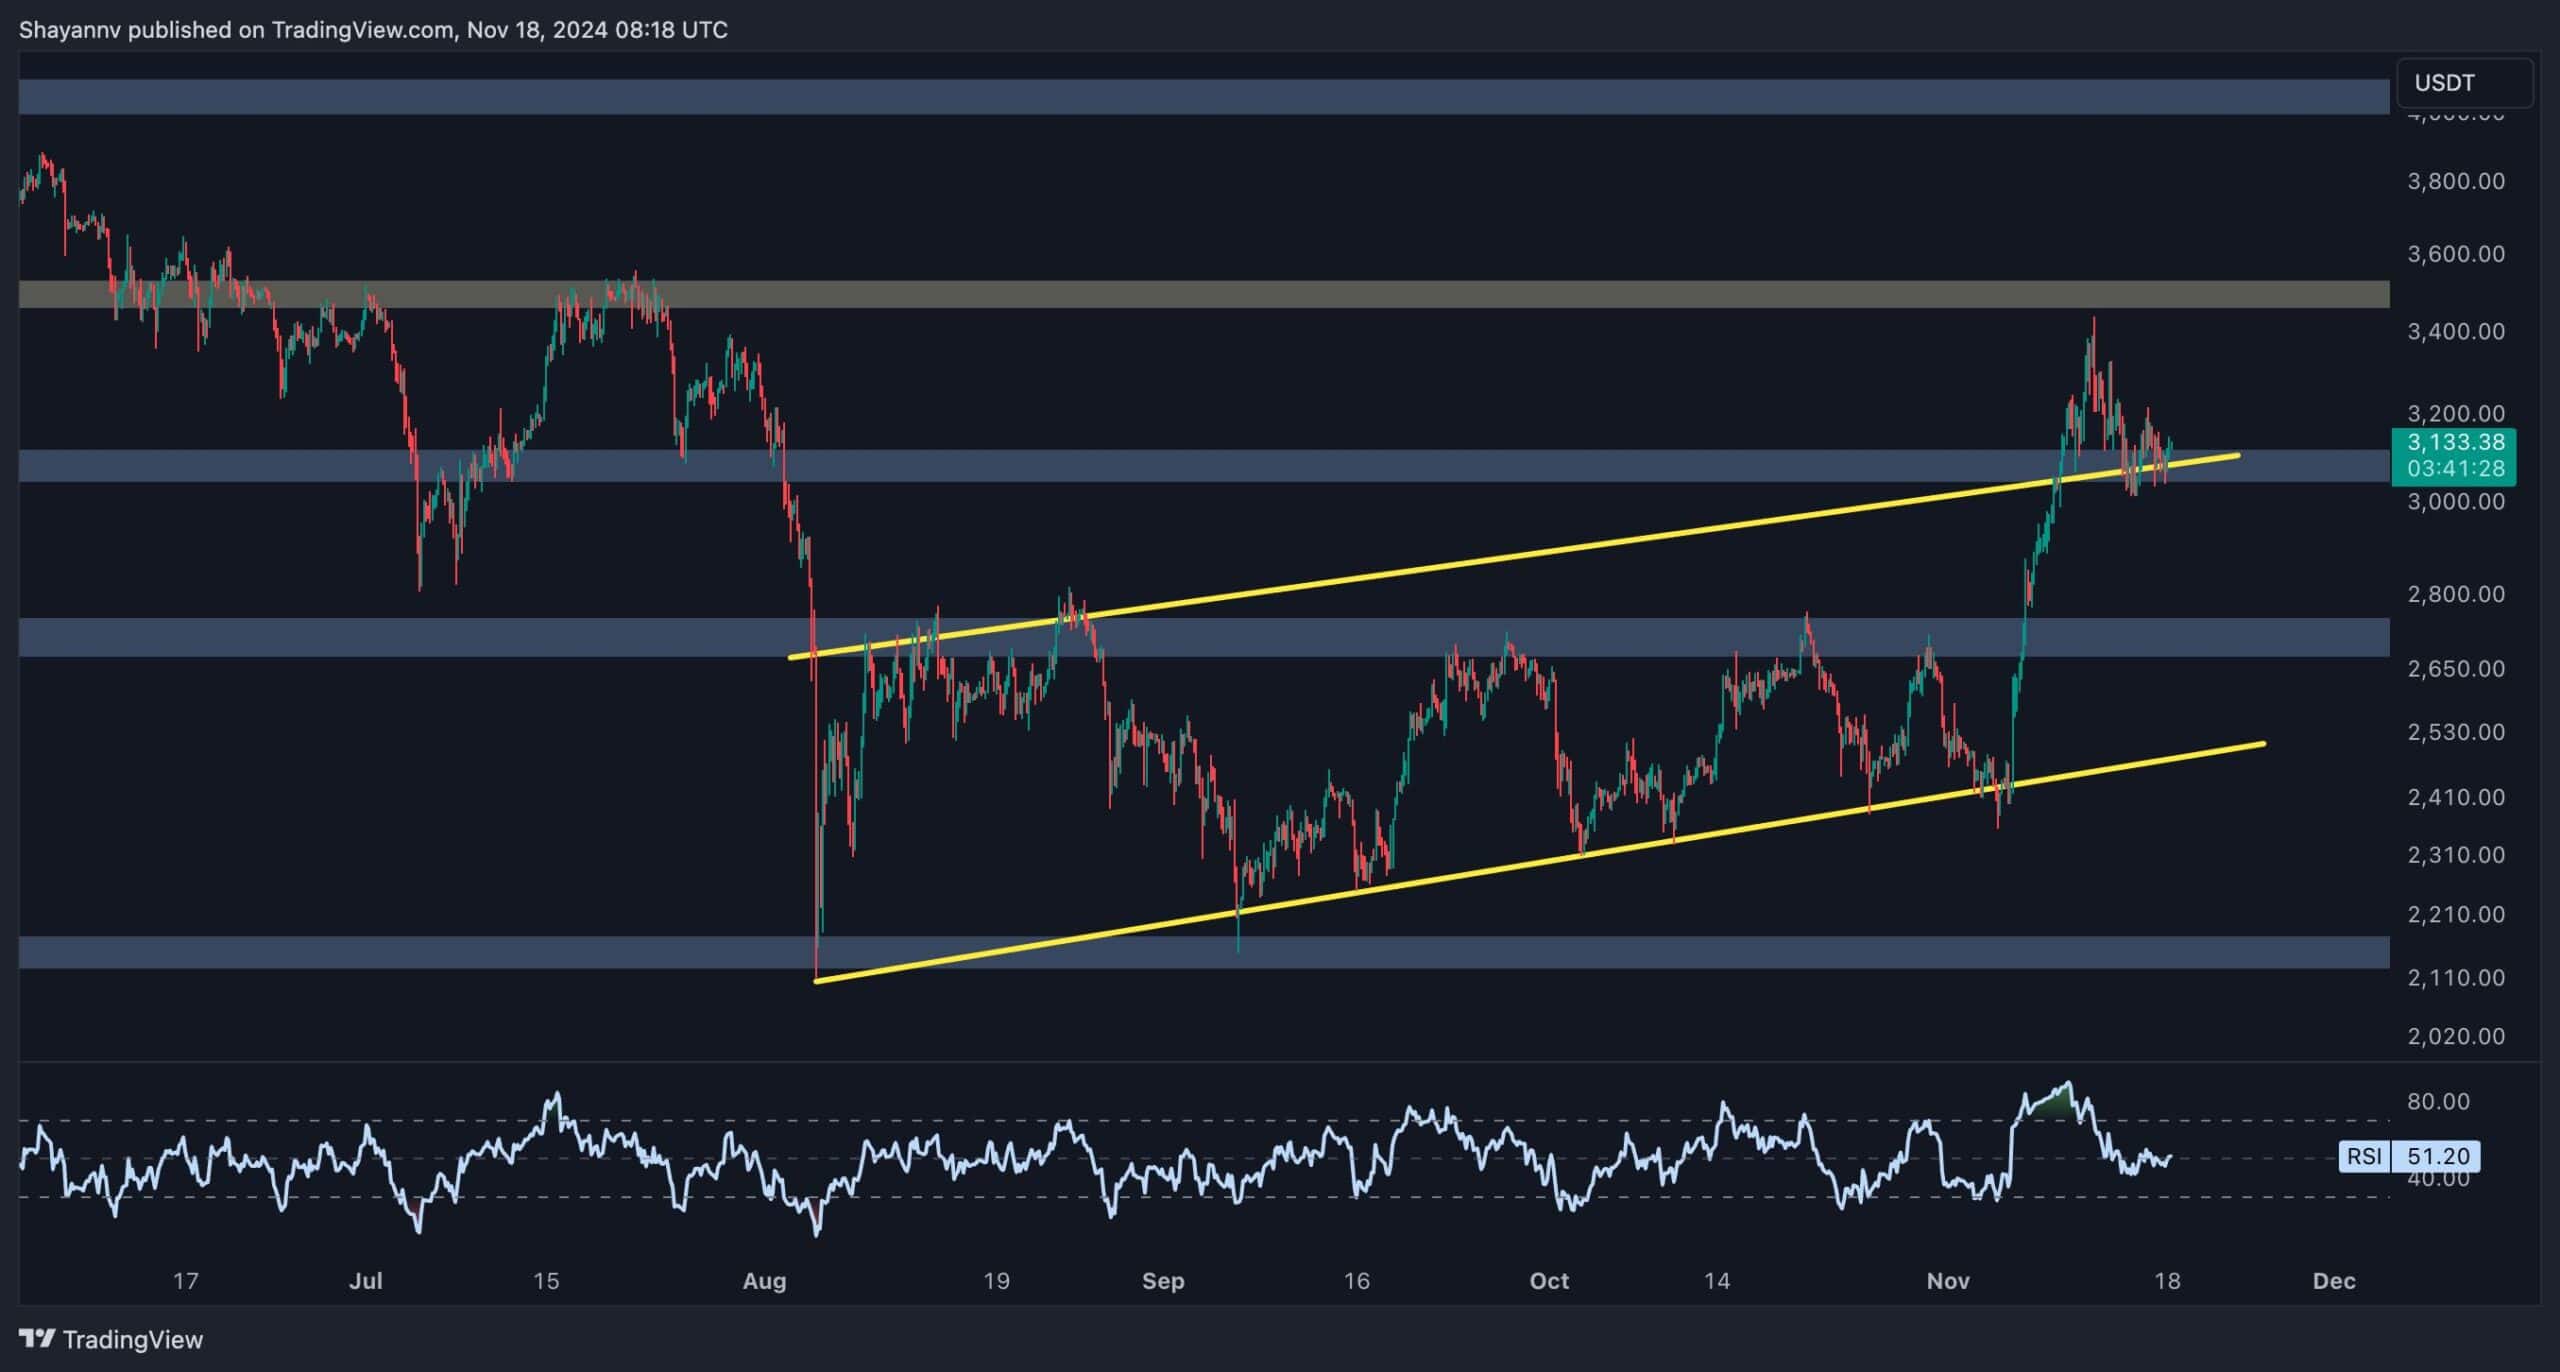
On the 4-hour chart, Ethereum’s bullish momentum remains evident through its series of higher highs and higher lows. Following its impulsive rally, the price was rejected from the $3.5K resistance zone and is now consolidating near the $3K level.
This range aligns with the flag’s broken trendline, suggesting that the current pullback is forming as a healthy correction.
The RSI reading of 51.20 shows neutral momentum, signaling that Ethereum could consolidate further or attempt a new surge toward the $3.5K level.
A breakout above this resistance zone would reinforce bullish sentiment and increase the likelihood of Ethereum reaching new highs. However, a failure to hold the $3K support could indicate short-term weakness, requiring traders to monitor price action closely for further signals.

Onchain Analysis
By Shayan
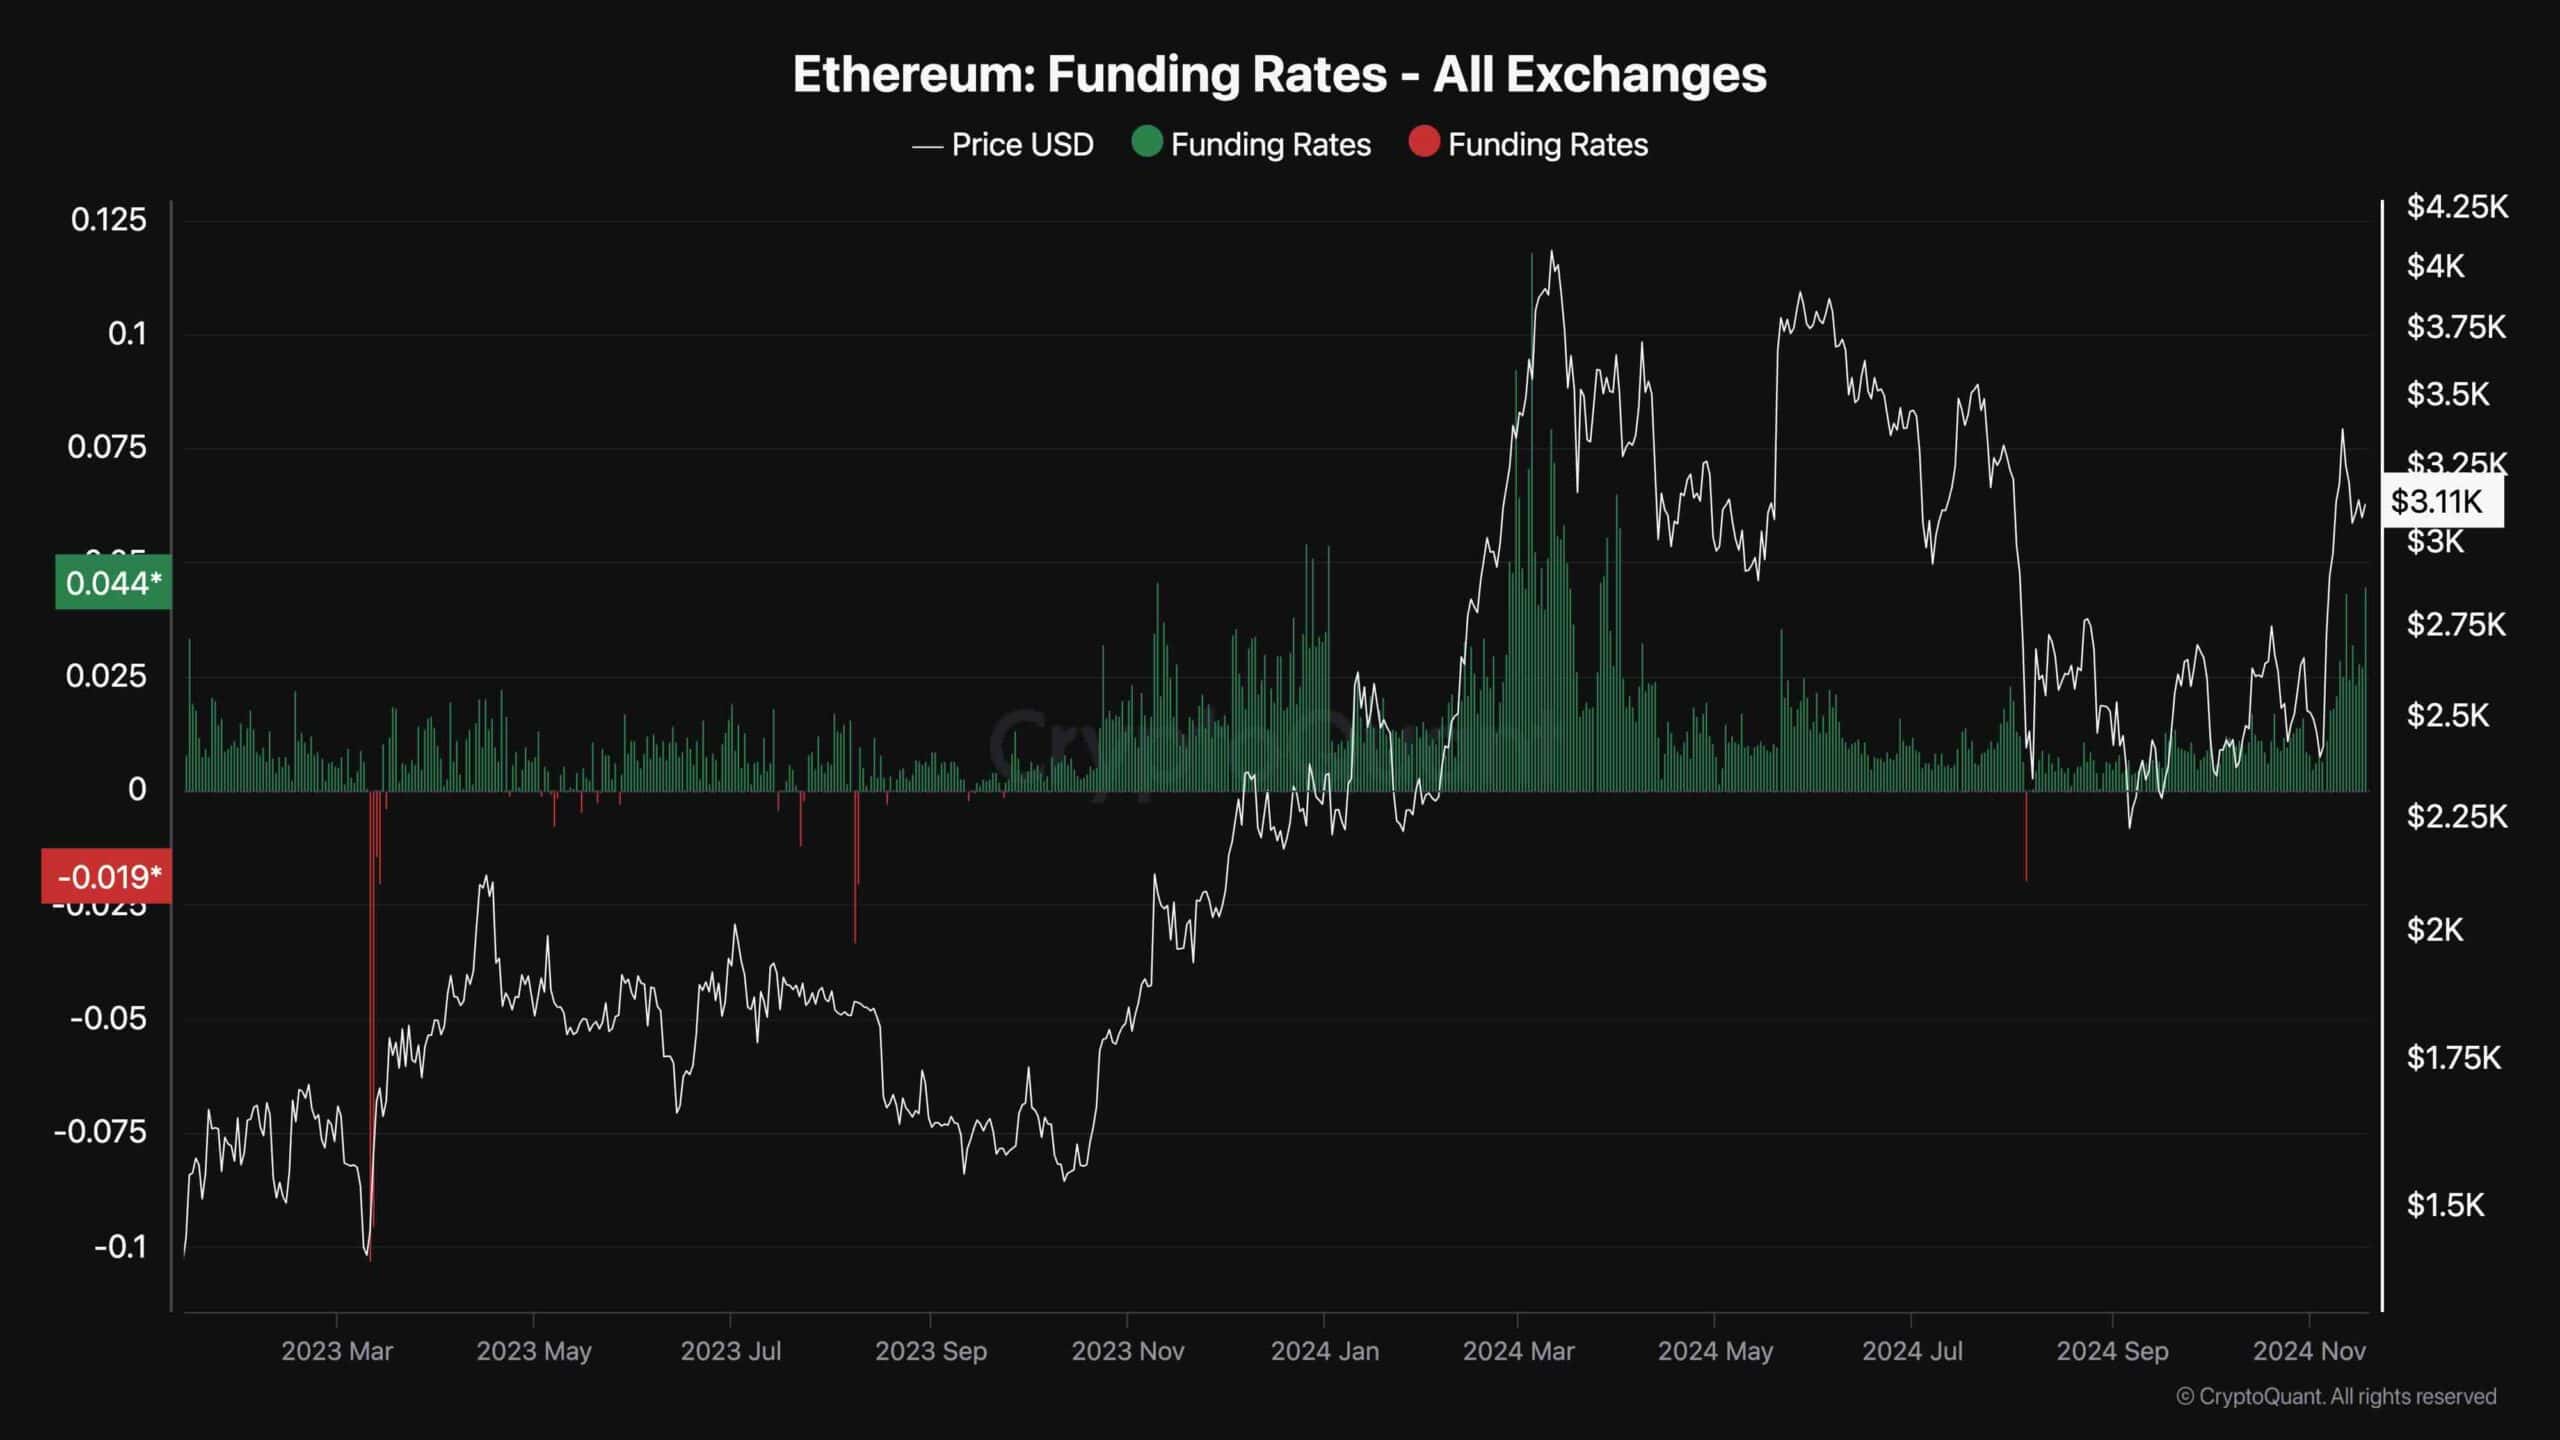
With Ethereum experiencing a retracement phase, futures market sentiment offers valuable insights into potential short-term fluctuations.
The funding rates for Ethereum futures have spiked significantly following the climb above $3K. This indicates increased buying activity in the futures market, reflecting strong demand and optimism among traders.
Despite Ethereum reaching new highs, the current funding rate levels remain significantly lower than those observed the last time ETH was trading at this price range earlier in the year. This discrepancy suggests that while demand is robust, the futures market is not yet approaching overbought or overly speculative conditions.
As a result, the current sentiment supports Ethereum’s potential to continue its upward trajectory in the coming months.

The post Ethereum Price Analysis: Is ETH in Danger of Falling Below $3K Soon? appeared first on CryptoPotato.


