Ethereum Price Analysis: Is $3K Imminent for ETH Following 5% Daily Dump
The Ethereum price has been dropping since getting rejected from the $4,000 resistance level. In the past 24 hours, the selling intensified and the bears are seemingly targeting the important resistance level at $3,000.
Technical Analysis
By TradingRage
The Daily Chart
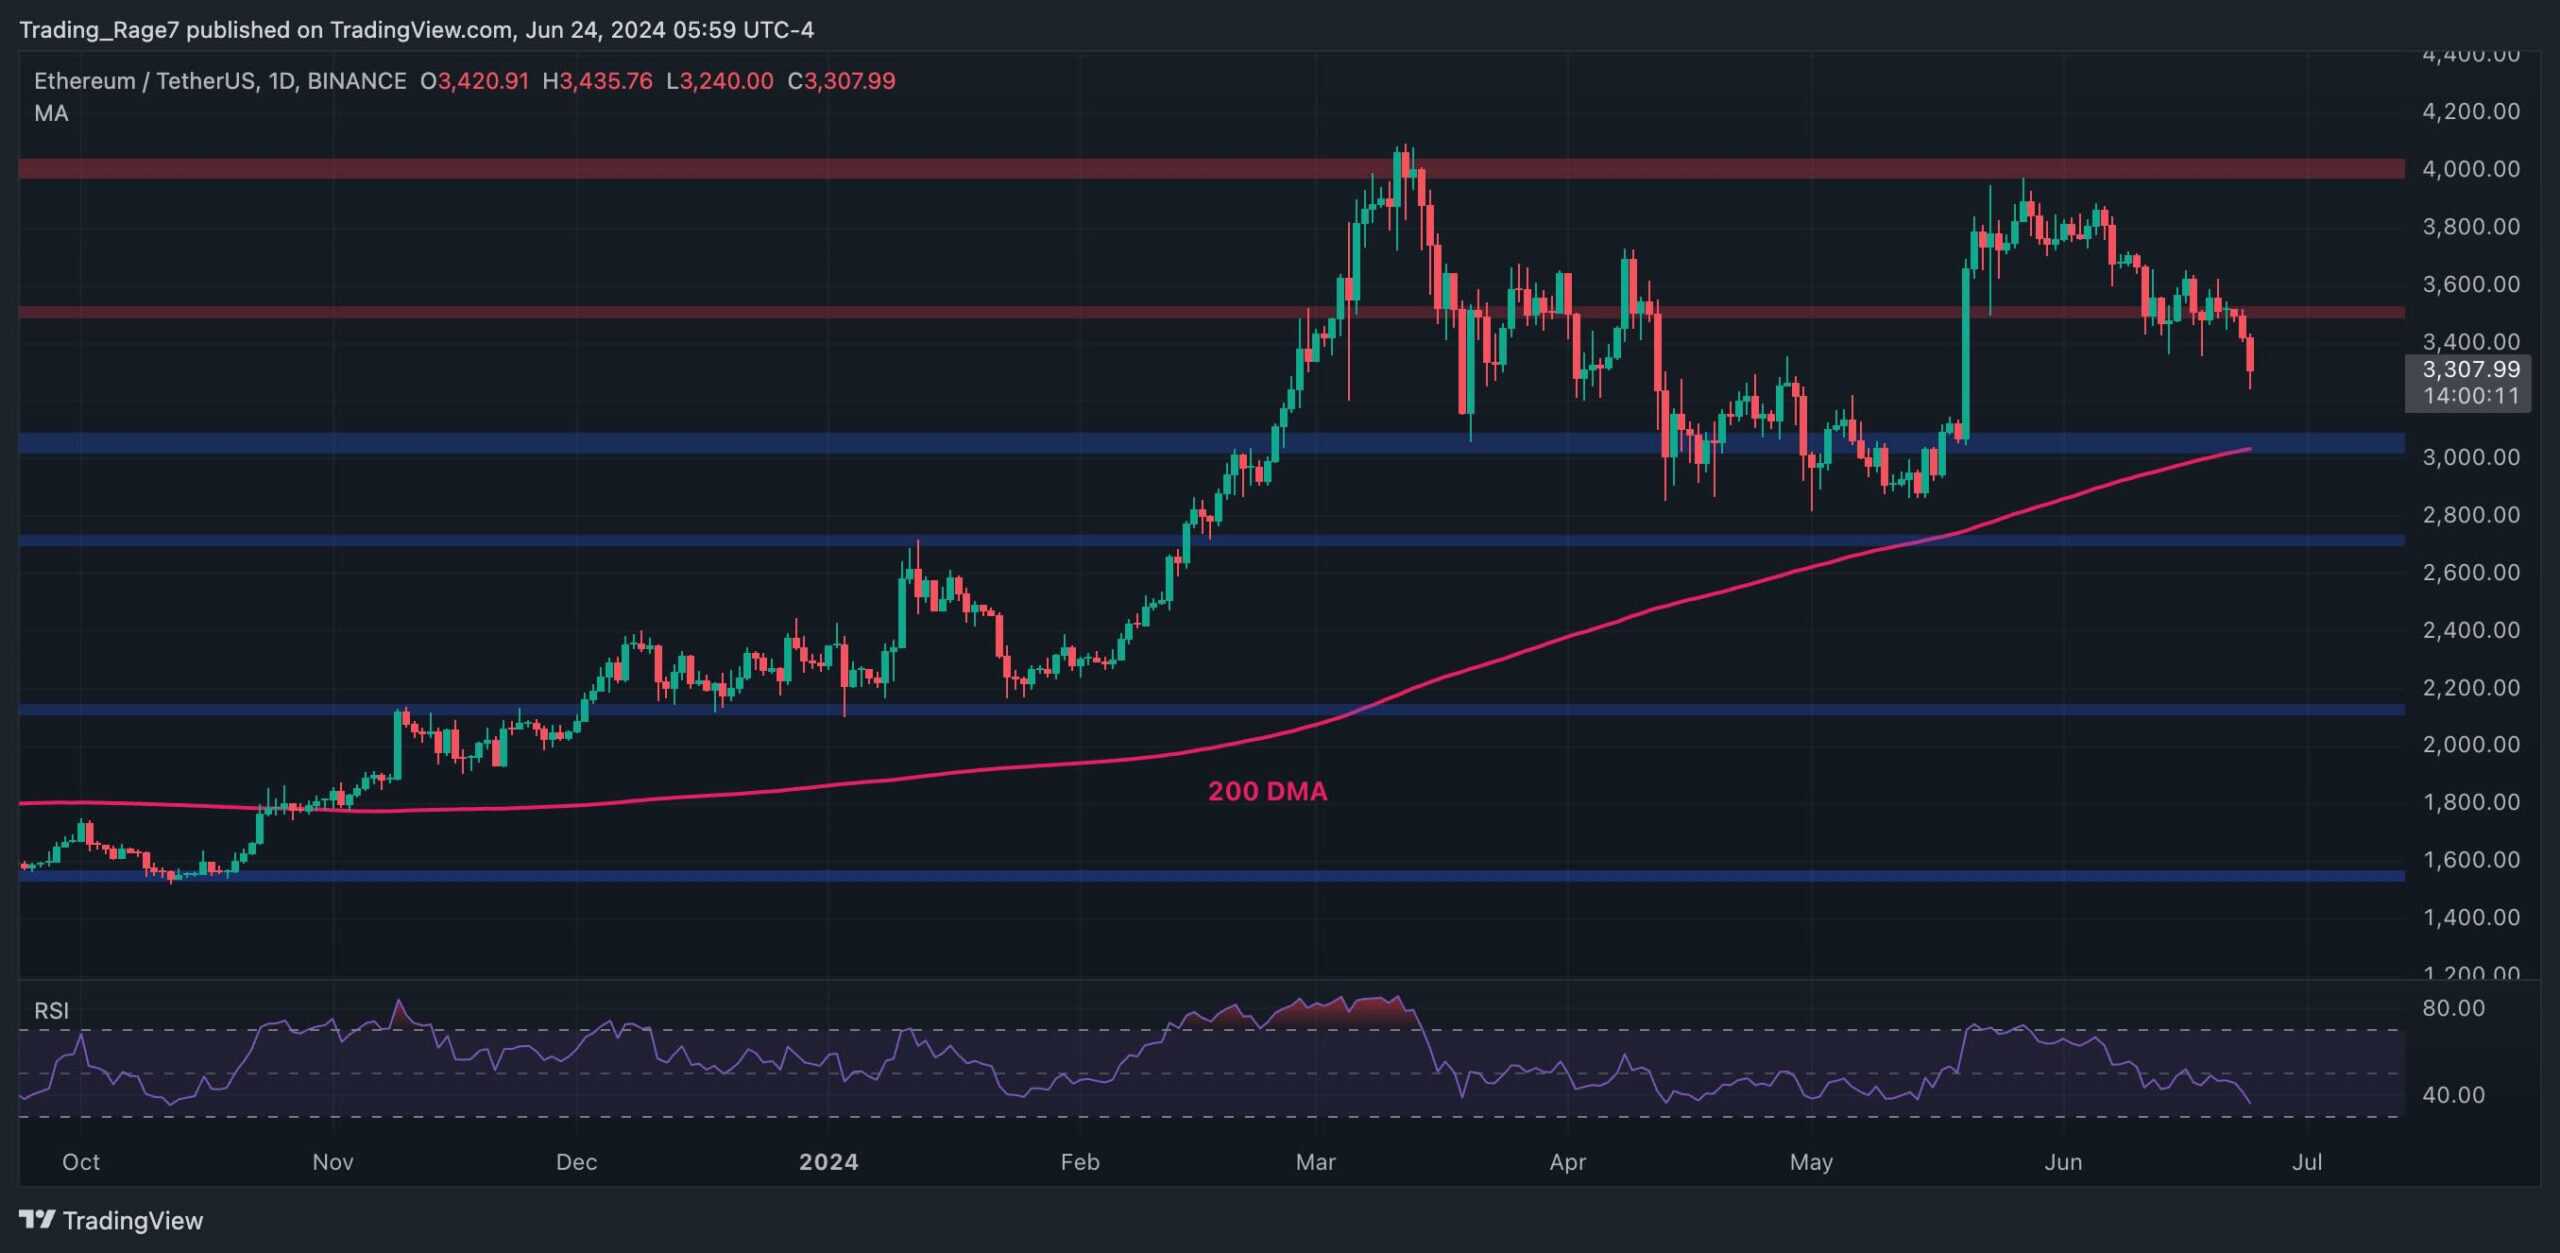
The daily chart shows that the price has dropped below the $3,600 level and is rapidly approaching the $3,000 support zone. The 200-day moving average is also around the $3,000 mark, further boosting the importance of this level.
The Relative Strength Index has dropped below 50%, indicating that the momentum has shifted bearish. If the $3,000 level breaks down, things can get ugly for ETH, as a further drop toward $2,800 and even the $2,200 zone could be expected.

The 4-Hour Chart
Looking at the 4-hour timeframe, the price has been making lower highs and lows since the rejection from the $4,000 resistance level.
At the moment, the cryptocurrency is approaching a long-term bullish trendline. A break below it would probably result in a bearish phase in the coming weeks.
Yet, the RSI has dropped below %30, making ETH oversold on the 4-hour chart. Therefore, a rebound from the trendline or the $3,000 level is still possible.

Sentiment Analysis
By TradingRage
Funding Rates
While the Ethereum price has been trending down after failing to break above the $4,000 level and rally toward its all-time high, the futures market sentiment is weakening.
This chart presents the Ethereum funding rate metric. It measures whether the buyers or the sellers are more aggressively executing their orders. Positive funding rates indicate bullish sentiment, while negative ones are associated with bearish sentiment.
Currently, the funding rates are declining as the price is trending down. While this shows the sentiment is gradually shifting, it might not be bad for the price. This is because of the probability of a long liquidation cascade, or the magnitude of a possible one, as the futures market is cooling down.

The post Ethereum Price Analysis: Is $3K Imminent for ETH Following 5% Daily Dump appeared first on CryptoPotato.


