Ethereum Price Analysis: Is $2.7K ETH’s Next Target After Gaining 6% Daily?
On a larger scale, Ethereum’s price has been declining, almost clearing all of its gains since the beginning of 2024.
Yet, things might be about to change soon, which was hinted at in the developments in the past 24 hours.
Technical Analysis
By Edris Derakhshi (TradingRage)
The Daily Chart
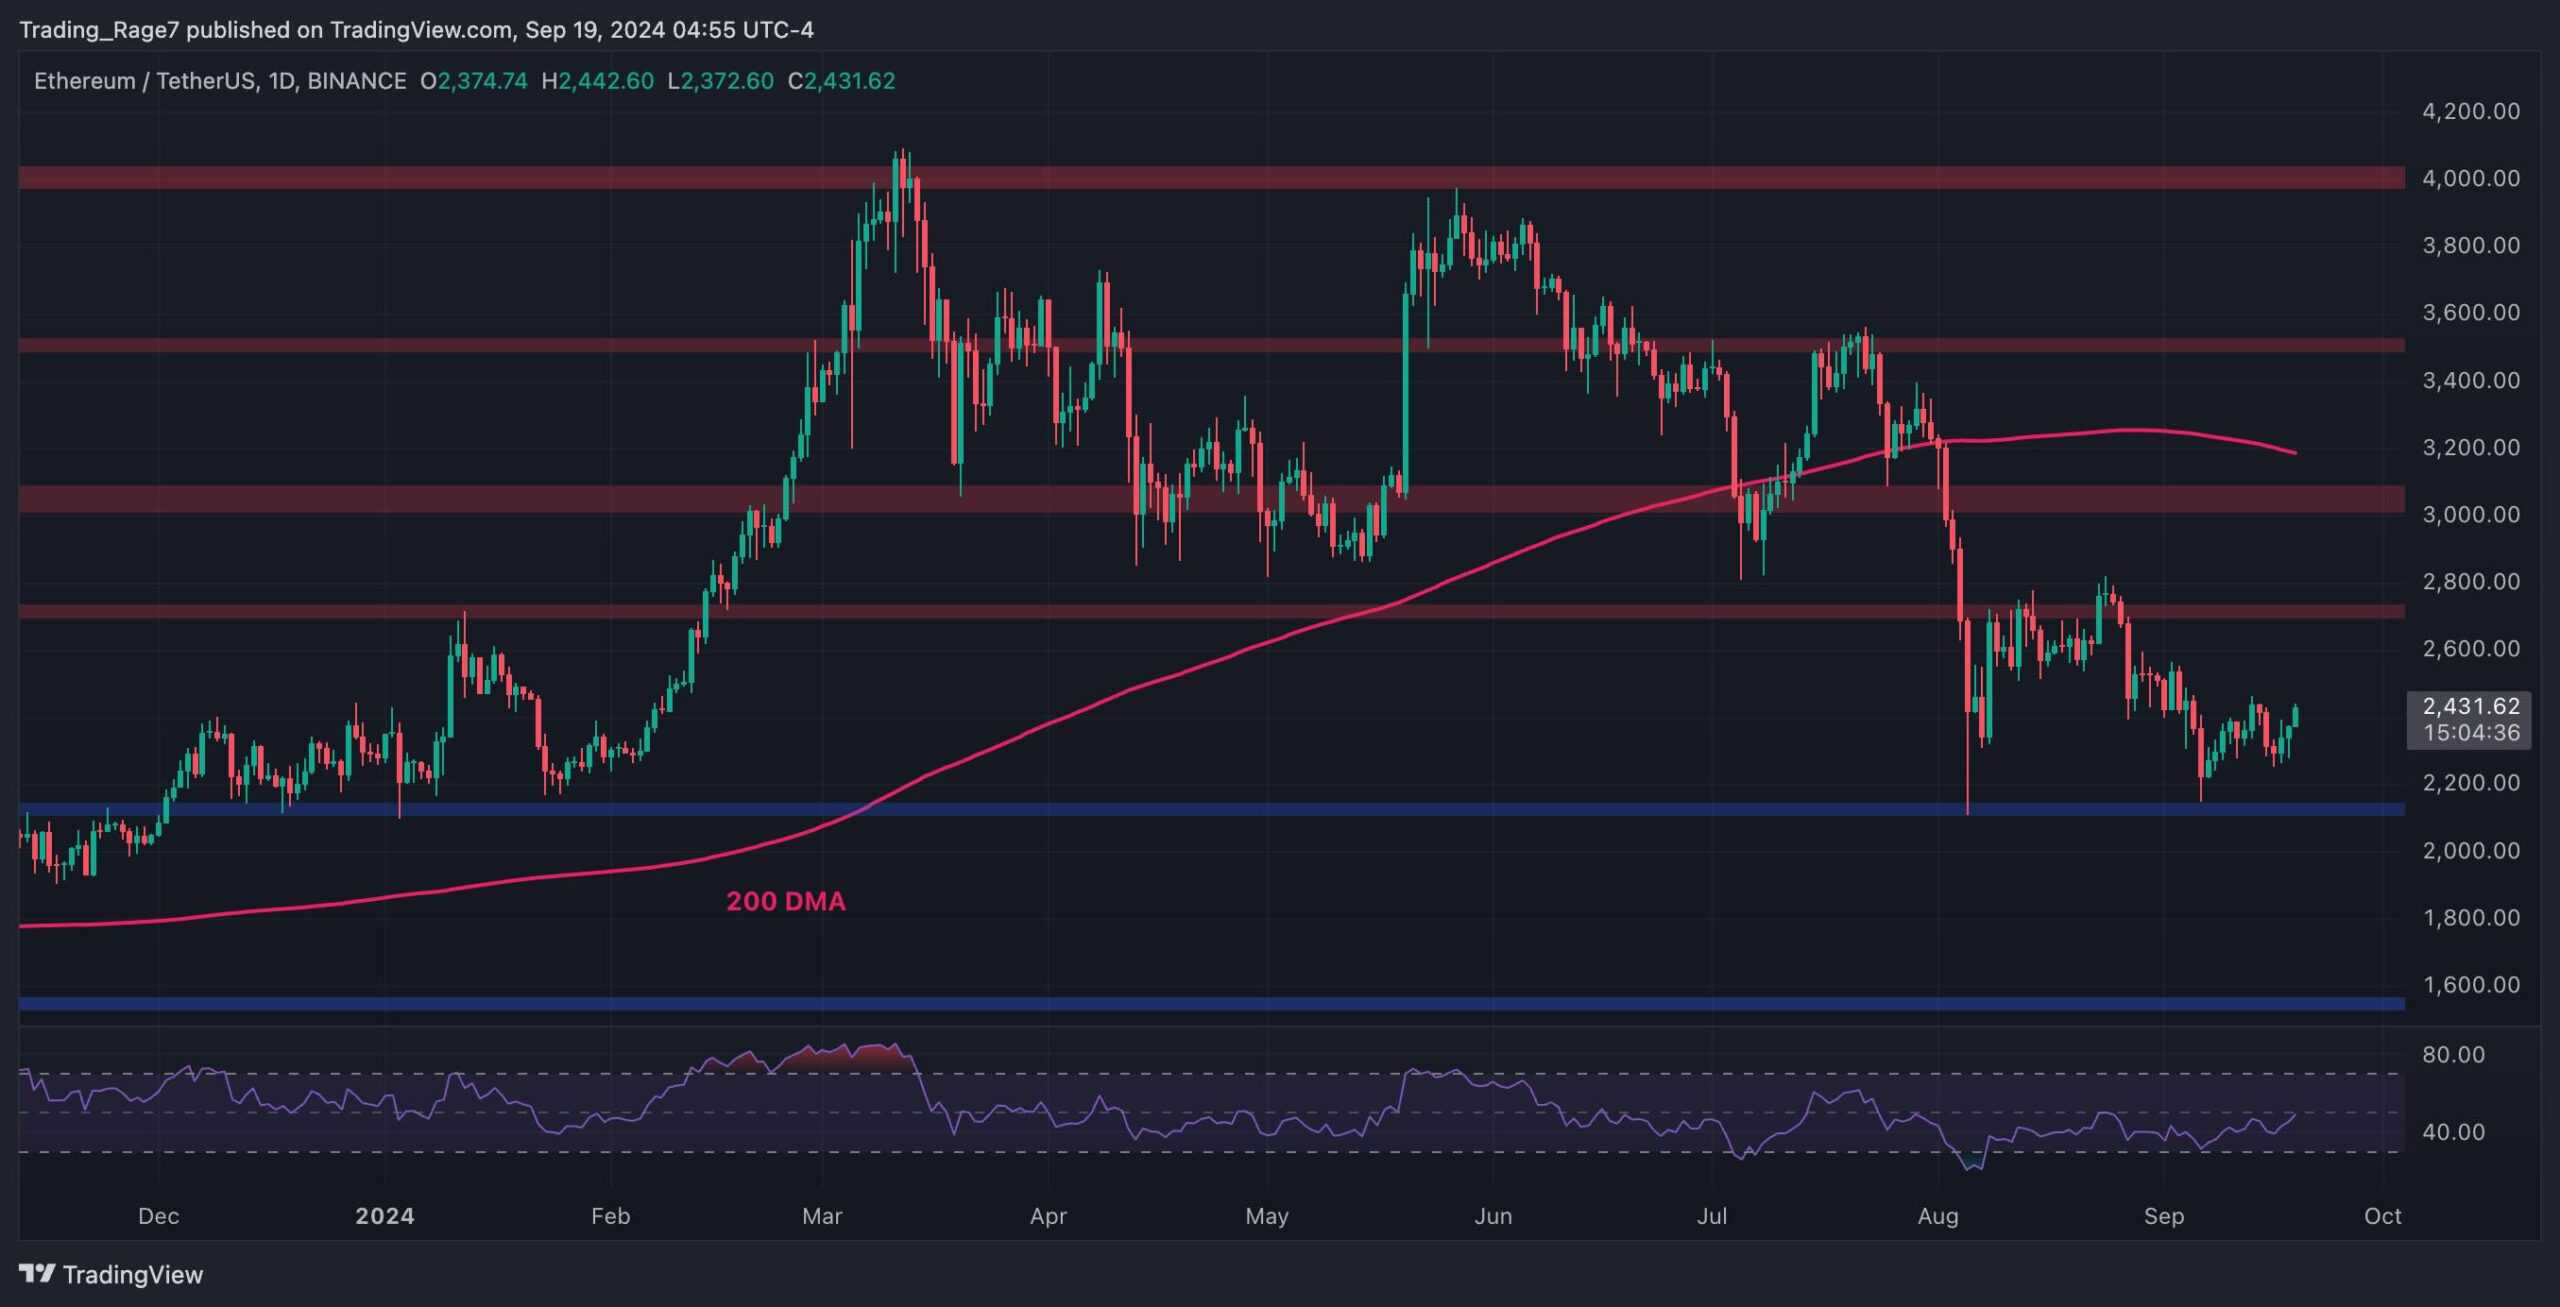
On the daily chart, the asset has been consolidating in a wide range between the $2,100 and $2,700 levels as the drop has seemingly come to a halt. However, the market structure remains bearish, as the price should at least reclaim the $2,700 level to make a higher high.
Meanwhile, looking at the recent range, the recent movements seem to indicate the formation of a price bottom. So, while too soon to anticipate, a new uptrend seems probable in the coming months. This is, of course, if the $2,100 support level remains intact.
The 4-Hour Chart
The 4-hour chart presents a more clear demonstration of the recent price action. As evident, the market immediately bounced from the $2,100 support zone and has been gradually climbing since.
While the momentum is still weak, it could only be a matter of time before an impulsive move toward the $2,700 resistance level occurs, as the bullish 4-hour candles have been getting stronger recently.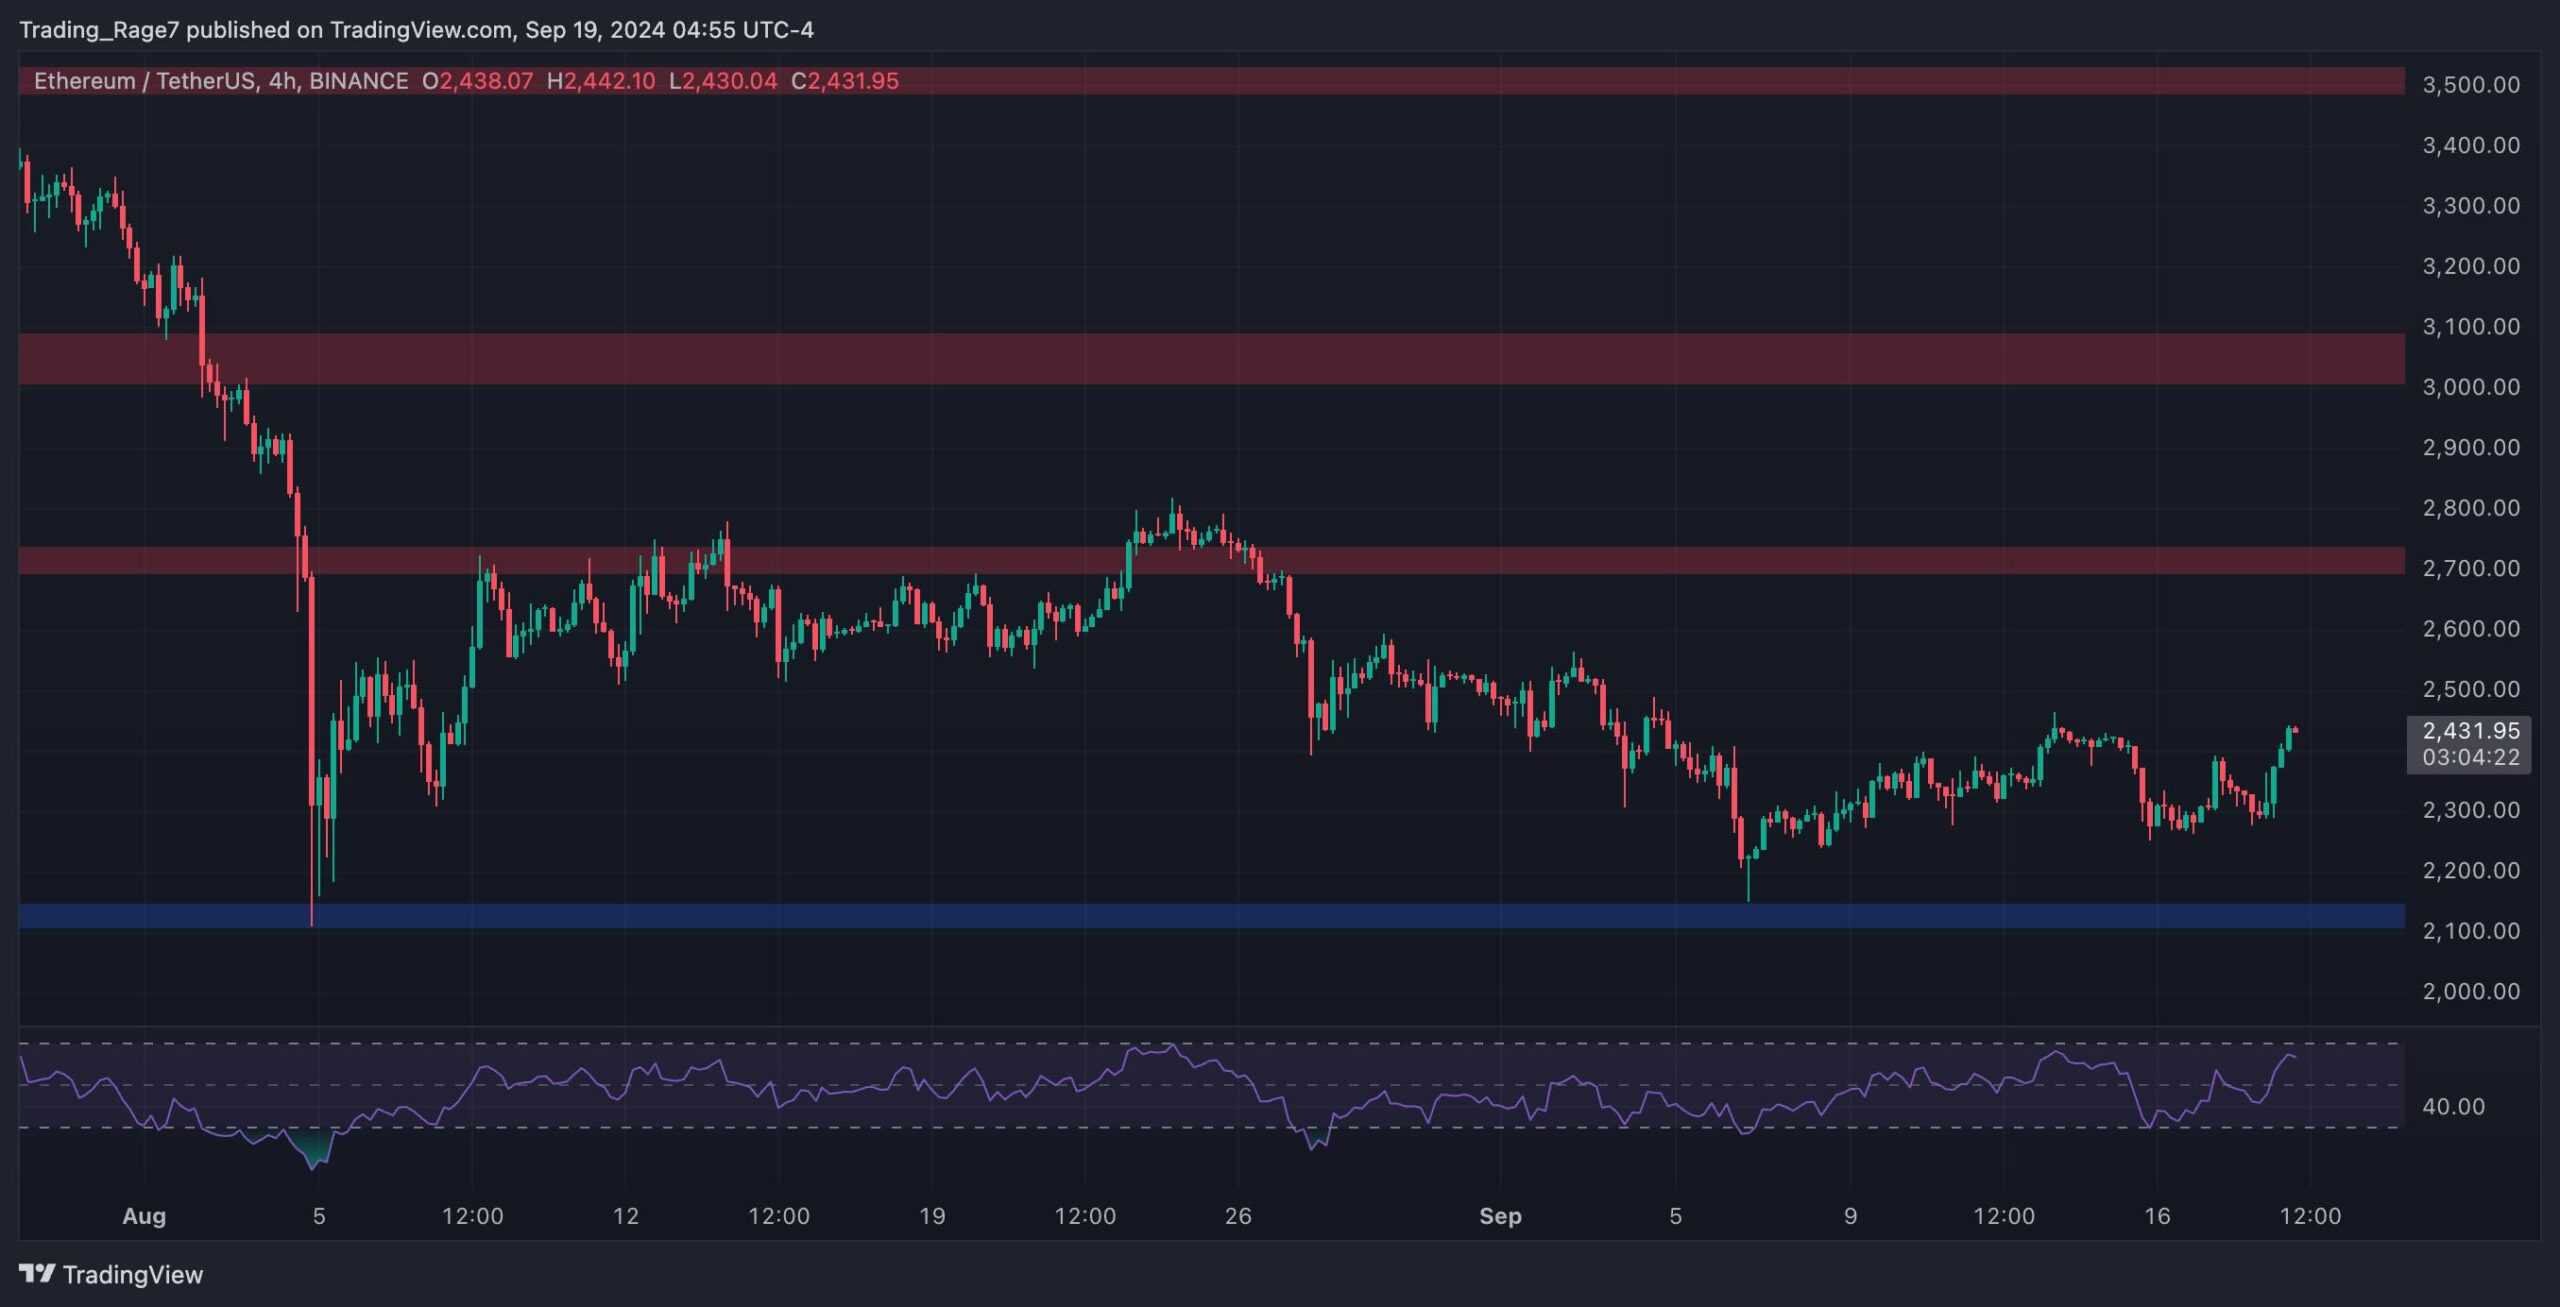
Sentiment Analysis
By Edris Derakhshi (TradingRage)
Ethereum Exchange Reserve
While Ethereum’s price seemingly creates a bottom based on technical analysis, a worrying signal arises from on-chain analysis. This chart presents the Ethereum exchange reserve, the total amount of ETH held in exchanges. The metric is a proxy for supply, as these coins can be sold anytime and add to the selling pressure.
As the chart displays, the overall trend for the exchange reserve metric has been downward, as investors have seemingly been accumulating on aggregate since last year. However, short-term fluctuations also matter, as each time the exchange reserve has risen above its 30-day moving average recently, a price drop follows it.
The same behavior is occurring, as the exchange reserve has been rising recently and is already above its 30-day moving average. Therefore, a further price drop is still possible in the short term if sufficient demand is absent to meet the supply.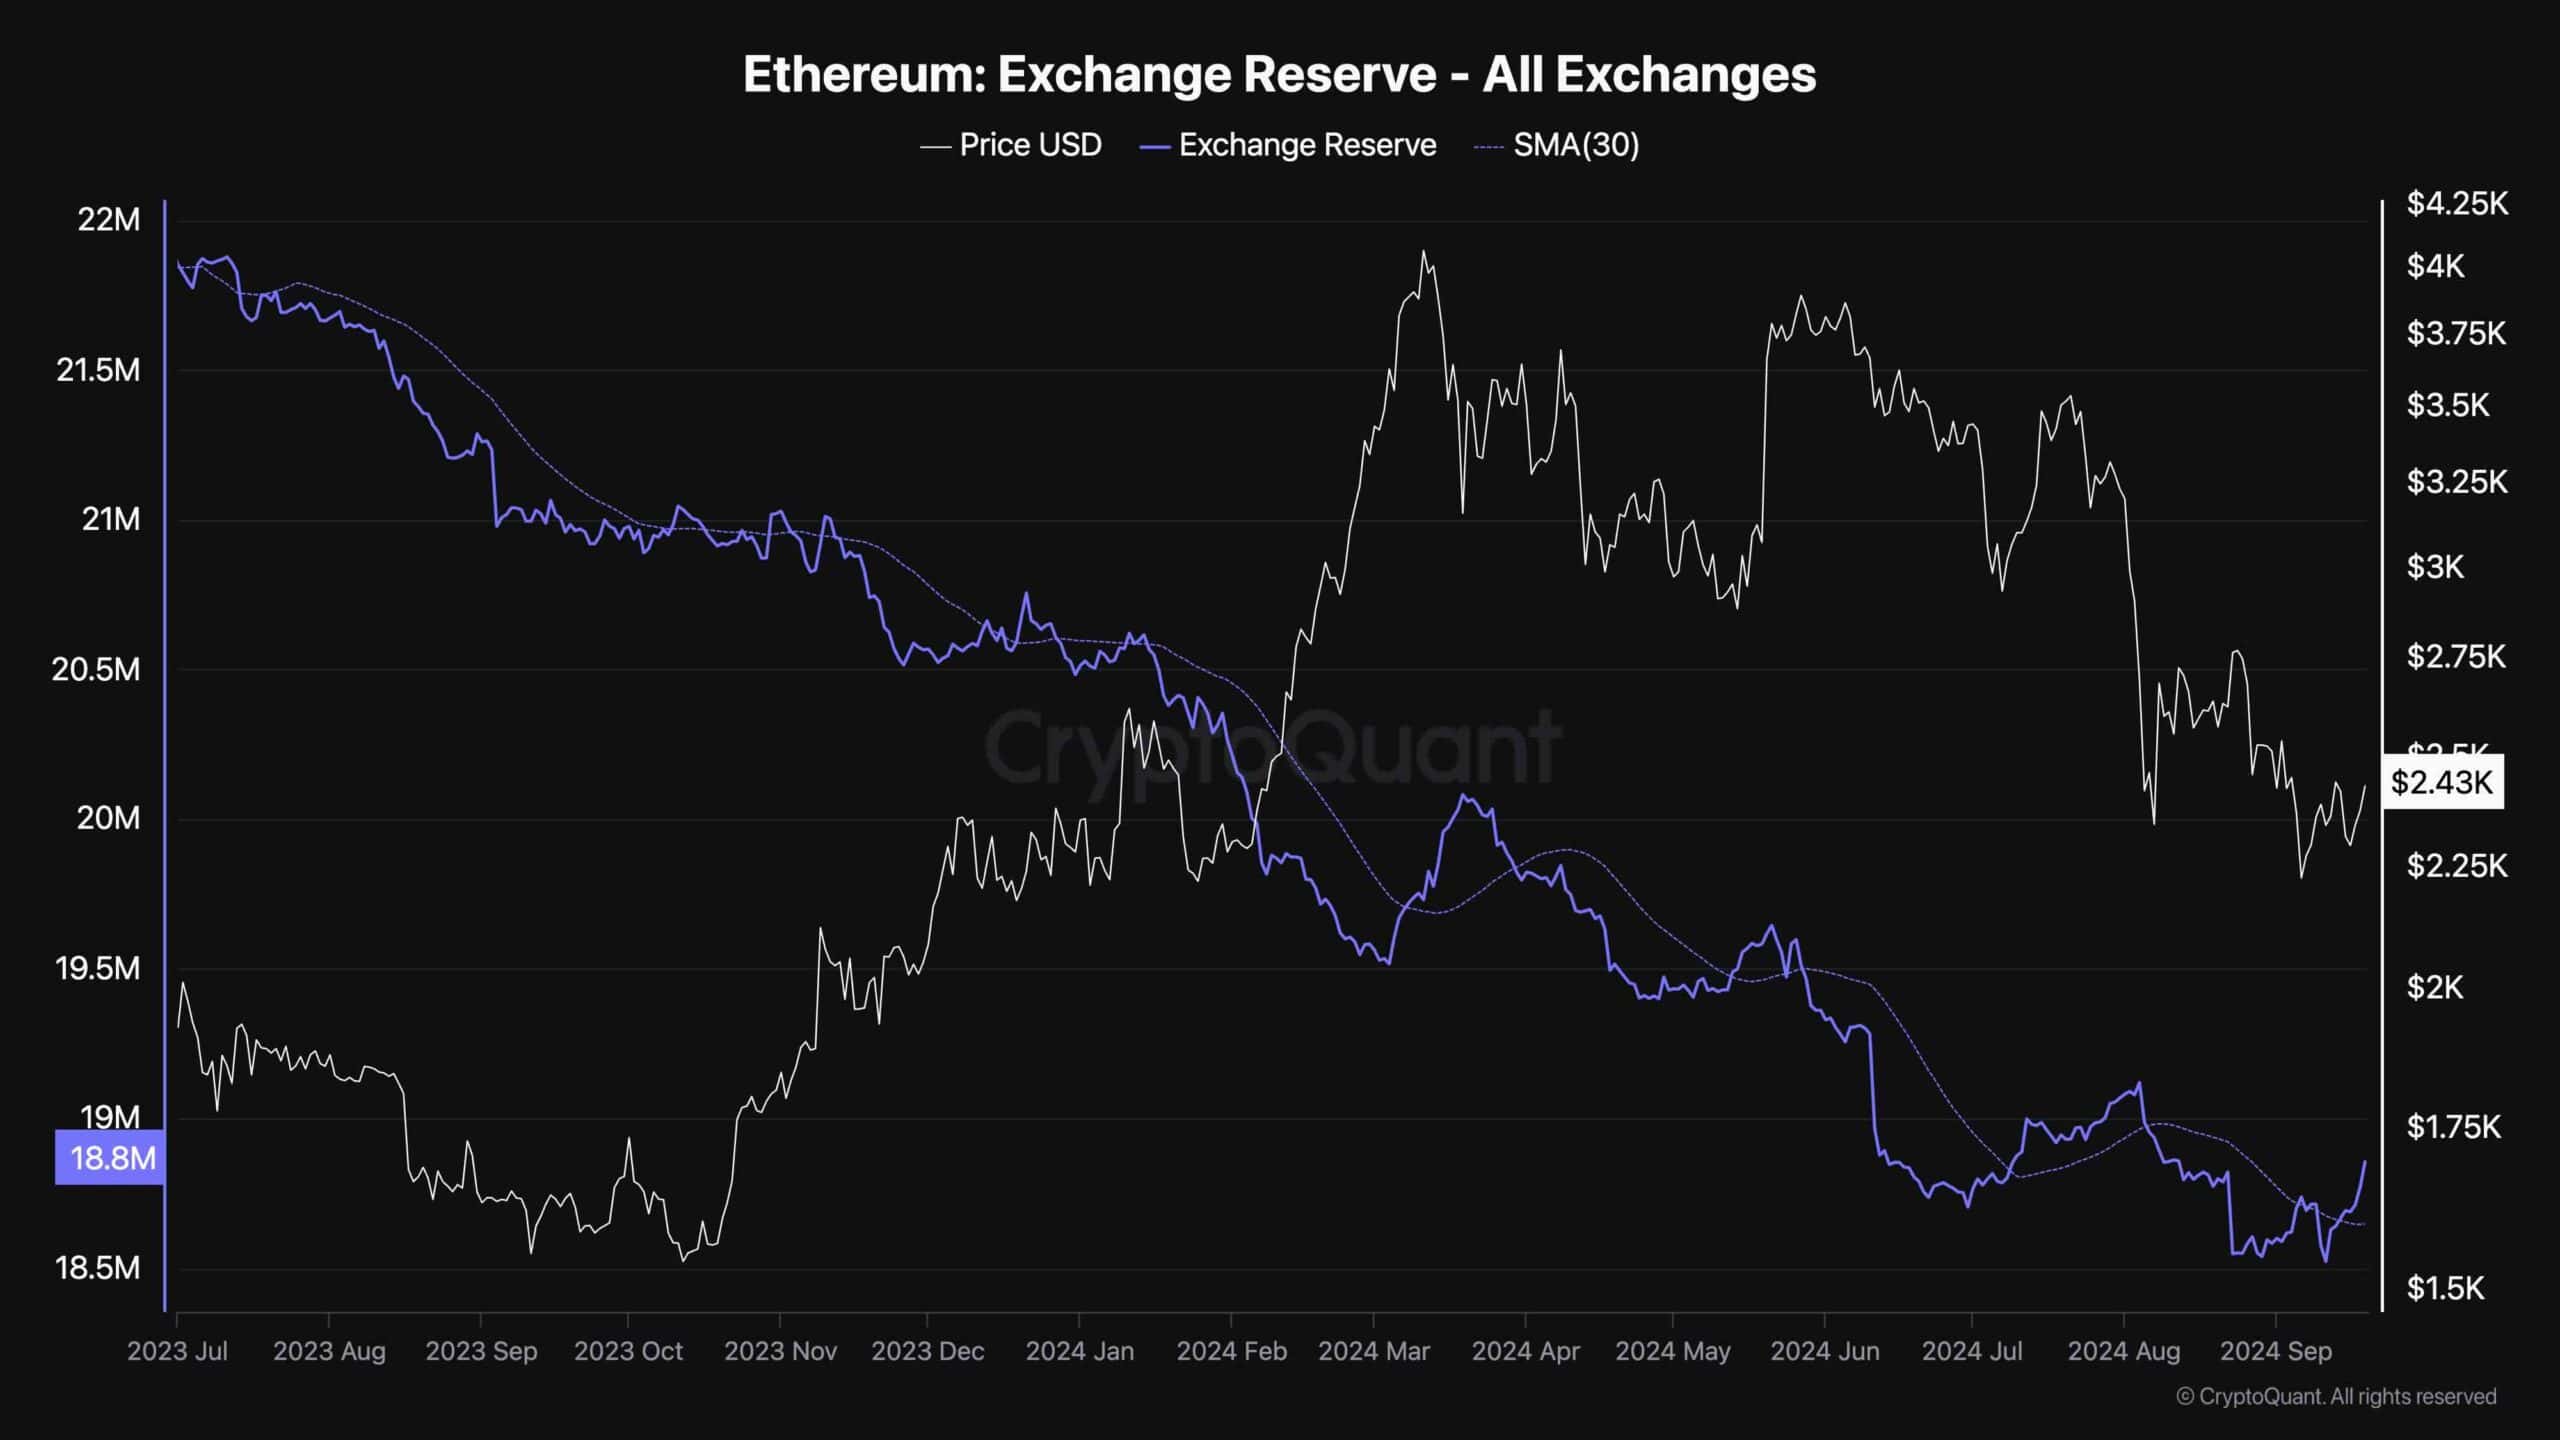
The post Ethereum Price Analysis: Is $2.7K ETH’s Next Target After Gaining 6% Daily? appeared first on CryptoPotato.


