Ethereum Price Analysis: Here’s the Most Probable Level for a Recovery After ETH Crashes 5% Daily
As Ethereum’s price continues to trend lower, investors are wondering whether the bull market is over. Yet, there is still a key support level that can provide the staging grounds for a recovery.
Technical Analysis
By TradingRage
The Daily Chart
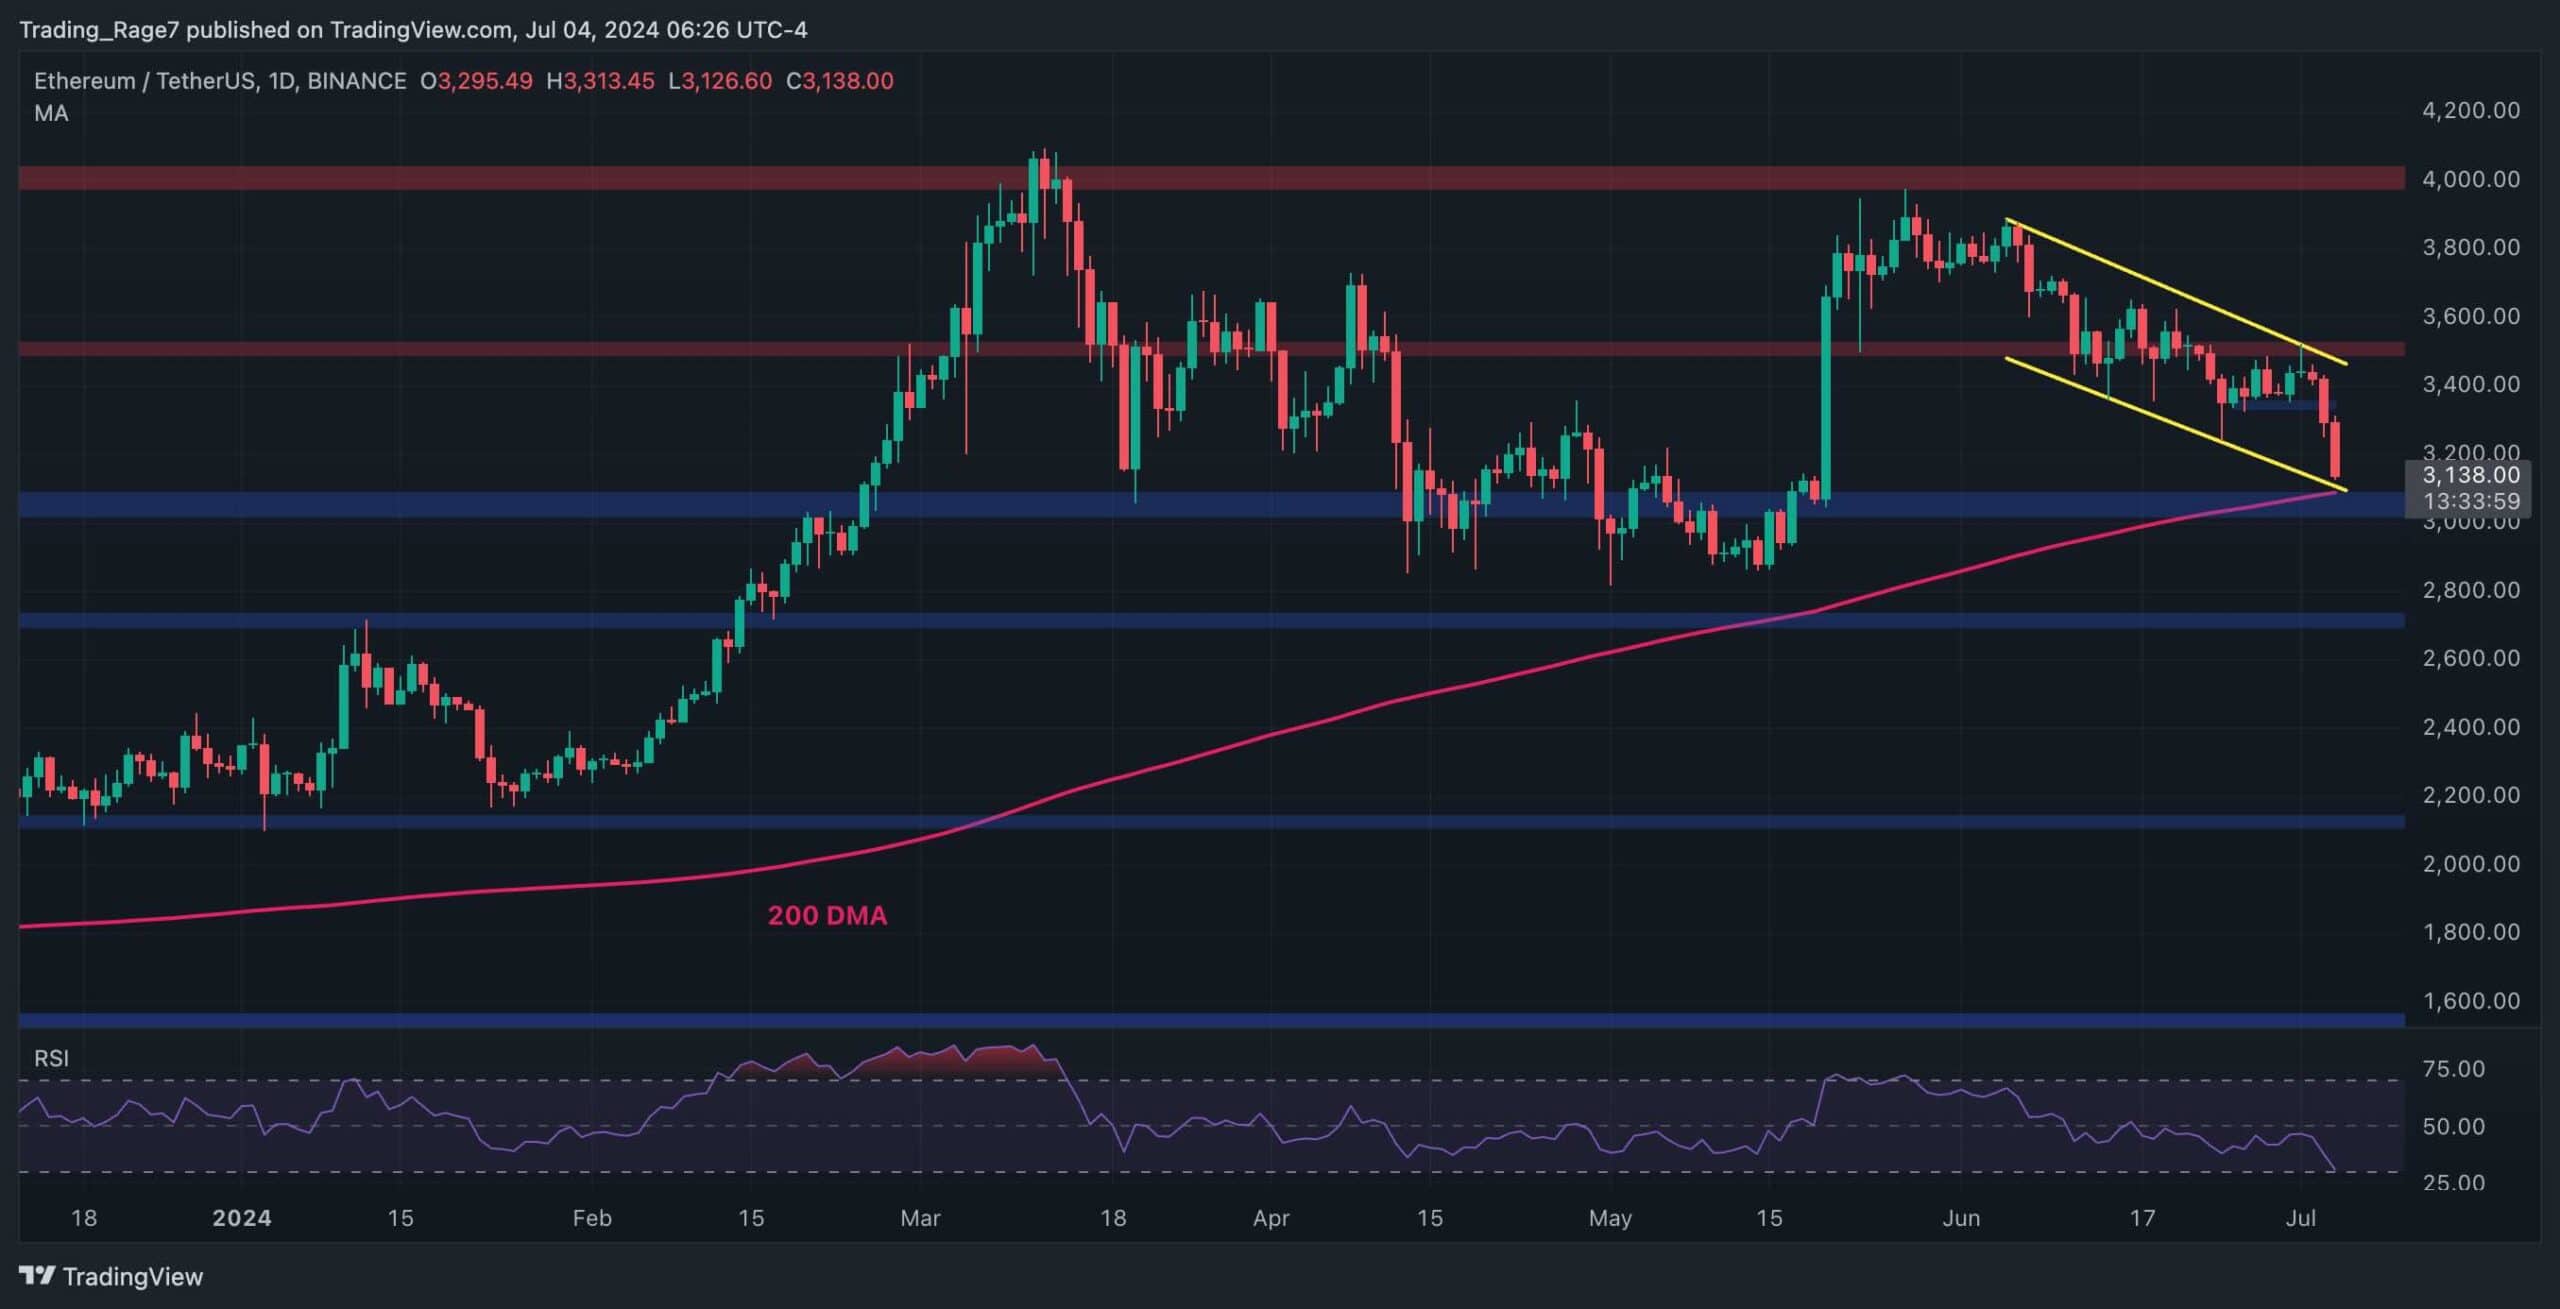
On the daily chart, the price has been trending lower inside a large descending channel pattern. In the last few days, the market has failed to reclaim the $3,500 level, and it dropped lower following a bearish rejection.
Currently, a decline toward the $3,000 support level, which coincides with both the lower boundary of the channel and the 200-day moving average, could be expected.
While this confluence of support elements makes $3,000 a strong support zone, if it gets broken down, things can get much worse very quickly.
The 4-Hour Chart
The 4-hour timeframe shows a clear picture of the price’s rejection from the $3,500 resistance level. The $3,350 short-term support zone is also getting broken to the downside, making $3,000 a probable upcoming target for ETH.
et, investors should keep an eye on the RSI, as it has entered the oversold region, which could point to a potential recovery soon.

Sentiment Analysis
By TradingRage
Taker Buy Sell Ratio
Analyzing the futures market metrics for Ethereum can be a great complement to price analysis. This chart demonstrates one of the most useful futures market metrics, the Taker Buy Sell Ratio.
It measures whether the buyers or sellers are more aggressive in executing their orders on aggregate.
As the chart demonstrates, following the rejection from the $4,000 level, a huge volume of market sell orders has been executed in the futures market, bringing the Taker Buy Sell Ratio to its lowest value in the past few months. This indicates that futures market traders believe the price will be dropping even lower in the short term.

The post Ethereum Price Analysis: Here’s the Most Probable Level for a Recovery After ETH Crashes 5% Daily appeared first on CryptoPotato.