Ethereum Price Analysis Feb.18: ETH Finds New Monthly Highs Over $140
The ETH market has seen a recent price surge: a remarkable 10% over the past 24 hours of trading, getting the ETH price action up to over $140, at the time of writing.
The market cap of Ethereum is currently $14.5 billion as it comfortably sits in the second position of the largest cryptos by market cap.
Looking at the ETH/USD 1-Day Chart:
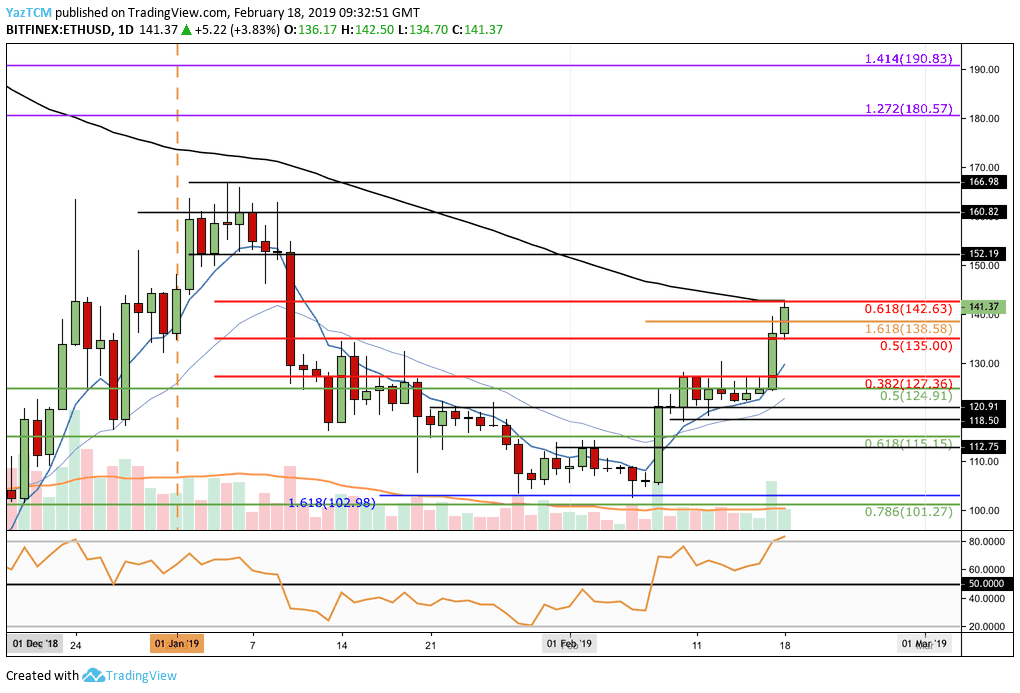
- Following our previous analysis, we can see that Ethereum had held the support at the $120 area. The market surge had broken through resistance levels of $127.36, $130, $135 and $138.58.
- ETH/USD is now facing resistance at the bearish .618 Fibonacci Retracement level (marked in red) located at $142.63. This level of resistance is further bolstered by the 100-day moving average line which currently hovers around the same price level.
- From above: If the bulls can break up $142.63, the next resistance lies at $150 followed by $152 and $160.82.
- The current 2019 high lies at $166.98, breaking above is likely to send ETH to re-test medium term 1.272 ($180) and 1.414 ($190) Fibonacci Extension levels (marked in purple).
- From below: Nearest support lies at the bearish .5 ($135) and .382 ($127) Fibonacci Retracement levels (marked in red).
- Further support beneath lies at $120.91, $115.15 and $112.75.
- The RSI is currently in the overbought territories which may indicate that price action may pull back before climbing higher.
- The trading volume has increased over the past three days (which is bullish).
Looking at the ETH/BTC 1-Day Chart:
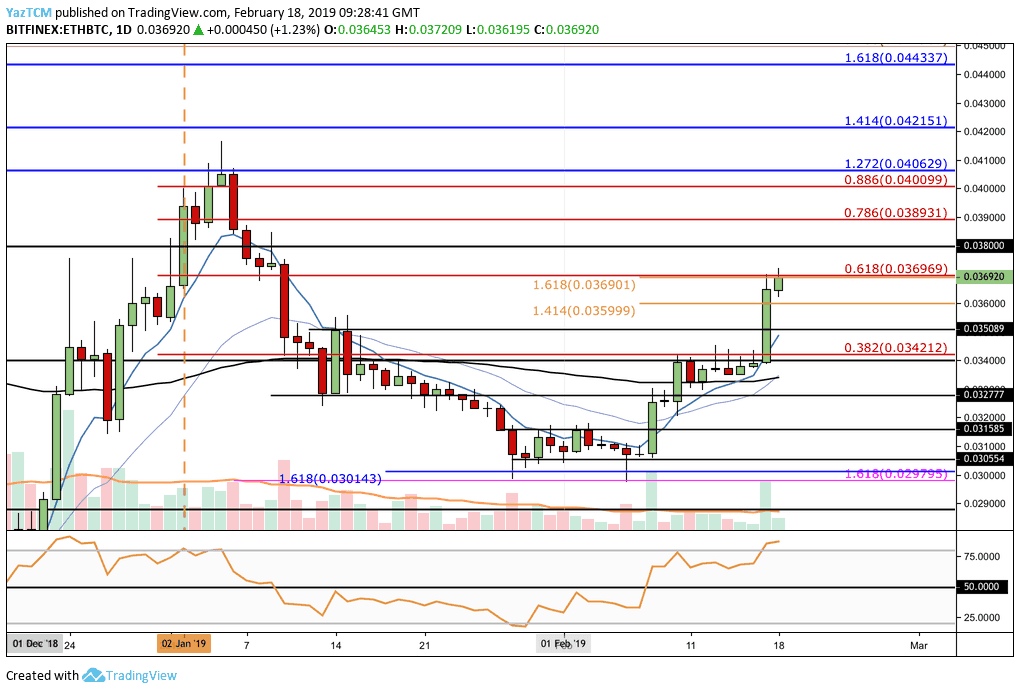
- ETH/BTC has also surged into resistance by the bearish .618 Fibonacci Retracement level (marked in red) located at 0.036969 BTC.
- From Above: Resistance is initially located at 0.038 BTC followed by further resistance at the .786 (0.03893 BTC) and .886 (0.040099 BTC) Fibonacci Retracement levels (marked in red).
- Resistance above 0.041 BTC is expected in the long term 1.414 (0.042151 BTC) and 1.618 (0.44337 BTC) Fibonacci Extension levels (marked in blue).
- From Below: Alternatively, closest support below lies at the previous short term 1.414 Fibonacci Extension level (marked in orange) found036 BTC.
- Below lie the035089 BTC, 0.032777 BTC, and 0.031585 BTC support levels.
- The RSI has reached overbought territory on the daily chart.
- The volume has significantly increased over the past 24 hours.
The post Ethereum Price Analysis Feb.18: ETH Finds New Monthly Highs Over $140 appeared first on CryptoPotato.