Ethereum Price Analysis: ETH Surges To $200, Are The Bad Days Finally Over?
Ethereum has seen a notable 2.85% increase over the past 24 hours which brought its price up to $199. The cryptocurrency now marks a 9.5% surge over the past week which makes it the strongest one from the large-cap top 20 coins. This latest hike is largely a result of ETH recovering against Bitcoin as we continue to head to 0.002 BTC.
Ethereum remains the second-largest cryptocurrency with a market cap of $21.41 billion.
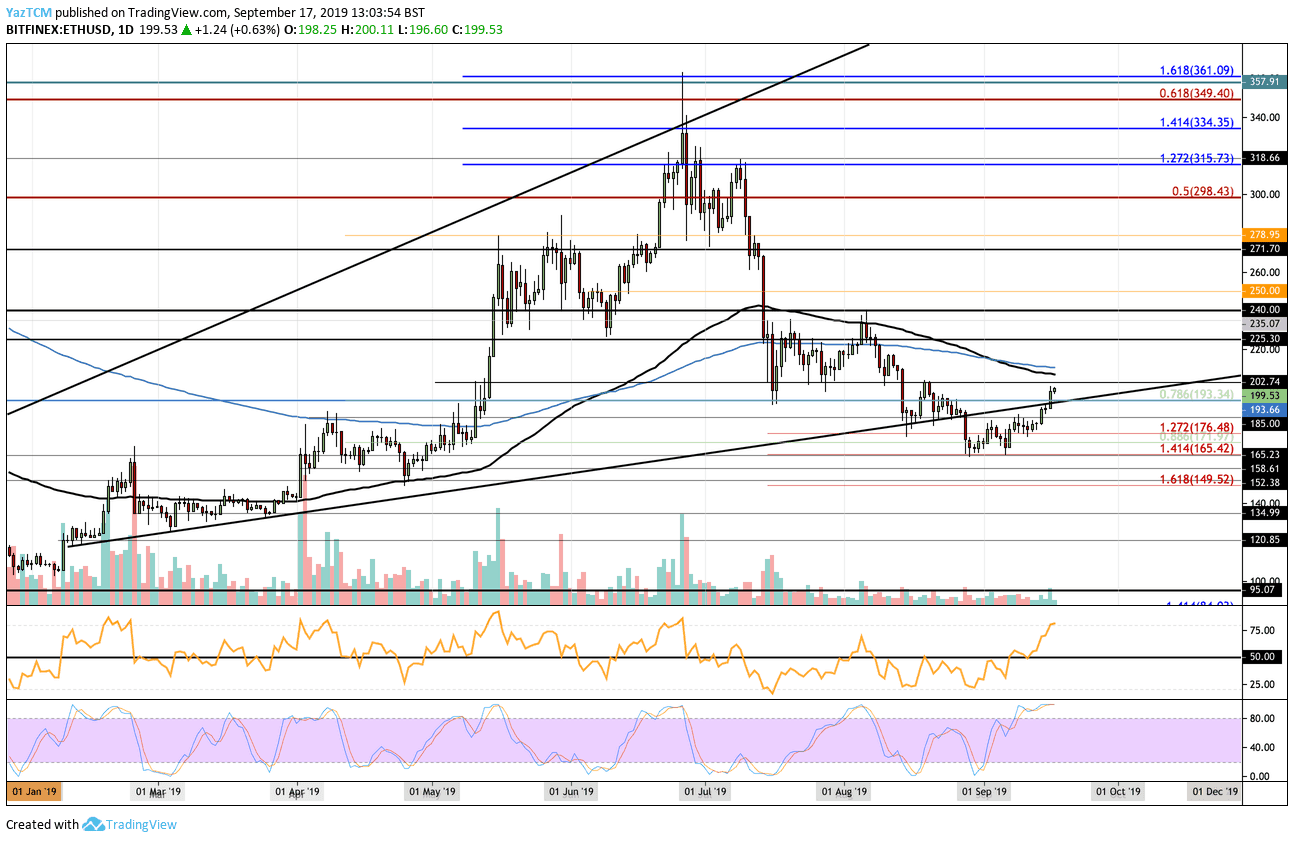
Looking at the ETH/USD 1-day chart:
- Since our previous ETH/USD analysis, ETH continued to increase toward the $200 level. The coin met brief resistance at the previous rising trend line but it didn’t take it long to break above it.
- From above: If the bulls can break above $200, the nearest level of resistance lies at $202. Above this, strong congestion lies ahead between $208 and $210 due to the 100-days and 200-days EMA being located here. Beyond $210, resistance lies at $225, $235, $250, and $250.
- From below: The nearest level of support lies at the rising trend line at around $194. Beneath this, support can be found at $185, $176 (downside 1.272 Fib Extension), $171, and $165.42 (downside 1.414 Fib Extension). If the selling continues, support is then located at $160, $158, $152, and $149.52.
- The trading volume is starting to increase slowly.
- The RSI has recently gone much higher above the 50 level which shows that the bulls are in complete control over the market momentum at the moment. However, the Stochastic RSI is in extreme overbought territory as we wait for a bearish crossover signal which could start a small retracement.

Looking at the ETH/BTC 1-day chart:
- Ethereum continued to recover against BTC after rebounding at the 0.016422 BTC level. The cryptocurrency is now fastly approaching 0.02 BTC. A break above here would confirm a strong bullish press higher.
- From above: The nearest levels of resistance lie at 0.19992 BTC and 0.02 BTC. Above 0.02 BTC, resistance is located at 0.020429 BTC, 0.02158 BTC (100-days EMA), 0.02235 BTC, 0.02362 BTC, and 0.024 BTC.
- From below: The nearest level of support lies at 0.0196 BTC. Beneath this, support is at 0.0189 BTC, 0.018 BTC, 0.0179 BTC, and 0.017670 BTC. If the selling continues, added support is expected at 0.017 BTC, 0.016422 BTC, and 0.01576 BTC.
- The trading volume has increased during September.
- The RSI is also in the strong favor of the bulls at this moment in time. Furthermore, the Stochastic RSI is also trading in overbought conditions as we wait for a bearish crossover signal for a potential market correction.

The post Ethereum Price Analysis: ETH Surges To $200, Are The Bad Days Finally Over? appeared first on CryptoPotato.


