Ethereum Price Analysis: ETH Surges 8% Daily, Eyes All-Time High
Key Support levels: $4,350
Key Resistance levels: $4,868 (ATH)
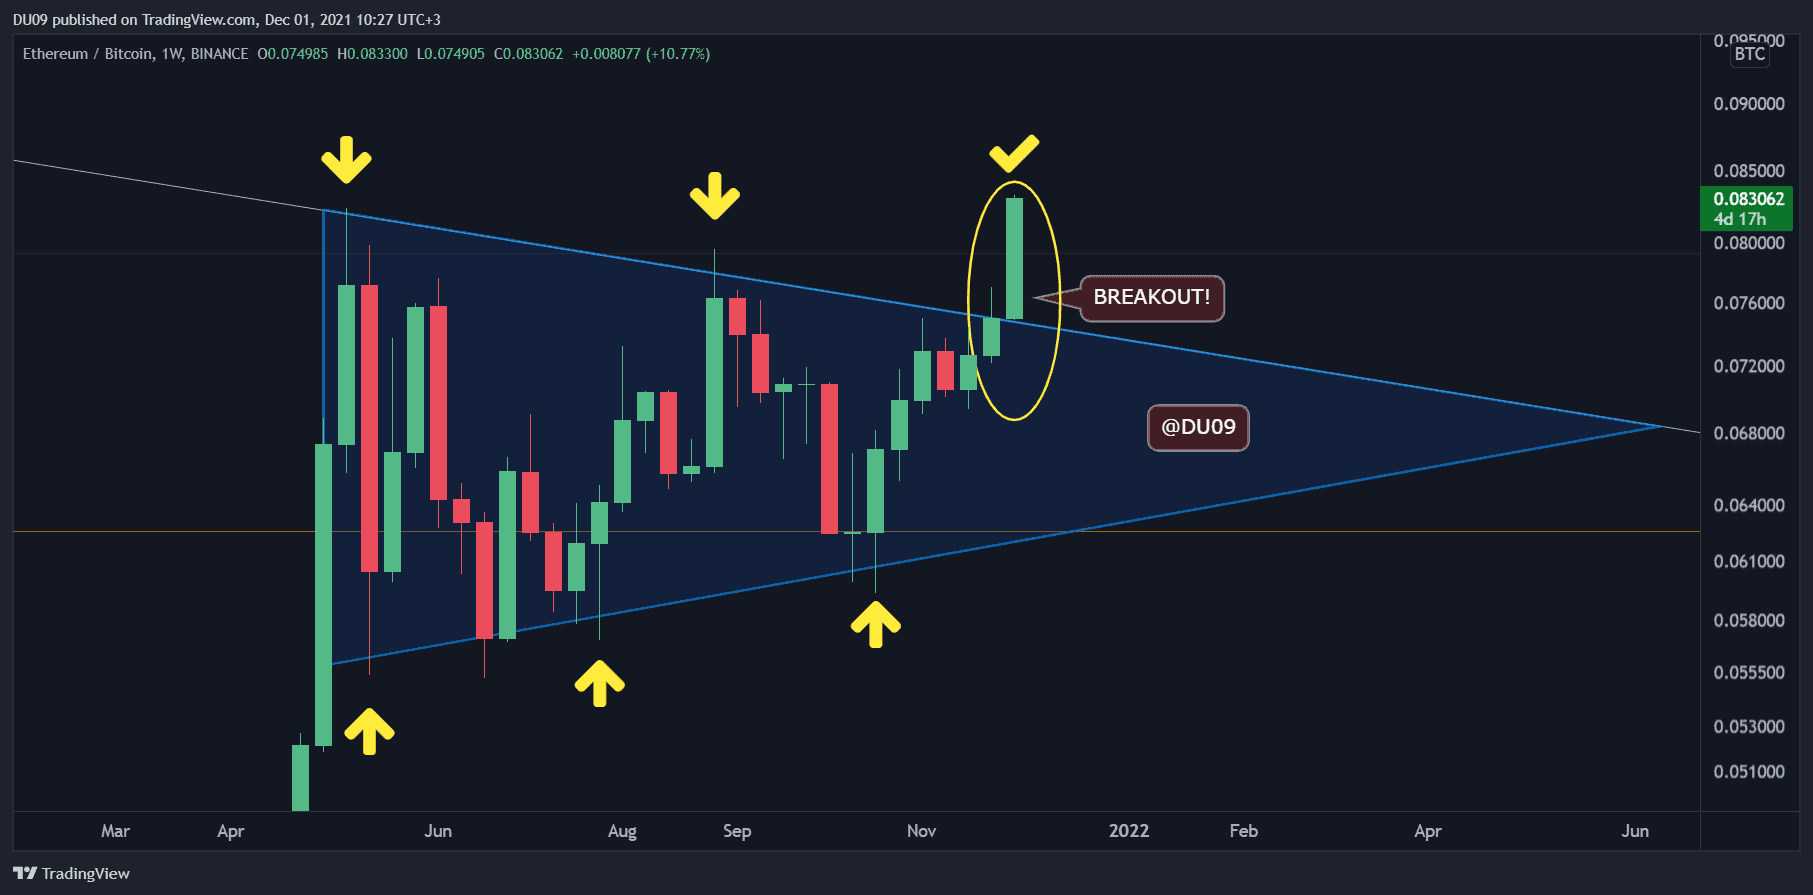
ETH has finally moved above 0.08 BTC on the ETH/BTC chart. With this breakout, the cryptocurrency signals that it is ready to make significant gains against Bitcoin and lead the altcoin market to new heights. This breakout is essential because it represents a resistance line going back to the 2017 top when one ETH was 0.15 BTC.
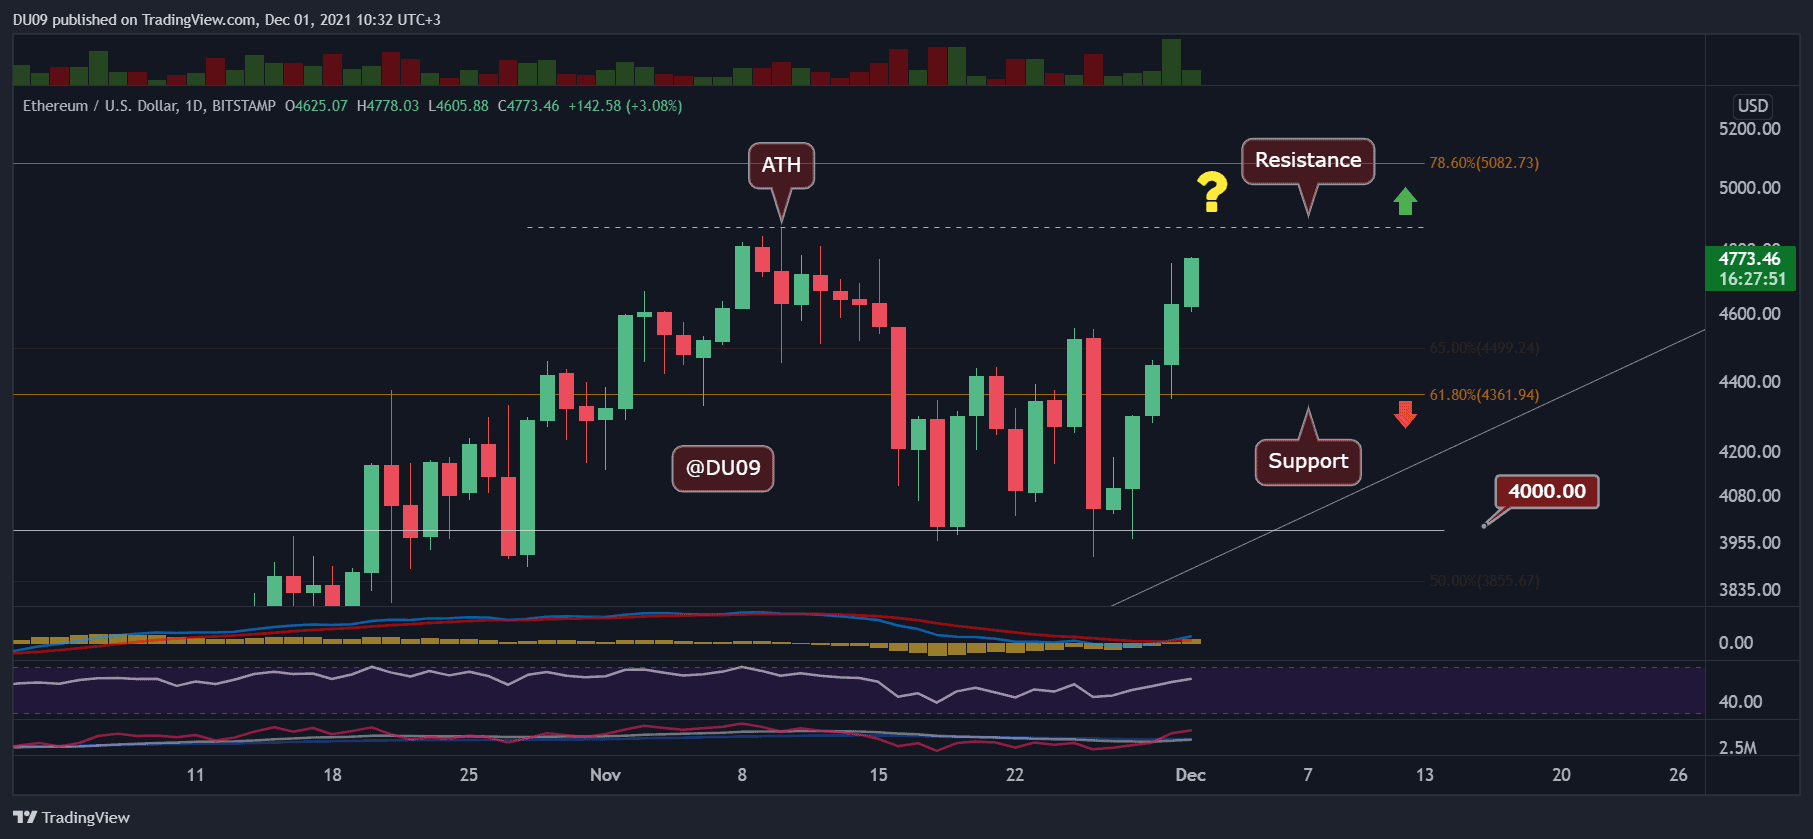
Ethereum rallied on the USD pair as well and it is less than 3% from the all-time high at $4,868. As such, the current support is found at $4,350, and the resistance is represented by ATH. Considering the major breakout versus BTC, ETH seems likely to continue its rally and the only significant resistance left now is the all-time high on the USD chart.
Technical Indicators
Trading Volume: The volume increased as the price moved higher which is bullish and a show of strength. It’s important to monitor the volume closely, especially as ETH approaches the key resistance.
RSI: The daily RSI is curving up and has plenty of space to go higher until it reaches the overbought area (>70) considering it is at 59 at the time of this post.
MACD: The MACD completed a bullish cross yesterday, which is very significant and highlights the start of a new rally for ETH. The last time this happened was on October 1st when ETH rallied 64% until November 10, which is also the date of the current all-time high.
Bias
The bias for ETH is bullish. It is important for ETH to maintain this momentum and break above the key resistance.
Short-Term Price Prediction for ETH
Ethereum’s breakout on the Bitcoin chart and the fact that it is less than 3% from the current all-time high at $4,868 shows that Ethereum is likely ready for a new rally. If it can break above the all-time high, then it will enter price discovery which could lead to a fast price increase.

